Impact Factor ISSN: 1449-2288
- Issue 12; 2026
- Issue 11; 2026
- Issue 10; 2026
- Issue 9; 2026
- Issue 8; 2026
- Volume 22; 2026
- Past Issues
- Advance Articles
- Editorial Board
- Cover Images
- Index & Coverage
- Cover Suggestion
- Special Issues
1. Introduction
2. Materials and methods
3. Results
4. Discussion
5. Conclusions
Abbreviations
Supplementary Material
Acknowledgements
References

 Global reach, higher impact
Int J Biol Sci 2025; 21(4):1530-1544. doi:10.7150/ijbs.107632 This issue Cite
Research Paper
DARS2 Promotes Bladder Cancer Progression by Enhancing PINK1-Mediated Mitophagy
Dongqing Li1#, Hang Su1#, Xiaolin Deng2#, Yuan Huang1, Zihuan Wang1, Jinge Zhang1, Chen Chen1, Zaosong Zheng1, Qiong Wang1, Shanchao Zhao3, Zhe-Sheng Chen4, Haiyong Chen5, Lina Hou6 ![]() , Wanlong Tan1
, Wanlong Tan1 ![]() , Fei Li1
, Fei Li1 ![]()
1. Department of Urology, Nanfang Hospital, Southern Medical University, Guangzhou, Guangdong 510515, P.R. China.
2. Department of Urology, Ganzhou People's Hospital, Ganzhou, P.R. China.
3. Department of Urology, the Fifth Affiliated Hospital of Southern Medical University, Guangzhou, Guangdong 510500, P.R. China.
4. Department of Pharmaceutical Sciences, College of Pharmacy and Health Sciences, St. John's University, Queens, New York, 11439, USA.
5. School of Chinese Medicine, LKS Faculty of Medicine, The University of Hong Kong R619, 3 Sassoon Road, Pokfulam, Hong Kong SAR, China.
6. Department of Huiqiao Medical Center, Nanfang Hospital, Southern Medical University, Guangzhou, Guangdong 510515, P.R. China.
#Contributed equally to the manuscript.
Received 2024-11-26; Accepted 2025-1-8; Published 2025-1-27
Abstract

Globally, bladder cancer is the tenth most common cancer. Mitophagy, a critical process regulating mitochondrial quantity and quality, has attracted increasing attention for its pivotal function in cancer. Nonetheless, its roles and underlying mechanisms in bladder cancer are yet to be elucidated. Therefore, in this study, 16 mitophagy-related genes were screened to construct a robust prognostic model with exceptional predictive accuracy for the outcomes of patients with bladder cancer. Of these genes, DARS2 was identified as a key regulator that significantly affected cancer progression. The findings established that DARS2 promoted the G1-to-S phase transition by upregulating CDK4 expression, thereby suppressing cellular senescence and driving cell proliferation. In addition, DARS2 augmented PINK1 expression, leading to increased PINK1-mediated mitophagy. Both in vitro and in vivo experiments confirmed that DARS2 inhibited cellular senescence and facilitated tumor progression by enhancing PINK1-mediated mitophagy. The observations from this study have provided novel insights into the multifaceted roles of DARS2-mediated mitophagy in bladder cancer. Targeting DARS2 and its regulation of mitophagy is a promising therapeutic strategy to improve the outcomes for patients with bladder cancer.
Keywords: Bladder cancer, DARS2, PINK1, Mitophagy, Cellular senescence
1. Introduction
Bladder cancer (BCa) is one of the most common malignancies of the urinary system and is the fourth most prevalent cancer in men[1]. Worldwide, approximately 573,000 new cases and 213,000 deaths are reported annually, making it a substantial public health concern[1, 2]. The malignant progression of BCa is driven by complex mechanisms, including genetic mutations, epigenetic alterations, and the tumor microenvironment[3-5]. Comprehending the biological drivers of BCa progression is therefore critical for identifying novel therapeutic strategies.
Cellular senescence, an irreversible state of cell cycle arrest, is a hallmark of cancer[6, 7]. This process is characterized by the activation of DNA damage response, resistance to apoptosis, inhibition of cyclin-dependent kinases, and secretion of proinflammatory factors termed senescence-associated secretory phenotypes (SASPs)[8, 9]. Although senescence has conventionally been perceived as a tumor-suppressive mechanism, its role in cancer is more complex[10]. Senescence exerts a dual effect in cancer as it suppresses tumor formation by halting proliferation and also promotes tumor progression via SASP-mediated angiogenesis and tissue remodeling[11-13]. This dual role highlights the need for strategies that modulate senescence to control BCa progression.
Mitophagy, the primary mechanism governing mitochondrial quality control, has been implicated in both cellular senescence and tumor progression[14-17]. Dysfunctional mitochondria are eliminated via mitophagy, which reduces reactive oxygen species (ROS) and mitochondrial DNA mutations, thereby delaying senescence and maintaining cellular homeostasis[18, 19]. Given its role in regulating cellular energy and stress responses, mitophagy is emerging as a critical process in cancer biology. The PINK1/Parkin pathway is a central regulator of mitophagy and has been extensively studied[20]. In BCa, rapamycin-induced AMPK activation has been reported to enhance mitophagy, suppressing cell proliferation and migration[21]. Similarly, MCM7 has been observed to upregulate mitophagy and reduce p53 accumulation, maintaining BCa cell stemness[22]. Nevertheless, the precise role of mitophagy in BCa progression is poorly understood and warrants further investigation. DARS2 (aspartyl-tRNA synthetase 2) is a key mitochondrial aminoacyl-tRNA synthetase whose dysfunction can impair mitochondrial protein synthesis, resulting in mitochondrial dysfunction[23]. It is reported that DARS2 plays a pivotal regulatory role in the progression and apoptosis of hepatocellular carcinoma and lung adenocarcinoma[24, 25]. However, the effects of DARS2 on BCa and mitophagy remain unknown.
Therefore, in this study, 16 mitophagy-related genes were screened to construct a prognostic model, demonstrating its strong predictive value for prognosis in patients with BCa. Furthermore, DARS2, which was significantly upregulated in BCa, was identified as a key factor. Interestingly, DARS2 upregulated PINK1-mediated mitophagy by promoting PINK1 mitochondrial expression, thus inhibiting cellular senescence and promoting cell proliferation. These findings emphasize the intrinsic association among DARS2, mitophagy, and cellular senescence in BCa.
2. Materials and methods
2.1. Data collection and acquisition
A total of 824 MRGs (Supplementary Table 1) were obtained from the GeneCards database (https://www.genecards.org/) with a relevance score of >1. Prognosis-related genes (PRGs) in BCa were identified through Kaplan-Meier survival analysis and a univariate Cox proportional hazards model, with p < 0.05 considered to indicate statistical significance in TCGA and GSE13507. The R package VennDiagram (CRAN - Package VennDiagram (r-project.org)) was used to identify the overlapping MRGs and PRGs.
Transcriptomic and clinical data for BCa patients were sourced from TCGA, GSE13507, and IMvigor210. Single-cell transcriptomic profiles were retrieved from GSE211388 and analyzed using Seurat. Quality control was performed to eliminate cells based on the following exclusion criteria: (1) fewer than 200 or more than 4,000 genes, (2) fewer than 1,000 reads, (3) UMI counts outside the range of 500-15,000, or (4) >10% of mitochondrial UMIs. The data were normalized using LogNormalize, and the top 2,000 highly variable genes were identified. Dimensionality reduction was performed using PCA, t-SNE, and UMAP. Cell clustering was conducted using FindNeighbors and FindClusters, with cell annotations obtained via SingleR (Supplementary Table 3).
2.2. Construction of a prognostic MRG model
A prognostic model was constructed by using machine learning-integrated algorithms. Ultimately, a combination of the LASSO and SuperPC algorithms was selected as the final model.
The risk score was calculated based on the following formula:

where  is the risk coefficient of each factor. The risk score for each patient was calculated as follows: Risk score = ANXA2 expression * 0.148207972739551 + CDK5RAP3 expression * (-0.0216587905197319) + CSNK2A2 expression * 0.00595383260568351 + DARS2 expression * 0.0231697095929072 + DCXR expression * 0.209058645007052 + FASN expression * 0.165701072850379 + GFPT2 expression * 0.125204197049992 + MAP1A expression * 0.109561386716842 + PRDX6 expression * 0.127684552011834 + SAR1A expression * 0.0211344182319381 + SCD expression * 0.00674879338858188 + SCO2 expression * (-0.423184153287598) + SPTBN2 expression * 0.106972468192409 + TFRC expression * 0.0712419818434375 + TRIM27 expression * (-0.239048049127721) + UBC expression * 0.1174018352924.
2.3. Sample sources
BCa samples were obtained from patients under treatment at the Department of Urology, Nanfang Hospital, Southern Medical University during March 1-31, 2023. Relevant clinical records and samples of all BCa cases were approved for use by the Ethics Committee. Before seeking their approval, all patients were provided with informed consent.
2.4. Cell culture and reagents
T24 and SW780 cells were utilized in this study. The experimental cells were maintained at 37°C in a humidified atmosphere containing 5% CO2 and cultured in DMEM basic medium (Gibco, C11995500BT) with 10-15% fetal bovine serum (164210, China). The carbonyl cyanide m-chlorophenyl hydrazone (CCCP) (MedChemExpress, HY-100941) was used to induce mitophagy.
2.5. RNA interference and lentiviral transfection
DARS2-targeting siRNA/shRNA was synthesized by GenePharma (Guangzhou, China). The overexpression plasmids for PINK1 were purchased from Miaoling Biotech (Wuhan, China). Transfection of siRNA was performed using Lipofectamine 3000 (Servicebio, USA) for 48 h, according to the manufacturer's protocol. For DARS2 silencing, lentiviral infection of T24 or SW780 cells was performed using lentivirus (Genechem, China), followed by the selection with DMEM containing 4 μg/mL puromycin (GBCBIO, J593-25mg) for 48-72 h. The siRNA/shRNA sequence for PINK1 and DARS2 is provided in the Supplementary Table 7.
2.6. Western blotting
Protein lysates were separated by SDS-PAGE and transferred onto PVDF membranes. These membranes were then incubated overnight at 4°C with primary antibodies against β-actin, DARS2, PINK1, and others. After incubation with secondary antibodies at room temperature for 1 h, protein detection was performed by using an enhanced chemiluminescence detection system. The following antibodies were used in this study: Anti-DARS2 (Proteintech, 13807-1-AP, 1:2000), Anti-p53 (Proteintech, 10442-1-AP, 1:2000), Anti-p21 (Proteintech, 10355-1-AP, 1:2000), Anti-CDK6 (Proteintech, 14052-1-AP, 1:2000), Anti-CDK4 (Proteintech, 11026-1-AP, 1:2000), Anti-LC3 (Proteintech, 14600-1-AP, 1:2000), Anti-PINK1 (Proteintech, 23274-1-AP, 1:2000), and Anti-Parkin (Proteintech, 14060-1-AP, 1:2000). β-actin (Proteintech, 20536-1-AP, 1:2000) was used as the loading control. Protein expression was quantified using ImageJ software.
2.7. Cellular senescence staining
Cellular senescence was tested by using the SA-β-gal kit (KeyGEN BioTECH, KGA5101-100) as per the manufacturer's instructions. T24 and SW780 cells were fixed at 26°C for 16 min and cultured overnight with the SA-β-gal solution in a CO2-free incubator at 37°C. Then, the cells were observed under a conventional optical microscope. Image data were analyzed quantitatively by using ImageJ software.
2.8. Cell viability assay
The viability of T24 and SW780 cells was assessed by the CCK8 assay. We seeded 3 × 10³ cells/well in a 96-well plate. After attachment, the cells received the indicated treatments before the CCK8 reagent was added. Then, the cells were cultured for approximately 2 h in humidified incubators at 37°C with 5% CO2. We then measured the optical density at 450 nm (OD450) by using an ELISA reader.
2.9. Flow cytometry
Cell cycle analysis was performed in accordance with the manufacturer's protocol by using the cell cycle detection kit (KeyGEN BioTECH, KGA9101-100). Briefly, the cells were fixed in 70% cold ethanol (500 μL) overnight and stained with PI/RNase A staining solution (500 μL). Next, the cells were incubated for 30-60 min in the dark. The ROS levels were measured by using a ROS detection kit (S0033M, Beyotime) after 30 min of incubation. The mitochondrial mass and membrane potential were evaluated by using Mitotracker-green (C1048, Beyotime) and TMRE (C2001S, Beyotime), respectively, at a concentration of 10 nM. A BD Accuri C6 flow cytometer together with FlowJo X software was used to collect and analyze the data.
2.10. Immunofluorescence
T24 and SW780 cells were incubated with 15 nM Mitotracker-green (C1048, Beyotime) and 15 nM Lysotracker-red (C1046, Beyotime) for 25 min, with the nuclei stained using Hoechst 33342 (C1025, Beyotime). Live-cell fluorescence images were captured using either a laser confocal microscope (FV3000) or a super-resolution microscope (N-SIM+N-STORM, Nikon). In addition, after transfection of the cells with mt-Keima plasmids for 3 days and nuclei stained using Hoechst 33342, live-cell figures were taken through a laser confocal microscope. Image analysis was performed using Imaris software (Oxford Instruments, UK).
2.11. Immunohistochemistry (IHC) staining
The tissue samples from BCa patients and nude mice were subjected to standard IHC procedures (fixed in formalin, embedded in paraffin, and sectioned). The slides were incubated overnight at 4°C with primary antibodies (anti-DARS2 1:200, anti-PINK1 1:200, anti-CDK4 1:200), followed by incubation with secondary antibodies (1:250) for 40 min at 25°C. These slides were developed using DAB and counterstained with hematoxylin. The images were captured by using a slide scanner (DX300, HISTECH, China).
2.12. Animal experiments
This project was approved by the Ethics Committee of Nanfang Hospital, Southern Medical University. T24 cells (1 × 10⁷ cells/mouse) transfected with sh-DARS2 or oe-PINK1 were subcutaneously injected into BALB/c nude mice (4-week-old, female). Tumor volume and mice body weight were recorded daily starting 14 days post-injection. The nude mice were euthanized on day 28. Their tumor tissues were isolated, photographed, weighed, and subjected to immunohistochemical staining and histopathological evaluation.
2.13. Statistical analysis
All statistical analyses and data visualizations were performed by using the GraphPad Prism 8 software. Statistical significance was determined by one-way ANOVA or Student's t-test, with results presented as the mean ±SEM from at least three independent experiments (*p < 0.05, **p < 0.01, ***p < 0.001, ****p < 0.0001, ns: not significant).
3. Results
3.1. The prognostic model based on mitophagy-related genes could effectively predict prognosis in BCa
To comprehensively examine the role of mitophagy in BCa, 824 mitophagy-related genes (MRGs) were collected (Supplementary Table 1). A total of 115 candidate genes were identified from the intersection of MRGs and prognosis-related genes (Fig. 1A). Based on these candidates, machine learning algorithms were assessed to construct a prognostic model by identifying 16 hub genes that were closely related to each other (Fig. 1B, Supplementary Table 2). Finally, the combination of LASSO and SuperPC algorithms was selected owing to its superior predictive performance, achieving the highest average C-index across four cohorts (TCGA: 0.637, GSE13507: 0.632, GSE32548: 0.743, GSE32894: 0.765) (Fig. 1C). Of the 16 model genes, CDK5RAP3, TRIM27, and SCO2 were determined to be favorable prognostic factors, whereas the remaining 13 genes, including DARS2, ANXA2, and PRDX6, were risk factors.
The prognostic model based on mitophagy-related genes could effectively predict prognosis in BCa. (A) Venn diagram depicting the intersection between prognosis-related genes from TCGA and GSE13507 cohorts and MRGs, yielding 115 candidate genes. (B) The co-expression network of the 16 model genes, with node size representing p-values from Cox analysis and edge thickness representing the strength of correlation. (C) Comparison of the C-index values across four cohorts using different machine-learning algorithms, with the LASSO and SuperPC combination demonstrating the highest average performance. (D) Kaplan—Meier survival curves illustrating significant survival differences between the high- and low-risk groups across TCGA, GSE13507, GSE32548, and GSE32894 cohorts.
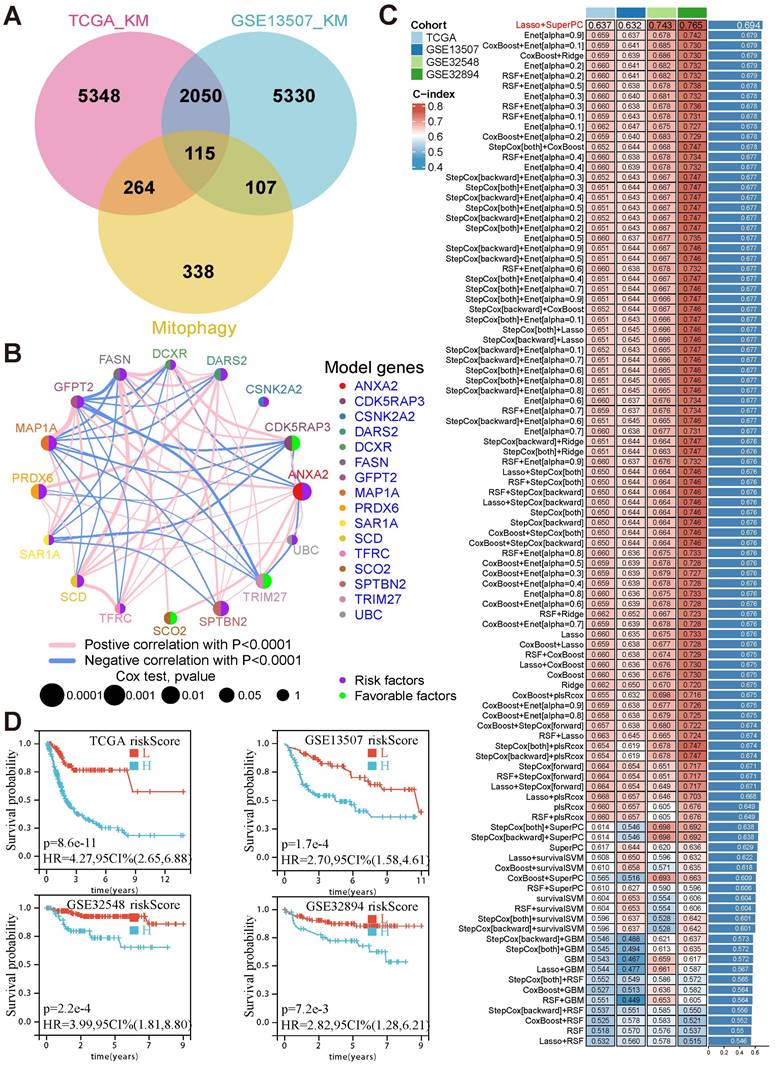
Risk scores were calculated for each patient based on the weighted expression of these 16 MRGs. Patients were stratified into high- and low-risk groups using the median risk score as the cutoff. Survival analysis revealed that patients in the high-risk group consistently exhibited poor outcomes across all cohorts (TCGA: HR = 4.27, p < 0.001; GSE13507: HR = 2.70, p < 0.001; GSE32548: HR = 3.99, p < 0.001; GSE32894: HR = 2.82, p = 0.0027) (Fig. 1D). These findings establish the critical role of these 16 MRGs in BCa prognosis and highlight their potential as prognostic biomarkers and therapeutic targets.
3.2. Cellular senescence could play a pivotal role in the progression of BCa
To determine the potential mechanisms underlying the survival differences between the high- and low-risk groups, the expression patterns of the 16 MRGs were detected at the single-cell level. The BCa single-cell dataset GSE211388 was collected, followed by dimensionality reduction clustering and annotation of cell subpopulations (Supplementary Table 3). In addition, 13 clusters were identified, along with several major cell types, such as epithelial cells, fibroblasts, T cells, and B cells (Fig. 2A, B). Subsequently, the 16 MRGs were projected onto the single-cell atlas, which showed that these genes were mainly expressed in epithelial cells (Fig. 2C). Moreover, the distribution of the risk score was similar within this cell type (Fig. 2D).
Cellular senescence could play a pivotal role in the progression of BCa. (A) The cells were clustered into Seurat_clusters, with distinct colors representing clusters and numbers indicating cluster IDs. (B) The cell types were distributed across tSNE space, with epithelial cells, fibroblasts, T-cells, and others, labeled by color. (C) The tSNE expression density maps displaying the distribution of the 16 prognostic model genes, with the density levels indicated by color. (D) Epi_riskScore distribution was visualized in the tSNE space, with colors indicating its density in epithelial cells. (E) KEGG enrichment analysis of DEGs between the high and low Epi_riskScore groups highlighted pathways such as cellular senescence, cell cycle, and p53 signaling. The X-axis indicated GeneRatio, with dot size representing gene counts and color reflected -log10(p-value). (F) Pathway activity scores between high and low Epi_riskScore groups were compared, with dot size representing the percentage of expressed genes and color indicating the expressions.
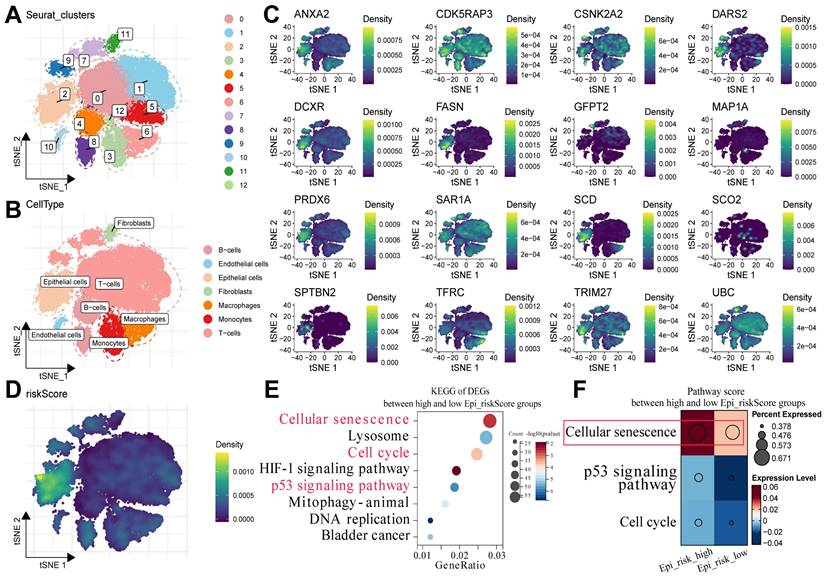
Epithelial cells were then isolated and classified into Epi_risk_high and Epi_risk_low groups based on the median risk score (Supplementary Table 4). KEGG pathway enrichment analysis revealed that differentially expressed genes between the high- and low-risk groups were considerably enriched in cellular senescence, cell cycle, and p53 signaling pathways (Fig. 2E, Supplementary Table 5). These findings suggest that the 16 MRGs drive BCa progression by influencing these pathways. The cellular senescence pathway score was significantly elevated in the Epi_risk_high group, indicating a marked activation of cellular senescence in high-risk patients (Fig. 2F). In summary, the 16 MRGs likely contribute to BCa progression primarily via the regulation of cell cycle, p53 signaling pathway, and particularly cellular senescence.
3.3. DARS2 is a key regulator of BCa progression
Univariate Cox regression analysis was performed to identify the most critical genes among the 16 MRGs. The findings revealed that 13 genes (HR > 1) were significantly associated with poor prognosis, underscoring their potential roles in tumor progression (Fig. 3A). Furthermore, pseudotime analysis proved that UBC, MAP1A, DARS2, DCXR, and GFPT2 were progressively upregulated during the transition from normal epithelial cells to non-muscle-invasive bladder cancer (NMIBC)- and muscle-invasive bladder cancer (MIBC)-associated cells (Fig. 3B-D). This gradual increase suggests their involvement in driving the malignancy of BCa.
DARS2 is identified as a key regulator in BCa progression. (A) Univariate Cox regression identified 13 MRGs (HR >1) linked to poor prognosis. (B-D) Monocle3 pseudotime analysis revealed a progressive upregulation of UBC, MAP1A, DARS2, DCXR, and GFPT2 during the transition from normal epithelial cells to NMIBC and MIBC. (E) DepMap analysis revealed that the deletion of UBC, DARS2, and DCXR significantly inhibited tumor cell proliferation, with DARS2 displaying high dependency in 315 of 1,150 cell lines. (F-G) Alphafold3 predicted stronger interaction potential between DARS2 (G) and PINK1 when compared to UBC (F). (H-I) RT-qPCR and western blotting showed elevated DARS2 mRNA and protein levels in the BCa tissues when compared to that in the adjacent normal tissues. (J) IHC confirmed a higher DARS2 expression in the BCa tissues when compared to that in the adjacent normal tissues.
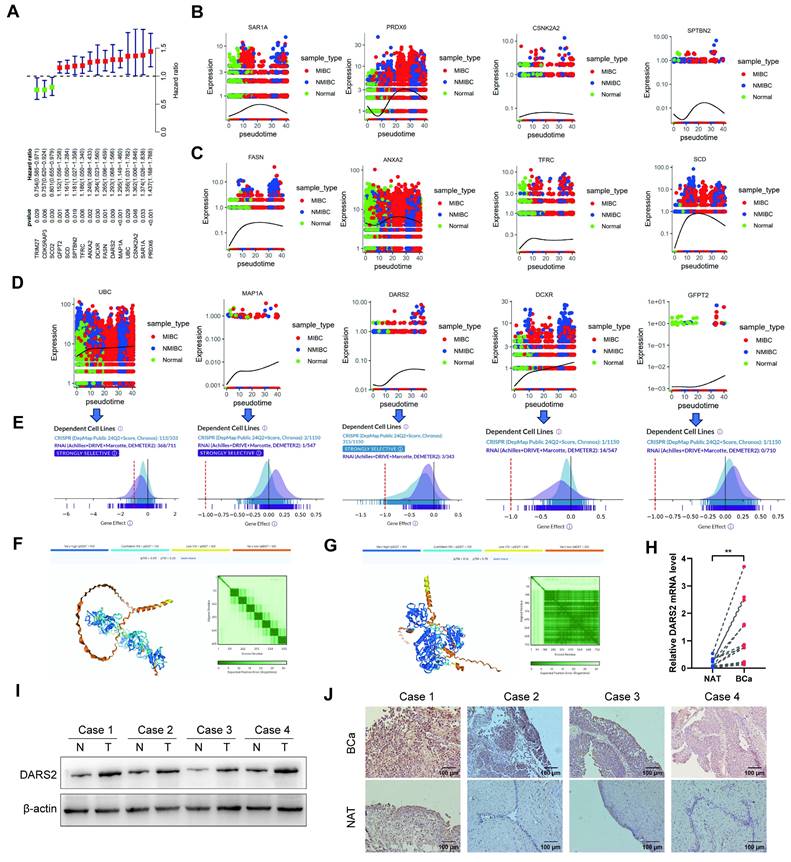
DepMap demonstrated that the deletion of UBC, DARS2, and DCXR significantly inhibited tumor cell proliferation, asserting their roles in maintaining tumor growth[26]. DARS2 exhibited dependency in 315 of 1,150 cell lines, implying its importance across several cancer contexts (Fig. 3E). Also, protein interaction predictions revealed that DARS2 exhibited a stronger interaction potential with PINK1 than UBC, signifying its direct and functional role in mitophagy regulation (Fig. 3F-G). Based on its critical involvement in poor prognosis, muscle invasion, and malignant proliferation in BCa, DARS2 was identified as a candidate gene for further analyses.
In line with these observations, DARS2 expression was significantly elevated in BCa tissues at both mRNA and protein levels, confirming its role in the disease process (Fig. 3H-I). IHC staining confirmed its markedly higher expression in BCa tissues than in adjacent normal tissues, visually validating its tumor-specific up-regulation (Fig. 3J).
Collectively, these results show that DARS2 is a key regulator of BCa progression, potentially via its involvement in mitophagy and tumor cell survival.
3.4. DARS2 inhibits cellular senescence and promotes cell proliferation
To ascertain the biological function of DARS2 in BCa, GO and KEGG enrichment analyses were performed using the TCGA-BLCA dataset (Fig. 4A). DARS2 was chiefly enriched in pathways related to cellular senescence and cell cycle regulation, which agreed with the findings of scRNA cell analysis. DARS2 expression was evaluated in five BCa cell lines, and siRNA was used to knock down DARS2 expression in T24 and SW780 cells, which exhibited the highest DARS2 expressions (Fig. 4B-E). SA-β-gal staining was considerably increased after DARS2 knockdown, which indicated that cellular senescence was induced in BCa cells (Fig. 4F).
DARS2 inhibits cellular senescence and promotes cell proliferation. (A) GO and KEGG enrichment analyses of DARS2 in the TCGA_BLCA dataset. (B-C) The analysis of DARS2 mRNA and protein expressions in different BCa cell lines. (D-E) The verification of DARS2 knockdown by siRNA. (F) SA-β-gal staining exhibiting the effect of DARS2 knockdown on cellular senescence. (G-H) CCK8 assay showing changes in the proliferation capacity of SW780 (G) and T24 (H) cells after DARS2 knockdown. (I) Cell cycle distribution in the G1, S, and G2 phases was detected by flow cytometry and visualized using FlowJo_v10.8.1 software. (J-L) The analyses of CDK4, CDK6, p53, and p21 levels following DARS2 knockdown by siRNA.
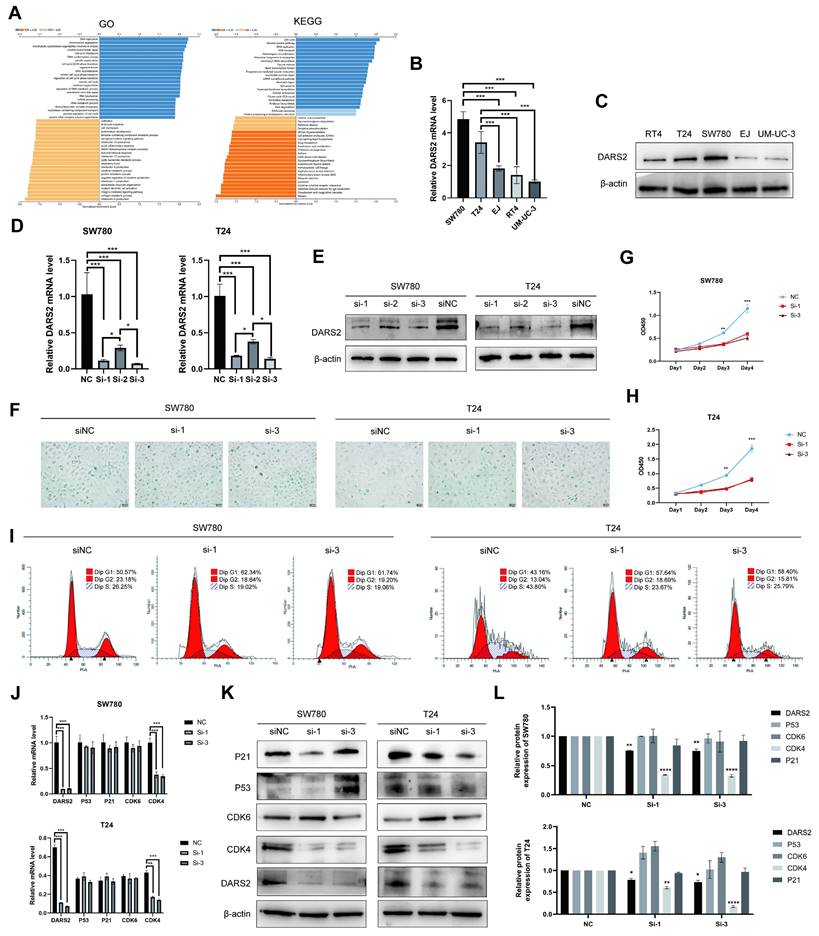
To further investigate the impact of DARS2 knockdown, its effects on cell proliferation and cell cycle progression were determined (Fig. 4G-I). BCa cell proliferation was significantly inhibited, and cells were arrested in the G1 phase, with a reduced number progressing to the S and G2 phases. In addition, DARS2 augmented the migration and invasion capabilities of BCa cells (Supplementary Fig. 1A). The ability of eukaryotic cells to transition from the G1 phase to the S and G2 phases is primarily regulated by G1 phase checkpoints and DNA damage checkpoints such as CDK4, CDK6, p53, and p21[27, 28]. CDK4 expression was reduced after DARS2 knockdown, whereas CDK6, p53, and p21 levels remained unaltered (Fig. 4J-L). These results demonstrate that DARS2 promotes G1-to-S phase transition by upregulating CDK4, thereby inhibiting cellular senescence and enhancing cell proliferation in BCa.
3.5. DARS2 promotes PINK1-mediated mitophagy in BCa cells
The role of DARS2 in mitophagy remained unclear. GSEA analysis of the GSE13507 dataset showed that it was significantly enriched in mitophagy-related pathways (Supplementary Fig. 1B). Moreover, correlation analysis established that DARS2 was interacted with multiple MRGs, especially PINK1 (Supplementary Fig. 1C). Notably, PINK1 protein expression was increased when DARS2 was upregulated, although no significant regulation was observed both PRKN expression and PINK1 mRNA levels (Supplementary Fig. 1D, E). Based on the known biological functions of DARS2, it was hypothesized to influence the mitochondrial synthesis of PINK1[23]. Stable DARS2-knockdown BCa cells were established, followed by the isolation of mitochondrial proteins (Supplementary Fig. 2A, B). As expected, DARS2 knockdown significantly reduced mitochondrial PINK1 protein levels (Supplementary Fig. 2C).
To determine the effect of DARS2 on mitophagy, LC3II/I levels were analyzed and found to be decreased after DARS2 knockdown (Fig. 5A, B). Considering the intricate association between ROS and mitophagy, ROS levels were measured before determining mitophagy[29, 30]. ROS levels were significantly elevated in DARS2-knockdown cells, implying impaired mitochondrial quality control (Fig. 5C). Mitotracker and TMRE staining showed that although the total number of mitochondria was increased, the proportion of functional mitochondria with an intact membrane potential was decreased (Fig. 5D). These observations suggest that DARS2 knockdown impairs the clearance of damaged mitochondria, causing dysfunctional mitochondria to accumulate.
DARS2 promotes mitophagy in BCa cells. (A-B) Western blotting displayed decreased LC3II/I levels after DARS2 knockdown. (C) Flow cytometry revealed increased ROS levels in DARS2-knockdown cells. (D) MitoTracker-green and TMRE staining showed increased mitochondrial numbers and reduced mitochondrial membrane potential, respectively, in DARS2-knockdown cells. (E) Super-resolution microscopy revealed reduced mitochondrial-lysosomal colocalization in DARS2-knockdown T24 cells. (F) Confocal microscopy confirmed reduced mitochondrial-lysosomal colocalization in DARS2-knockdown SW780 cells, with MitoTracker-green for the mitochondria, Lysotracker-red for lysosomes, and Hoechst for nuclei. (G) Mt-Keima fluorescence intensity revealed reduced colocalization of mitochondria (488 nm) and lysosomes (561 nm) in DARS2-knockdown SW780 cells. (H) Transmission electron microscopy revealed decreased mitophagy and increased vacuolization in DARS2-knockdown T24 cells.
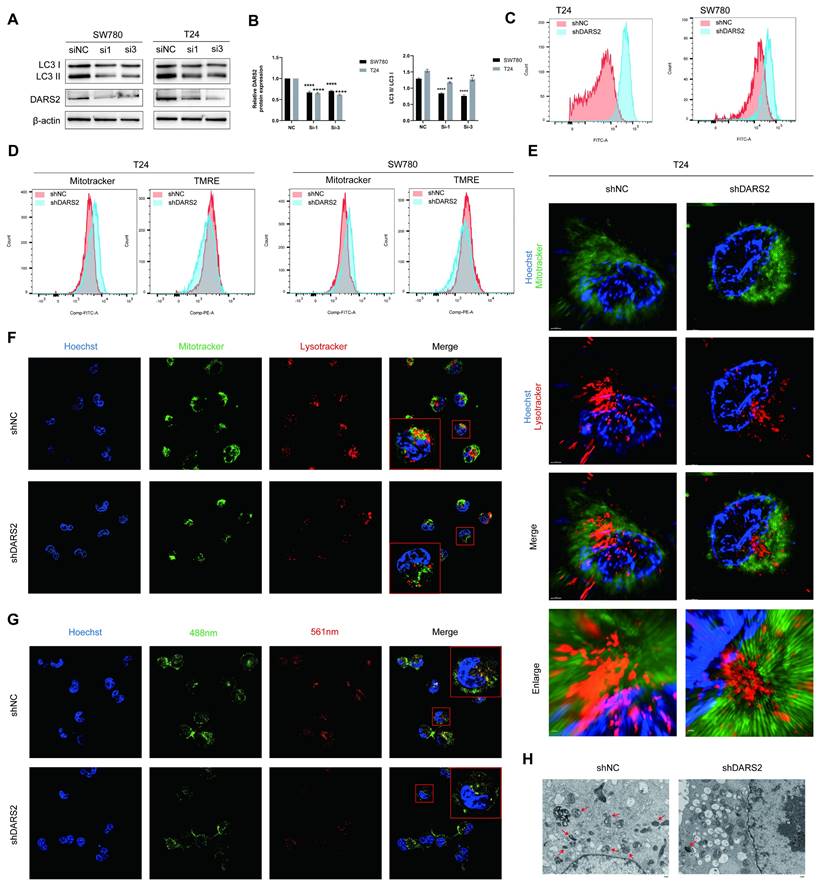
Super-resolution and confocal microscopy using Mitotracker-green and Lysotracker-red established that the colocalization of mitochondria and lysosomes was reduced in DARS2-knockdown cells, implying decreased mitophagy (Fig. 5E, F). Furthermore, mt-Keima assays showed reduced colocalization of mitochondria (neutral pH, green) and lysosomes (acidic pH, red), which agreed with impaired mitophagy (Fig. 5G). In addition, transmission electron microscopy revealed mitochondrial vacuolization and swelling, signifying decreased levels of mitophagy (Fig. 5H). These findings assert that DARS2 enhances PINK1-mediated mitophagy by regulating PINK1 mitochondrial synthesis and contributes to mitochondrial quality control in BCa cells.
3.6. DARS2 inhibits cellular senescence and promotes tumor growth by enhancing PINK1-mediated mitophagy
To further determine the association between DARS2-regulated mitophagy and cellular senescence, PINK1 was overexpressed and DARS2-knockdown BCa cells were treated with CCCP. It is a protonophore that augments the permeability of the mitochondrial inner membrane to H+, leading to a loss of membrane potential and accelerating mitochondrial depolarization and mitophagy[31]. PINK1 overexpression and CCCP treatment significantly increased autophagy levels and partially restored the decreased CDK4 expression attributed to DARS2 knockdown (Fig. 6A, B).
DARS2 inhibits cellular senescence by promoting PINK1-mediated mitophagy. (A-B) Western blotting analysis of the protein expression following stable DARS2 knockdown and transfection with overexpressed PINK1 plasmids and CCCP treatment (10 μM CCCP for 24 h). (C) Cell proliferation was evaluated by the CCK8 assay. (D) Cellular senescence was assessed by SA-β-gal staining. (E) Cell cycle distribution in the G1, S, and G2 phases was detected by flow cytometry and visualized by using FlowJo_v10.8.1 software.
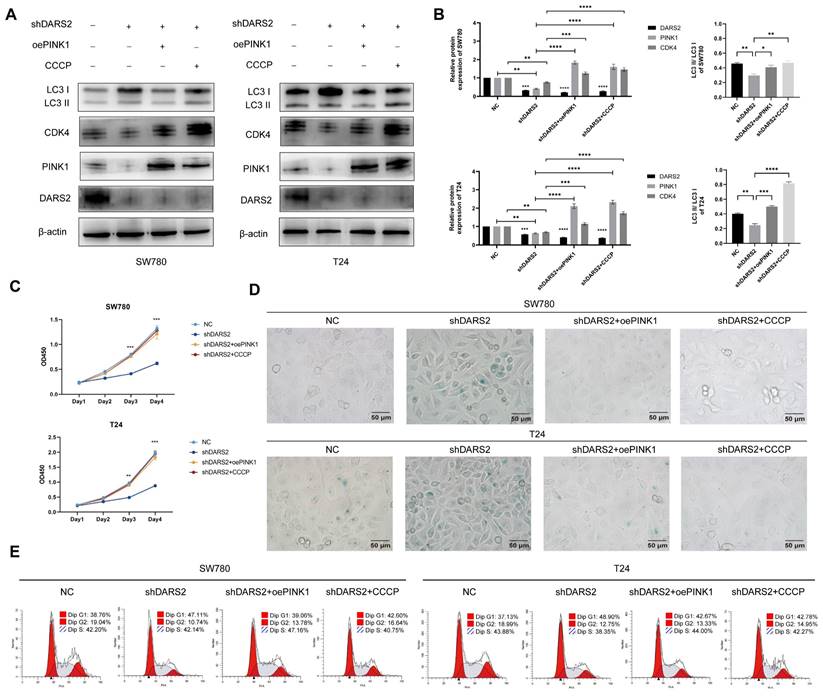
In addition, PINK1 overexpression and CCCP treatment significantly decreased SA-β-gal positivity and enhanced cell proliferation compared with the DARS2-knockdown group (Fig. 6C, D). More pertinently, this treatment alleviated the G1 phase arrest caused by DARS2 knockdown (Fig. 6E). These results signify that DARS2 promotes CDK4 expression and facilitates the G1-to-S phase transition by enhancing PINK1-mediated mitophagy, inhibiting cellular senescence and stimulating cell proliferation.
To evaluate the impacts of DARS2 on tumor growth in vivo, subcutaneous tumor xenograft experiments were conducted using nude mice (Fig. 7A-C). DARS2 knockdown significantly reduced tumor size and weight, an effect partially reversed by PINK1 overexpression (Fig. 7D, E). In addition, IHC analysis of the tumor tissues confirmed that DARS2 knockdown considerably reduced PINK1 and CDK4 expressions, which were partially restored upon PINK1 overexpression, consistent with our earlier findings (Fig. 7F). These observations assert that DARS2 knockdown exerts an antitumor effect by promoting PINK1-dependent mitophagy.
Clinical significance of the DARS2-PINK1-CDK4 axis. (A-B) Nude mice were subcutaneously injected with BCa cells and monitored for body weight (A) and tumor volume (B) from day 0 to day 21. (C) Gross images of nude mice and tumors at the endpoint. (D-E) Tumor weight (D) and volume (E) were measured after euthanasia. (F) Immunohistochemical analysis revealed the expressions of DARS2, PINK1, and CDK4 in subcutaneous tumors. (G) The DARS2-PINK1-CDK4 axis expressions were calculated across BCa cohorts to generate a Prognostic Score. (H-N) The expressions of the axis varied significantly across different tissue types, tumor grades, stages, and metastasis statuses in multiple datasets. (O) Multivariate regression analysis evaluated the prognostic value of the axis across databases. (P) Survival analysis showed the impact of the axis on overall survival in multiple datasets. (Q) Sensitivity analysis revealed the axis's response to various drug treatments.
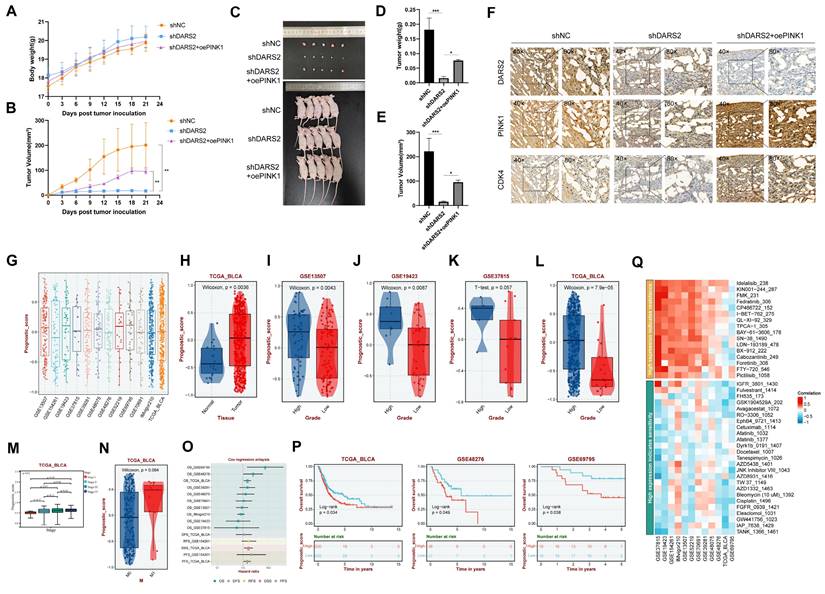
The clinical significance of the DARS2-PINK1-CDK4 axis was explored by applying the ssGSEA algorithm to determine the overall expressions of this axis across multiple BCa cohorts, generating a prognostic score (Fig. 7G). This axis was highly expressed in BCa and was significantly positively correlated with higher tumor grade, stage, and distant metastasis across multiple datasets (Fig. 7H-N). Furthermore, it was significantly linked to poor overall survival outcomes and suboptimal therapeutic responses to various drugs (Fig. 7O-Q, Supplementary Table 6). Hence, targeting the DARS2-PINK1-CDK4 axis holds promise for improving the prognosis of patients with BCa.
4. Discussion
BCa is one of the most common malignant tumors affecting the urinary system worldwide. The disease's pathological types and progression mechanisms are complex[3, 32]. Patients often face challenges such as high recurrence rates, chemotherapy resistance, and poor prognosis[3, 33, 34]. Therefore, determining the molecular mechanisms underlying BCa and identifying novel therapeutic targets is of immense clinical importance. The role of cellular senescence in cancer has recently garnered considerable research attention[35, 36]. Cellular senescence is marked by irreversible cell cycle arrest and serves as a stress response that inhibits cell proliferation, preventing the malignant spread of cancer cells[37]. Nonetheless, senescent cells secrete proinflammatory factors and matrix-degrading enzymes, collectively known as SASPs, activating the tumor microenvironment and promoting tumor progression[13, 38]. This dual nature of cellular senescence emphasizes its complex role in cancer development. Comprehending the molecular basis of this process in BCa is crucial for gaining insights into tumorigenesis and developing new treatment strategies.
Mitophagy is responsible for clearing damaged mitochondria and maintaining the health of the organelle. This process is involved in energy metabolism and the reduction of ROS accumulation within cells[18, 39]. The role of mitophagy in cancer is complex. On the one hand, it suppresses tumorigenesis by eliminating damaged mitochondria and reducing ROS levels[40]. On the other hand, excessive mitophagy may provide energy for cancer cells and promote tumor progression[40, 41]. Because of this duality, mitophagy is a controversial and challenging cancer research area.
In this study, several machine learning algorithms were used to develop a prognostic model based on MRGs, identifying 16 genes closely linked to BCa prognosis, with DARS2 emerging as a key gene. DARS2 encodes mitochondrial aspartyl-tRNA synthetase, a vital enzyme in mitochondrial protein synthesis[23]. Although previous studies have implicated DARS2 in liver and lung cancer progression, its role in BCa has not been completely elucidated[24, 25]. In vitro experiments with BCa cell lines indicated that silencing DARS2 substantially inhibited cell proliferation and promoted cellular senescence. Specifically, DARS2 knockdown downregulated CDK4, induced cell cycle arrest in the G1 phase, increased SA-β-gal staining, and reduced cell proliferation. These findings imply that DARS2 is an imperative regulatory factor in BCa cells.
Subsequently, whether DARS2 regulates cellular senescence in BCa cells via a mitophagy-dependent pathway was examined. PINK1, a crucial regulator of the mitophagy pathway, accumulates on the outer mitochondrial membrane in response to damage to this organelle and recruits Parkin for the autophagic degradation of damaged mitochondria[42]. This was the first study to demonstrate the association between DARS2 and PINK1. Our findings revealed that DARS2 knockdown significantly down-regulated the PINK1 protein expression in BCa cells, although the PINK1 mRNA levels were not significantly altered. Isolation of mitochondrial proteins established that DARS2 knockdown inhibited mitochondrial synthesis of PINK1, which explained the phenomenon above. Furthermore, immunofluorescence and confocal microscopy showed that DARS2 knockdown significantly decreased the colocalization of mitochondria and lysosomes, implying reduced mitophagy. In addition, transmission electron microscopy revealed enhanced vacuolization and mitochondrial swelling in DARS2-knockdown cells, which are typical signs of impaired mitophagy. These findings together suggested that DARS2 elevated the PINK1 protein levels by promoting its mitochondrial synthesis, thereby enhancing PINK1-mediated mitophagy.
Moreover, in BCa cells, DARS2 knockdown significantly increased the levels of ROS, a major inducer of mitophagy. Under normal conditions, mitophagy effectively eliminates damaged mitochondria and maintains stable intracellular ROS levels[30]. However, DARS2 knockdown resulted in mitochondrial damage accumulation, further accentuating the ROS levels, which could be a result of decreased mitophagy and a cause of increased cellular senescence. Overexpression of PINK1 or treatment with the autophagy inducer CCCP partially restored the reduction in mitophagy and the increase in cellular senescence caused by DARS2 knockdown. These observations confirm that DARS2 regulates BCa cellular senescence via PINK1-mediated mitophagy.
The relationship between cellular senescence and proliferation in BCa progression was further investigated. It is reported that cellular senescence is closely related to proliferation as well as cell cycle arrest[43-46]. However, the relationship between cellular senescence and proliferation in BCa has not yet been fully elucidated. In this study, DARS2 was found to inhibit cellular senescence and promote cell proliferation. However, the causal relationship between cellular senescence and proliferation still requires further confirmation.
Previous research on DARS2 has focused on its role in neurological diseases[23]. This study is the first to examine its involvement in BCa, revealing its critical role in regulating the cell cycle, inhibiting cellular senescence, and promoting cell proliferation. According to the proposed molecular mechanism, DARS2 suppresses cellular senescence and stimulates BCa progression via PINK1-mediated mitophagy, offering new insights into the roles of DARS2 and mitophagy in BCa. Moreover, this study clarified the clinical relevance of the DARS2-PINK1-CDK4 axis in BCa. Bioinformatics analysis proved that the elevated expression of this axis was considerably linked to poor prognosis in patients with BCa, suggesting that targeting this axis is a promising therapeutic approach, especially for patients who respond poorly to conventional chemotherapy or immunotherapy.
Despite elucidating the importance of DARS2 in BCa, some limitations should be addressed in our present study. Firstly, it remains unclear whether DARS2 influences mitophagy through other pathways. Furthermore, the variability of the role of DARS2 across different BCa subtypes should be considered. In addition, the potential targets of DARS2 and PINK1 for precise BCa treatment may be explored.
5. Conclusions
In this study, a prognostic model was constructed by screening 16 MRGs, which exhibited a strong predictive value for the prognosis of patients with BCa. Of these genes, DARS2 was a key regulator and was found to be upregulated in BCa tissues. Silencing of DARS2 markedly induced cellular senescence and inhibited the proliferation of BCa cells via PINK1-mediated mitophagy. Mechanistically, the mitophagy inhibition caused by DARS2 silencing led to a decrease in CDK4 levels. This reduction resulted in cell cycle arrest in the G1 phase and limited the transition of cells into the S and G2 phases. In conclusion, DARS2 demonstrates significant predictive effects on BCa progression and may serve as a promising therapeutic target in the future.
Abbreviations
BCa: Bladder cancer; NMIBC: Nonmuscle invasive bladder cancer; MIBC: Muscle invasive bladder cancer; OXPHOS: Oxidative phosphorylation; ROS: Reactive oxygen species; DARS2: Aspartyl-tRNA synthetase 2; SASPs: Senescence-associated secretory phenotypes; MRGs: Mitophagy-related genes; GSEA: Gene set enrichment analysis; DEGs: Differentially expressed genes; GO: Gene Ontology; KEGG: Kyoto Encyclopedia of Genes and Genomes; TMRE: Tetramethylrhodamine ethyl ester; CCCP: Carbonyl cyanide m-chlorophenyl hydrazone.
Supplementary Material
Supplementary figures.
Supplementary tables.
Acknowledgements
We thank the Department of Urology, Nanfang Hospital, Southern Medical University and the Pathology Laboratory, School of Basic Medicine, Southern Medical University for their support of this work.
Funding
This study was supported by the Natural Science Foundation of Guangdong Province of China (2023A1515010236) (F.L.), the Hangzhou Oriental Clinical Oncology Research Center (ECCO-KY-24003) (F.L.), the National Natural Science Foundation of China (82073162) (WL.T.) (82372867) (WL.T.), the Ganjiang Scholars Program of Ganzhou People's Hospital (2021-121) (XL.D.).
Data availability statement
The datasets and experimental materials in this study are available from the corresponding author upon reasonable request.
Declaration of generative AI and AI-assisted technologies in the writing process
During the preparation of this work, the authors used ChatGPT 4.0 in order to improve language and readability. After using this tool, the authors reviewed and edited the content as needed and take full responsibility for the content of the publication.
Author contributions
Dongqing Li: Writing - original draft, Writing - review & editing, Validation, Methodology, Data curation, Formal analysis, Conceptualization, Project administration. Hang Su: Writing - original draft, Writing - review & editing, Resources, Methodology, Investigation, Formal analysis, Data curation. Xiaolin Deng: Writing - review & editing, Validation, Methodology. Yuan Huang: Software, Investigation, Visualization, Methodology. Zihuan Wang: Validation, Software, Data Curation. Jinge Zhang: Software, Methodology, Investigation. Chen Chen: Investigation, Methodology. Zaosong Zheng: Validation, Methodology. Qiong Wang: Methodology, Investigation. Shanchao Zhao: Visualization, Supervision. Zhe-Sheng Chen: Supervision, Validation. Haiyong Chen: Methodology, Supervision. Lina Hou: Visualization, Software, Formal analysis, Resources. Wanlong Tan: Supervision, Resources. Fei Li: Resources, Project administration, Methodology, Investigation, Formal analysis, Data curation, Conceptualization.
Competing Interests
The authors have declared that no competing interest exists.
References
1. Siegel RL, Giaquinto AN, Jemal A. Cancer statistics, 2024. CA Cancer J Clin. 2024;74:12-49
2. Li F, Zheng Z, Chen W, Li D, Zhang H, Zhu Y. et al. Regulation of cisplatin resistance in bladder cancer by epigenetic mechanisms. Drug Resist Updat. 2023;68:100938
3. Lopez-Beltran A, Cookson MS, Guercio BJ, Cheng L. Advances in diagnosis and treatment of bladder cancer. BMJ. 2024;384:e076743
4. Li F, Xie W, Fang Y, Xie K, Liu W, Hou L. et al. Hnrnp-f promotes the proliferation of bladder cancer cells mediated by pi3k/akt/foxo1. J Cancer. 2021;12:281-291
5. Xie B, Lin J, Chen X, Zhou X, Zhang Y, Fan M. et al. Circxrn2 suppresses tumor progression driven by histone lactylation through activating the hippo pathway in human bladder cancer. Mol Cancer. 2023;22:151
6. Munoz-Espin D, Serrano M. Cellular senescence: from physiology to pathology. Nat Rev Mol Cell Biol. 2014;15:482-96
7. Hanahan D. Hallmarks of cancer: new dimensions. Cancer Discov. 2022;12:31-46
8. Hernandez-Segura A, Nehme J, Demaria M. Hallmarks of cellular senescence. Trends Cell Biol. 2018;28:436-453
9. Gordon RR, Nelson PS. Cellular senescence and cancer chemotherapy resistance. Drug Resist Updat. 2012;15:123-31
10. Ma L, Yu J, Fu Y, He X, Ge S, Jia R. et al. The dual role of cellular senescence in human tumor progression and therapy. MedComm (2020). 2024;5:e695
11. Gu Y, Xu T, Fang Y, Shao J, Hu T, Wu X. et al. Cbx4 counteracts cellular senescence to desensitize gastric cancer cells to chemotherapy by inducing yap1 sumoylation. Drug Resist Updat. 2024;77:101136
12. Calcinotto A, Kohli J, Zagato E, Pellegrini L, Demaria M, Alimonti A. Cellular senescence: aging, cancer, and injury. Physiol Rev. 2019;99:1047-1078
13. Campisi J. Aging, cellular senescence, and cancer. Annu Rev Physiol. 2013;75:685-705
14. Liu F, Yuan Y, Bai L, Yuan L, Li L, Liu J. et al. Lrrc17 controls bmsc senescence via mitophagy and inhibits the therapeutic effect of bmscs on ovariectomy-induced bone loss. Redox Biol. 2021;43:101963
15. Sun B, Ding P, Song Y, Zhou J, Chen X, Peng C. et al. Fdx1 downregulation activates mitophagy and the pi3k/akt signaling pathway to promote hepatocellular carcinoma progression by inducing ros production. Redox Biol. 2024;75:103302
16. Yin K, Lee J, Liu Z, Kim H, Martin DR, Wu D. et al. Mitophagy protein pink1 suppresses colon tumor growth by metabolic reprogramming via p53 activation and reducing acetyl-coa production. Cell Death Differ. 2021;28:2421-2435
17. Yao H, Cai C, Huang W, Zhong C, Zhao T, Di J. et al. Enhancing mitophagy by ligustilide through bnip3-lc3 interaction attenuates oxidative stress-induced neuronal apoptosis in spinal cord injury. Int J Biol Sci. 2024;20:4382-4406
18. Lu Y, Li Z, Zhang S, Zhang T, Liu Y, Zhang L. Cellular mitophagy: mechanism, roles in diseases and small molecule pharmacological regulation. Theranostics. 2023;13:736-766
19. Wang Y, Liu HH, Cao YT, Zhang LL, Huang F, Yi C. The role of mitochondrial dynamics and mitophagy in carcinogenesis, metastasis and therapy. Front Cell Dev Biol. 2020;8:413
20. Han R, Liu Y, Li S, Li XJ, Yang W. Pink1-prkn mediated mitophagy: differences between in vitro and in vivo models. Autophagy. 2023;19:1396-1405
21. Whang YM, Kim MJ, Cho MJ, Yoon H, Choi YW, Kim TH. et al. Rapamycin enhances growth inhibition on urothelial carcinoma cells through lkb1 deficiency-mediated mitochondrial dysregulation. J Cell Physiol. 2019;234:13083-13096
22. Mo L, Su B, Xu L, Hu Z, Li H, Du H. et al. Mcm7 supports the stemness of bladder cancer stem-like cells by enhancing autophagic flux. iScience. 2022;25:105029
23. Li JL, Lee NC, Chen PS, Lee GH, Wu RM. Leukoencephalopathy with brainstem and spinal cord involvement and lactate elevation: a novel dars2 mutation and intra-familial heterogeneity. Mov Disord Clin Pract. 2021;8:1116-1122
24. Qin X, Li C, Guo T, Chen J, Wang HT, Wang YT. et al. Upregulation of dars2 by hbv promotes hepatocarcinogenesis through the mir-30e-5p/mapk/nfat5 pathway. J Exp Clin Cancer Res. 2017;36:148
25. Jiang Y, You J, Wu C, Kang Y, Chen F, Chen L. et al. High expression of dars2 indicates poor prognosis in lung adenocarcinoma. J Clin Lab Anal. 2022;36:e24691
26. Ghandi M, Huang FW, Jane-Valbuena J, Kryukov GV, Lo CC, Mcdonald ER. et al. Next-generation characterization of the cancer cell line encyclopedia. Nature. 2019;569:503-508
27. Besson A, Dowdy SF, Roberts JM. Cdk inhibitors: cell cycle regulators and beyond. Dev Cell. 2008;14:159-69
28. Malumbres M, Barbacid M. Cell cycle, cdks and cancer: a changing paradigm. Nat Rev Cancer. 2009;9:153-66
29. Zhu S, Wu H, Cui H, Guo H, Ouyang Y, Ren Z. et al. Induction of mitophagy via ros-dependent pathway protects copper-induced hypothalamic nerve cell injury. Food Chem Toxicol. 2023;181:114097
30. Su L, Zhang J, Gomez H, Kellum JA, Peng Z. Mitochondria ros and mitophagy in acute kidney injury. Autophagy. 2023;19:401-414
31. Georgakopoulos ND, Wells G, Campanella M. The pharmacological regulation of cellular mitophagy. Nat Chem Biol. 2017;13:136-146
32. Wang Y, Xie K, Chen W, Fang Y, Mo Q, Zhang H. et al. Synergistic ferroptosis-starvation therapy for bladder cancer based on hyaluronic acid modified metal-organic frameworks. Bioeng Transl Med. 2023;8:e10515
33. Guo J, Ma X, Liu D, Wang F, Xia J, Zhang B. et al. A distinct subset of urothelial cells with enhanced emt features promotes chemotherapy resistance and cancer recurrence by increasing col4a1-itgb1 mediated angiogenesis. Drug Resist Updat. 2024;76:101116
34. Li F, Zhang H, Huang Y, Li D, Zheng Z, Xie K. et al. Single-cell transcriptome analysis reveals the association between histone lactylation and cisplatin resistance in bladder cancer. Drug Resist Updat. 2024;73:101059
35. Li F, Liu P, Mi W, Li L, Anderson NM, Lesner NP. et al. Blocking methionine catabolism induces senescence and confers vulnerability to gsk3 inhibition in liver cancer. Nat Cancer. 2024;5:131-146
36. Colucci M, Zumerle S, Bressan S, Gianfanti F, Troiani M, Valdata A. et al. Retinoic acid receptor activation reprograms senescence response and enhances anti-tumor activity of natural killer cells. Cancer Cell. 2024;42:646-661.e9
37. Zhou L, Zhong Y, Wang F, Guo Y, Mao R, Xie H. et al. Wtap mediated n6-methyladenosine rna modification of elf3 drives cellular senescence by upregulating irf8. Int J Biol Sci. 2024;20:1763-1777
38. Takasugi M, Yoshida Y, Ohtani N. Cellular senescence and the tumour microenvironment. Mol Oncol. 2022;16:3333-3351
39. Ferro F, Servais S, Besson P, Roger S, Dumas JF, Brisson L. Autophagy and mitophagy in cancer metabolic remodelling. Semin Cell Dev Biol. 2020;98:129-138
40. Song C, Pan S, Zhang J, Li N, Geng Q. Mitophagy: a novel perspective for insighting into cancer and cancer treatment. Cell Prolif. 2022;55:e13327
41. Panigrahi DP, Praharaj PP, Bhol CS, Mahapatra KK, Patra S, Behera BP. et al. The emerging, multifaceted role of mitophagy in cancer and cancer therapeutics. Semin Cancer Biol. 2020;66:45-58
42. Chang X, Zhou H, Hu J, Ge T, He K, Chen Y. et al. Targeting mitochondria by lipid-selenium conjugate drug results in malate/fumarate exhaustion and induces mitophagy-mediated necroptosis suppression. Int J Biol Sci. 2024;20:5793-5811
43. Wang Y, Zhou T, Chen H, Wen S, Dao P, Chen M. Rad54l promotes bladder cancer progression by regulating cell cycle and cell senescence. Med Oncol. 2022;39:185
44. Wang Y, Zhu H, Xu H, Qiu Y, Zhu Y, Wang X. Senescence-related gene c-myc affects bladder cancer cell senescence by interacting with hsp90b1 to regulate cisplatin sensitivity. Aging (Albany NY). 2023;15:7408-7423
45. Wang B, Kohli J, Demaria M. Senescent cells in cancer therapy: friends or foes? Trends Cancer. 2020;6:838-857
46. Pace A, Scirocchi F, Napoletano C, Zizzari IG, Po A, Megiorni F. et al. Targeting fgfrs by pemigatinib induces g1 phase cell cycle arrest, cellular stress and upregulation of tumor suppressor micrornas. J Transl Med. 2023;21:626
Author contact
![]() Corresponding authors: Dr. Lina Hou, Department of Huiqiao Medical Center, Nanfang Hospital, Southern Medical University, Guangzhou, Guangdong 510515, P.R. China; Email: lnhou2010com. Dr. Wanlong Tan, Department of Urology, Nanfang Hospital, Southern Medical University, Guangzhou, Guangdong 510515, P.R. China; Email: tanwanlongcom. Dr. Fei Li, Department of Urology, Nanfang Hospital, Southern Medical University, Guangzhou, Guangdong 510515, P.R. China; Email: feili20700338com.
Corresponding authors: Dr. Lina Hou, Department of Huiqiao Medical Center, Nanfang Hospital, Southern Medical University, Guangzhou, Guangdong 510515, P.R. China; Email: lnhou2010com. Dr. Wanlong Tan, Department of Urology, Nanfang Hospital, Southern Medical University, Guangzhou, Guangdong 510515, P.R. China; Email: tanwanlongcom. Dr. Fei Li, Department of Urology, Nanfang Hospital, Southern Medical University, Guangzhou, Guangdong 510515, P.R. China; Email: feili20700338com.