Impact Factor ISSN: 1449-2288
- Issue 12; 2026
- Issue 11; 2026
- Issue 10; 2026
- Issue 9; 2026
- Issue 8; 2026
- Volume 22; 2026
- Past Issues
- Advance Articles
- Editorial Board
- Cover Images
- Index & Coverage
- Cover Suggestion
- Special Issues
Introduction
Materials and Methods
Results
Discussion
Conclusions
Supplementary Material
Acknowledgements
References

 Global reach, higher impact
Int J Biol Sci 2025; 21(5):1894-1913. doi:10.7150/ijbs.101585 This issue Cite
Research Paper
Targeting ALG3/FOXD1/BNIP3 Axis Prevents Mitophagy and Gemcitabine Resistance of Nasopharyngeal Carcinoma
Zhanwang Wang1*, Yi Jin2*, Dong He3, Yuxing Zhu1, Mengqing Xiao1, Xiaoming Liu4, Yaxin Cheng1, Ke Cao1 ![]()
1. Department of Oncology, Third Xiangya Hospital of Central South University, Changsha, 410013, China.
2. Department of Radiation Oncology, Hunan Cancer Hospital, The Affiliated Cancer Hospital of Xiangya School of Medicine, Central South University, Changsha, China.
3. Central South University, Changsha, 410013, China
4. Department of Gastroenterology, Third Xiangya Hospital of Central South University, Changsha, 410013, China.
* These authors contributed equally.
Received 2024-7-25; Accepted 2025-1-31; Published 2025-2-10
Abstract

Understanding the specific role and underlying mechanisms of mitophagy may provide therapeutic benefit to patients with nasopharyngeal carcinoma (NPC). Forkhead box D1 (FOXD1), is overexpressed in NPC. However, its roles in NPC progression and therapy resistance remain largely unknown. NPC tissues displayed increased FOXD1 expression compared to paired non-tumor tissues, which correlated with worse overall survival (OS). Upregulation of FOXD1 promoted NPC cell proliferation, colony formation, migration, invasion, and impaired sensitivity to GEM by enhancing mitophagy levels. Mechanistically, FOXD1 promoted mitophagy in NPC cells by transcriptionally initiating BNIP3 expression. This enhanced mitophagy, in turn, promoted proliferation, invasion, and migration and reduced NPC cell sensitivity to gemcitabine (GEM). Most interestingly, Asn176 N-glycosylation of the FOXD1 protein increased its stability and nuclear localization, thereby transcriptionally activating BNIP3 expression to promote mitophagy of NPC cells. ALG3 directly interacted with FOXD1 and induced this N-glycosylation. Targeting the ALG3/FOXD1/BNIP3 axis offers a promising therapeutic strategy to inhibit the progression of NPC, which highlighting the potential of therapeutics targeting ALG3 and FOXD1 for regulating mitophagy and overcoming GEM resistance.
Keywords: Nasopharyngeal Carcinoma, Mitophagy, FOXD1, ALG3, Gemcitabine
Introduction
Nasopharyngeal carcinoma (NPC) is a malignant tumor originating from nasopharyngeal epithelium, with a particularly high incidence rate in Southern China and Southeast Asia [1]. The incidence rate in epidemic areas of southern China is reported to be 25-30 per 100,000 population [2]. In recent years, the 5-year survival rate of NPC patients has improved to 80%, primarily due to the widespread implementation of intensity-modulated radiotherapy and gemcitabine with platinum (GP regimen) chemotherapy in advanced stages [3, 4]. However, the lack of effective predictive markers to identify patients who would benefit from these treatments remains a challenge. While significant progress has been made, the molecular mechanisms of gemcitabine resistance in NPC are still poorly understood. Therefore, identifying effective biomarkers and targets for NPC diagnosis and treatment is crucial.
Forkhead box D1 (FOXD1) is a pivotal member of the evolutionarily conserved forkhead family of winged-helix transcription factors (TFs) [5]. Innumerable studies have reported that FOXD1 performs critical roles in common physiological functions as well as multiple disease progression, such as recurrent pregnancy loss [6], osteoarthritis [7], kidney development [8], and malignant biological progression of several cancers [9-11]. However, the expression and biological effect of FOXD1 in NPC remain largely unknown.
Mitophagy, a specific form of selective autophagy, aims to eliminate damaged mitochondria, preventing the accumulation of damaging mitochondrial DNA (mtDNA) mutations and maintaining cellular quality [12]. Dysregulation of mitophagy is implicated in the pathogenesis of numerous human diseases. The most studied and understood regulatory pathway of mitophagy is the PRKN/parkin-PINK1 axis, which is responsible for initiating the clearance of defective mitochondria [13]. Furthermore, mitophagy can also be initiated by multiple mitochondrial outer membrane receptors, such as FUNDC1, BCL2L13, BNIP3, and BNIP3L/NIX, which bind to phagophore membranes and facilitate the recruitment of mitochondria for degradation [14].
Glycosylation, a widespread post-translational modification (PTM), is a finely tuned enzymatic reaction process that primarily occurs in the endoplasmic reticulum (ER) and Golgi apparatus [15]. It has been established that enzymes can add sugar chains (N-glycosylation and O-glycosylation) to proteins and lipids [16]. This process can stabilize proteins, ensure their proper positioning within the cell, and facilitate proper protein folding by molecular chaperones [16]. Recent evidence suggests that aberrant protein glycosylation plays a crucial role in sustained proliferation signaling, cell death evasion, and chemoresistance in various tumors, including NPC [17, 18]. Both mitophagy and glycosylation are essential physiological metabolic processes that could be exploited for developing novel cancer therapies. However, the interplay between these two processes remains largely unexplored. The core structure of N-linked glycans (N-glycans) consists of two N-acetylglucosamine (GlcNAc) residues, three glucose residues, and nine mannose residues (Glc3Man9GlcNAc2) [19]. These GlcNAc residues are linked to asparagine, with additional saccharides attached depending on whether the glycosylation is of the high-mannose, hybrid, or complex type. This process, mediated by various glycosyltransferases known as “asparagine-linked glycosylation” (ALG) enzymes, occurs on dolichol-pyrophosphate carriers [20]. Prior to proper folding, proteins carrying the Glc1Man9GlcNAc2 structure are recognized by ER chaperones, calnexin, and calreticulin. Subsequently, aspartate-linked glycosylation 3 (ALG3; α-1,3-mannosyltransferase) catalyzes the first mannosylation step on the lipid-linked Man5GlcNAc2 precursor [21].
Herein, we identified FOXD1 and ALG3 to be upregulated in NPC and correlated with poor prognosis. In vitro and in vivo assays using loss-of-function and gain-of-function approaches confirmed that FOXD1 could promote NPC growth and metastasis. The oncogenic role of FOXD1 was attributed to its transcriptional regulation of BNIP3 expression, which further activated BNIP3-mediated mitophagy in NPC cells. Notably, this study demonstrated that ALG3-mediated N-glycosylation of FOXD1 could enhance its nuclear localization, thereby promoting BNIP3-mediated mitophagy and reducing the sensitivity of NPC cells to gemcitabine. Targeting ALG3 in NPC with high FOXD1 expression prevented mitophagy and enhanced the anti-tumor activity of gemcitabine. Overall, this finding provides a novel strategy to improve the clinical therapeutic efficacy of gemcitabine in NPC patients.
Materials and Methods
Clinical specimens
This study was approved by the Institutional Review Board of Third Xiangya Hospital of Central South University (2022-S264). Before the study began, written informed consent for participation in the study was obtained from the patients. All paraffin-embedded biopsy tissues were obtained from NPC patients with detailed clinical characteristics. Long-term follow-up data were collected from January 2014 to December 2018.
Immunohistochemistry (IHC)
After fixing, embedding, sliding, and deparaffinizing, the tissue sections were blocked with 5% BSA and 3% H2O2. The sections were then incubated with antibodies against FOXD1 (Biorbyt, orb32533), BNIP3 (Abcam, ab109362), ALG3 (Proteintech, 20290-1-AP), Ki67 (Genetex, GTX16667), and Caspase 3 (Proteintech, 19677-1-AP) at 4 °C overnight.
Cell culture
Normal nasopharyngeal epithelial cell line NP69 and human NPC cell lines (C666-1, CNE-1, 5-8F, HONE1, and HK-1) were purchased from the Center for Advanced Research of Central South University (Changsha, China). NPC cell lines were cultured continuously in RPMI-1640 (Sigma-Aldrich, USA) supplemented with 10% fetal bovine serum (FBS, Gibco, USA). The NP69 cell line was cultured with keratinocyte serum-free medium (KSFM, Invitrogen, USA) containing bovine pituitary extract (BD Biosciences, USA). All cells were incubated in a humidified atmosphere (37 °C) with 5% CO2.
qRT-PCR and RNA sequencing
Total RNA was extracted using a RNeasy Mini kit (Invitrogen, USA), and complementary DNA (cDNA) was synthesized using a PrimeScript™ RT reagent Kit (Takara, Dalian, China). Quantitative real-time PCR (qPCR) was performed with SYBR Green (Takara, Beijing, China) using primers targeting genes. RNA array sequencing was carried out on an Illumina-HiSeq machine using paired-end sequencing with the support of Lc-Bio Technologies (Hangzhou, China). The sequences of primers are shown in Supplementary Table S1.
Western blotting analysis and immunoprecipitation
Cells were washed with PBS and lysed in Radioimmunoprecipitation assay (RIPA) buffer containing a phosphatase and protease inhibitor cocktail (Roche, Basel, Switzerland). Western blotting (WB) was performed following established protocols [16]. The following primary antibodies were used in this study at the indicated dilutions: anti-FOXD1 (1:500, Biorbyt, orb32533), anti-BNIP3 (1:1000, Abcam, ab109362), anti-ALG3 (1:400, 20290-1-AP), anti-LC3B (1:2000, Abclonal, A7198), anti-P62 (1:1000, Abclonal, A7758), anti-PINK1 (1:500, Abclonal, A11435), anti-VDAC1 (1:500, Abclonal, A19707), anti-MFN1 (1:2000, Ptgcn, 66776-1-Ig), anti-Parkin (1:1000, Ptgcn, 14060-1-AP), anti-p-Parkin (Ser65) (1:1000, CST, #36866), anti-COXIV (1:2000, Ptgcn, 66110-1-Ig), and anti-β-actin (1:2000, Ptgcn, 66009-1-Ig). Immunoprecipitation was performed using protein G-agarose (Millipore, CA, USA), followed by the development of blots with ECL WB reagents.
Plasmid construction, cell interference, and transfection
Lentivirus vectors encoding FOXD1-shRNA, ALG3-shRNA, BNIP3-shRNA, or control were obtained from Tsingke Biotech Company (Beijing, China). Additionally, plasmids (ALG3-ove, BNIP3-ove, FOXD1-ove, Flag-FOXD1-WT, Flag-FOXD1-N176Q, Flag-FOXD1-N211Q, Flag-FOXD1-N457Q) were designed and purchased from Gene-Chem Company (Shanghai, China). The transfection efficiency, knockdown efficacy of shRNAs, and overexpression efficiency of plasmids were all assessed using qPCR and WB assays.
Chromatin immunoprecipitation
A chromatin immunoprecipitation (ChIP) assay was performed using a Pierce Magnetic ChIP Kit (Thermo Fisher, USA) following the manufacturer's instructions. Briefly, the assay immunoprecipitated protein-DNA complexes using an anti-FOXD1 antibody. Purified DNA was then analyzed using both agarose gel electrophoresis and a qPCR assay.
Cell apoptosis and Transwell invasion assay
To assess NPC cell apoptosis, we employed fluorescence-activated cell sorting (FACS) with an Annexin V-FITC/PI staining kit (Mbchem). Cell invasion was evaluated using a transwell invasion assay. Briefly, 600 μL of medium containing 20% FBS was added to the lower chambers of the transwell insert. Subsequently, 200 μL of serum-free medium containing 5 × 10⁴ NPC cells was plated in the upper chambers pre-coated with Matrigel (BD Biosciences). Following a 24-hour incubation, cells that penetrated the Matrigel and migrated through the upper chamber were fixed, stained with crystal violet, and visualized using an inverted microscope.
Cell proliferation and colony formation assays
To assess cell proliferation, 1000 cells were seeded per well in a 96-well plate and incubated according to the manufacturer's instructions. Cell viability was then measured using a CCK-8 assay kit (Biosharp, Hefei, China). Colony formation was evaluated by plating 500 cells per well in a 6-well plate and culturing them for two weeks. Colonies were subsequently fixed with paraformaldehyde, stained with crystal violet, and analyzed.
Dual-luciferase reporter assay
Cells were transiently co-transfected with plasmids containing the reporter of interest and a firefly luciferase reporter construct. Following 48 hours of transfection, luciferase activity was measured using the Steady-Glo® Luciferase Assay System (Promega) to assess both reporter and firefly luciferase expression. Firefly luciferase activity was then normalized to Renilla luciferase activity (often included in the co-transfection system) to control for variations in transfection efficiency, providing a more accurate reflection of reporter gene expression.
Immunofluorescence staining
Cells were seeded onto polyethyleneimine-coated coverslips. After washing with PBS, they were fixed in paraformaldehyde for 20 minutes, permeabilized with 0.3% Triton X-100 for 15 minutes, and blocked with 3% BSA solution for 1 hour at room temperature. Subsequently, cells were incubated with primary antibodies overnight at 4°C. Following three washes with PBS, they were incubated individually with primary antibodies in 3% BSA for 1.5 hours at 37 °C. Secondary antibodies were then added and incubated for 1 hour in the dark. Finally, nuclei were counter stained with DAPI in PBS for 10 minutes at room temperature. After three washes with PBS (5 minutes each), images were captured.
Detection of mitochondrial membrane potential
To assess the mitochondrial membrane potential (MMP) of NPC cells, a JC-1 staining kit (Beyotime, Beijing, China) was employed. Briefly, NPC cells were harvested and washed three times with PBS. The cells were then incubated with JC-1 dye (5 μg/ml) at 37°C for 20 minutes. Following three additional PBS washes, the MMP of the cells was evaluated using a BD Accuri C6 Plus flow cytometer. The resulting data was analyzed using FlowJo software.
Mitophagy staining assay
The level of mitophagy in cells was assessed using a Mitophagy Detection Kit (Dojindo, Japan) following the manufacturer's instructions. This kit includes two key components: Mtphagy Dye, which specifically labels damaged mitochondria, and lyso dye, which stains lysosomes. By combining these dyes, the kit allows for accurate quantification of mitophagy by identifying mitochondria that have been engulfed and degraded by lysosomes.
Animal experiments
Five-week-old male BALB/c nude mice were randomly assigned to different groups. Each mouse received a subcutaneous injection of 200 µL (1 × 10⁶ cells) of HONE1 cells into the right axillary fossa to establish xenograft tumors. Tumor volume was monitored every 3 days by measuring the longest diameter (length, L) and shortest diameter (width, W) of the tumors. All mice were sacrificed after 25 days, and tumor volume (V) was calculated using the formula V = (L × W2)/2.
Statistical analyses
Statistical analyses were performed using GraphPad Prism (version 9.0; GraphPad Inc., CA, USA). To ensure data robustness, three independent experiments were conducted. A two-tailed unpaired Student's t-test was employed to compare the statistical significance between the two groups, while a one-way analysis of variance (ANOVA) was used to assess the significance for multiple comparisons. A p-value less than 0.05 was considered statistically significant.
Results
FOXD1 was upregulated and associated with poor prognosis in NPC
Several studies have demonstrated the critical roles of FOX family genes in tumor development and progression across various cancers [22]. We initially analyzed gene expression data from the GEO database (GSE12452, GSE34573, and GSE102349). This analysis revealed that three FOX genes (FOXD1, FOXK1, and FOXM1) were associated with overall survival in NPC patients (dataset GSE102349) and showed differential expression between NPC tumors and normal tissues (Supplementary Fig. 1A). Notably, FOXD1 has been largely understudied in the context of NPC. Our analysis of the GEO datasets (GSE12452 and GSE34573) indicated that FOXD1 expression was significantly higher in NPC tissues compared to non-tumor tissues (Fig. 1A), a finding consistent with observations in other tumor types (Supplementary Fig. 1B). We further validated these findings using qPCR on NPC specimens, demonstrating that FOXD1 mRNA levels were indeed elevated in tumor (T) tissues compared with non-tumor (N) tissues (Fig. 1A). IHC analysis corroborated these results, revealing a marked increase in FOXD1 protein levels within tumor tissues compared to non-tumor samples (Fig. 1B). Finally, survival analysis using GEPIA and the NPC dataset GES102349 demonstrated that higher FOXD1 expression significantly correlated with poorer overall survival (OS) (Fig. 1C). Collectively, these findings suggest a potential role for FOXD1 in promoting NPC progression.
FOXD1 expression is upregulated in NPC tissues and enhances the proliferation, migration, and invasion of NPC cells. A Expression level of FOXD1 mRNA multiple GEO databases (GSE12452 and GSE34573) and that in NPC tumor and normal tissues was detected by qRT-PCR (n=10). B Immunohistochemical staining of FOXD1 in NPC tumor and normal tissues. C Overall survival and disease-free survival curves of FOXD1 in patients with head and neck tumors by analyzing the GEPIA database, and NPC patients with high FOXD1 expression have poorer OS in NPC GEO dataset (GSE102349). D The mRNA or protein expression levels of FOXD1 in NPC cells and normal nasopharyngeal epithelial cells were detected by qRT-PCR or WB assays. E The knockout and overexpression efficiency of FOXD1 was detected by qRT-PCR and WB assays. Colony formation assay, CCK8 assay, wounding healing assay and Transwell assay were used to measure the colony forming ability (F), cell growth (G), migration (H), and invasion ability (I) after knockdown and overexpression of FOXD1. The data are presented as the mean ± SEM from three independent experiments. *p < 0.05, **p < 0.01, ***p < 0.001.
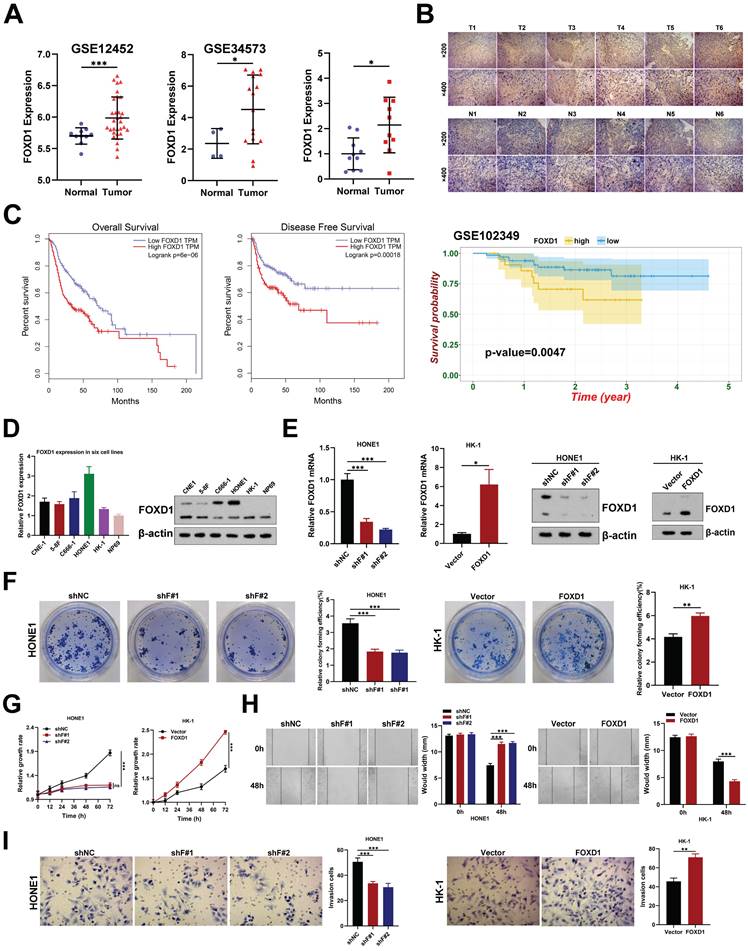
FOXD1 enhances the proliferation, migration, and invasion of NPC cells
To investigate the effects of FOXD1 on the malignant behavior of NPC cells, we first assessed its expression levels. As expected, FOXD1 expression was demonstrably higher in NPC cell lines compared to the normal nasopharyngeal epithelial cell line NP69 (Fig. 1D). We then manipulated FOXD1 expression using knockdown and overexpression approaches in HONE1 and HK-1 cells, respectively (Fig. 1E). Silencing FOXD1 in HONE1 cells resulted in a significant decrease in their growth and colony formation ability (Fig. 1F, 1G). Conversely, FOXD1 overexpression in HK-1 cells substantially promoted these same cellular processes (Fig. 1F, 1G). Furthermore, FOXD1 knockdown led to diminished migration and invasion potential of HONE1 cells, while overexpression in HK-1 cells yielded contrasting effects (Fig. 1H, 1I). These findings provide compelling evidence that FOXD1 plays a crucial role in NPC cell proliferation, migration, and invasion in vitro.
Ectopic expression of FOXD1 induces mitophagy in NPC cells
RNA sequencing was employed to identify downstream signaling pathways and target genes potentially responsible for the anti-tumorigenic effects observed upon FOXD1 knockdown in NPC cells. The analysis revealed that FOXD1 knockdown resulted in the downregulation of 509 genes and the upregulation of 609 genes (|Log2FC|>2, p < 0.05). Notably, these differentially expressed genes were significantly enriched in biological processes associated with the regulation of mitophagy and autophagy (Supplementary Fig. 1A). To investigate whether FOXD1 regulates mitophagy in NPC cells, we employed a JC-1 staining assay. This assay indicated that MMP decreased in HONE1 cells following FOXD1 knockdown, while overexpression of FOXD1 increased MMP (Fig. 2A).
Ectopic expression of FOXD1 induces mitophagy in NPC cells. A The results of JC-1 assay showed that FOXD1 could increase the membrane potential (MMP) level of HONE1 and HK-1 cells. B Fluorescence co-localization experiments showed that TOM20 and LC3B co-localization decreased after FOXD1 knockdown in HONE1 cells, while TOM20 and LC3B co-localization increased after FOXD1 overexpression in HK-1 cells. C The results of Mtphagy Dye and Lyso Dye showed that mitochondrial and lysosome co-localization decreased after FOXD1 deletion in HONE1 cells, while mitochondrial and lysosome co-localization increased after FOXD1 overexpression in HK-1 cells. D FOXD1 increased the expression of autophagy marker LC3B protein and decreased the expression of p62, VDAC1 and MFN1 protein level. E The effects of overexpression of FOXD1 and CCCP on mitochondrial membrane potential of HK-1 cells were detected by JC-1 assay. Scale bars: 10μm.
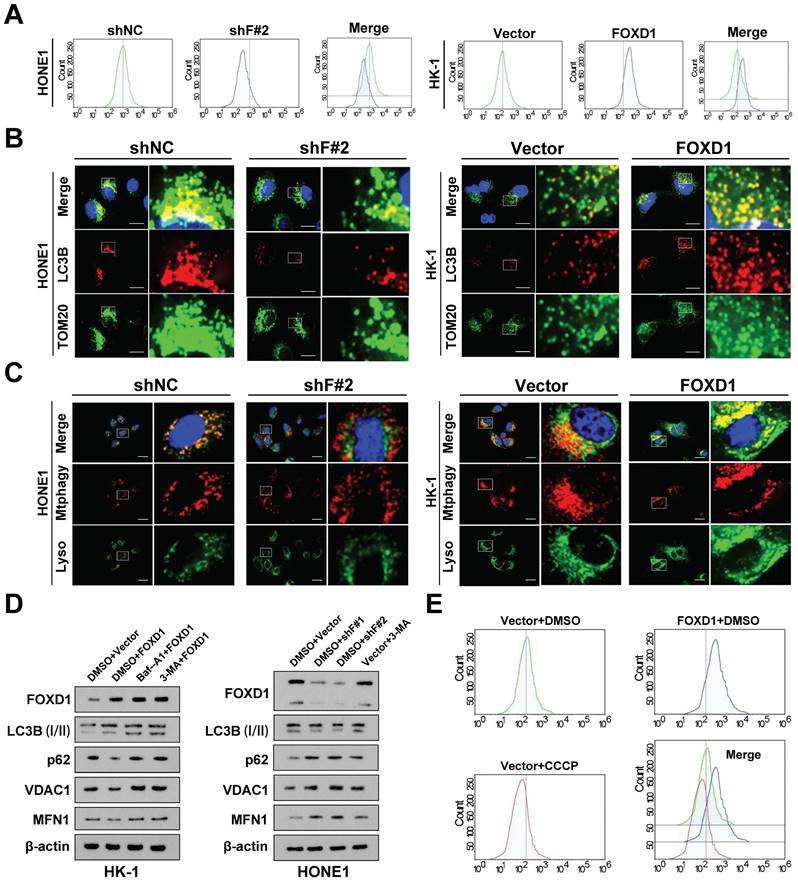
Furthermore, compared to control cells, cells with FOXD1 overexpression displayed a more diffuse LC3B punctae pattern, suggesting increased autophagosome formation. Additionally, these cells exhibited enhanced co-localization of LC3B with the mitochondrial outer membrane protein TOM20 (Fig. 2B), a marker of autophagic sequestration of mitochondria. Finally, co-localization analysis using mitophagy and lysosomal dyes revealed a more pronounced co-localization signal in cells with elevated FOXD1 expression (Fig. 2C). These findings collectively suggest that ectopic FOXD1 expression enhances mitophagy in NPC cells.
Overexpression of FOXD1 in HK-1 cells increased the expression of the autophagy marker LC3B (I) and decreased the protein levels of p62, VDAC1, and MFN1. Notably, treatment with the lysosomal inhibitor Bafilomycin A1 (Baf-A1) further increased LC3B expression (Fig. 2D). Conversely, inhibiting autophagy using lysosome inhibitors or 3-methyladenine (3-MA) partially reversed this effect. Furthermore, FOXD1 knockdown (shF#1 and shF#2) in HONE1 cells decreased LC3B expression and increased protein levels of p62, VDAC1, and MFN (Fig. 2D). Collectively, these findings suggest that FOXD1 could promote mitophagy in NPC cells.
FOXD1 facilitates the progression and mitophagy of NPC by transcriptionally upregulating BNIP3 in vitro and in vivo
To further elucidate the mechanism by which FOXD1 induces mitophagy, we employed a JC-1 staining assay. As expected, treatment with the mitochondrial uncoupler carbonyl cyanide 3-chlorophenylhydrazone (CCCP) significantly decreased the MMP of HONE1 cells, while FOXD1 overexpression increased the MMP level of HK-1 cells (Fig. 2E). Interestingly, co-localization of LC3B and TOM20 was enhanced by both FOXD1 overexpression and CCCP treatment. However, the co-localization fluorescence intensity was stronger in the CCCP treatment group compared to the FOXD1 overexpression group (Supplementary Fig. 3A). In addition, overexpression of FOXD1 or CCCP treatment could promote the fusion of mitochondria and lysosomes in HK-1 cells by using Mtphagy Dye and Lyso Dye stain, indicating that FOXD1 overexpression or CCCP treatment could increase the mitophagy level of HK-1 cells (supplementary Fig. 3B). To verify whether FOXD1 induces mitophagy in NPC cells through the classic PINK1/Parkin pathway or receptor-mediated pathway. Real-time PCR results revealed that FOXD1 over-expression did not increase the mRNA expression levels of PINK1 and Parkin (Supplementary Fig. 3C). Western blot analysis of whole-cell lysate (WCL), cytoplasmic (CYTO), and mitochondrial (MYTO) protein fractions from NPC cells corroborated these findings. Protein expression levels of PINK1, Parkin, and phosphorylated Parkin (p-Parkin) were all upregulated to varying degrees in CCCP-treated cells across all fractions (WCL, CYTO, MYTO). In contrast, FOXD1 overexpression had no effect on the protein expression levels of these same markers (Supplementary Fig. 3D). These results collectively suggest that the canonical PINK1/Parkin pathway is not involved in FOXD1-mediated mitophagy in NPC cells.
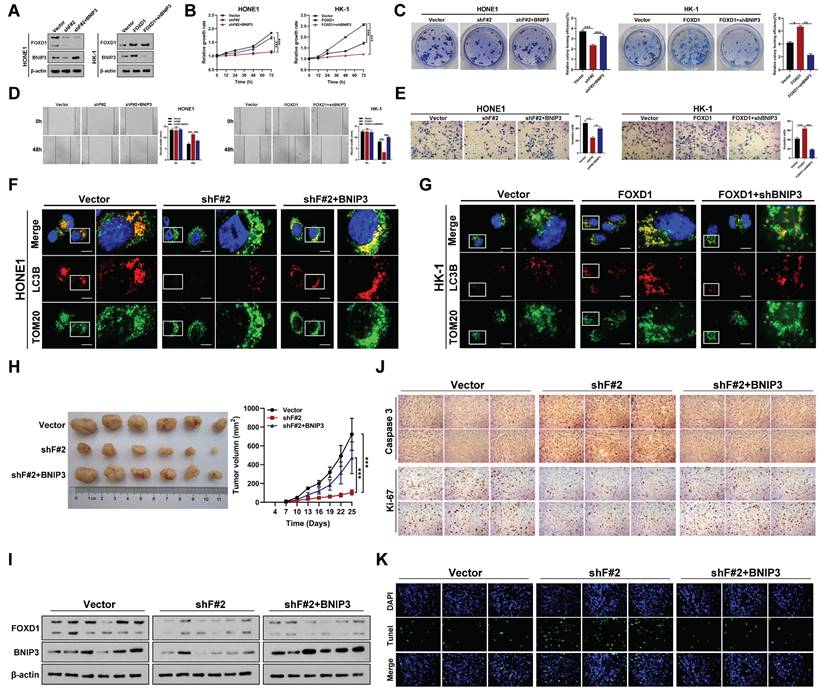
To further elucidate the mechanism by which FOXD1 increases mitophagy levels in NPC cells, we examined the RNA sequencing results. We observed that BNIP3, a mitophagy-related receptor, was significantly downregulated following FOXD1 knockdown (Supplementary Fig. 2B). This finding suggested that FOXD1 might influence mitophagy levels by regulating BNIP3 expression. We, therefore, selected BNIP3 for further functional assays. Silencing FOXD1 significantly reduced both the mRNA and protein levels of BNIP3, while FOXD1 overexpression led to their upregulation (Fig. 3A). Furthermore, a ChIP assay demonstrated that FOXD1 could directly bind to the promoter region of BNIP3 (Supplementary Fig. 4A-4C). Analysis of the JASPAR database revealed three potential FOXD1 binding sites within the BNIP3 promoter region (-2439~-2432bp, -2111~-2104bp, and -653~-646bp). To identify the specific binding sites, we constructed wild-type plasmids (BNIP3-WT), -2439~-2432bp mutant plasmids (BNIP3-MT-2432), -2111~-2104bp mutant plasmids (BNIP3-MT-2104), and -653~-646bp mutant plasmids (BNIP3-MT-646) were constructed. Dual-luciferase reporter assays revealed that compared to the wild-type group, the relative fluorescence intensity was significantly reduced in the BNIP3-MT-2104 and BNIP3-MT-646 groups (Supplementary Fig. 4D). These results suggest that the -2111~-2104bp and -653~-646bp regions within the BNIP3 promoter likely represent binding targets for FOXD1. We further analyzed the GEO datasets (GSE12452 and GSE40290) and found a significant positive correlation between FOXD1 and BNIP3 mRNA expression levels (Supplementary Fig. 5). Additionally, these datasets revealed high BNIP3 expression in NPC tissues (GSE12452, GSE40290, and GSE53819) (Supplementary Fig. 6). To investigate the functional role of BNIP3 in NPC cells, we constructed BNIP3 knockdown (shBNIP3) and overexpression (BNIP3) plasmids. qPCR and Western blot assays confirmed the successful manipulation of BNIP3 expression (Supplementary Fig. 7A, 7B). Subsequent experiments demonstrated that BNIP3 could promote proliferation, colony formation, migration, and invasion of NPC cells (Supplementary Fig. 7C-7F). Moreover, we explored whether FOXD1 promotes the progression and mitophagy of NPC cells through up-regulating BNIP3. The expression of BNIP3 significantly increased following FOXD1 overexpression, while the expression of BNIP3 was markedly down-regulated with BNIP3 knockdown (Fig. 3A). FOXD1 overexpression significantly increased BNIP3 expression (Fig. 3A), while BNIP3 knockdown markedly reduced it. In vitro experiments demonstrated that FOXD1 overexpression enhanced growth, cloning, migration, and invasion of NPC cells, and FOXD1 knockdown suppressed these abilities. Notably, BNIP3 silencing or overexpression could rescue the effects of FOXD1 manipulation (Fig. 3B-3E). To investigate whether FOXD1 regulates mitophagy via BNIP3, a dual fluorescence localization assay revealed that FOXD1 knockdown significantly reduced co-localization of TOM20 and LC3B (Fig. 3F), whereas FOXD1 overexpression increased their co-localization (Fig. 3G). Importantly, simultaneous BNIP3 overexpression could offset the decrease in co-localization caused by FOXD1 knockdown (Fig. 3F), and simultaneous BNIP3 knockdown could offset the increase in co-localization caused by FOXD1 overexpression (Fig. 3G). The co-localization of mitophagy and lysosome markers in HONE1 cells was significantly reduced by FOXD1 depletion, indicating a decrease in the cells' mitophagy level. Conversely, BNIP3 overexpression counteracted the downregulation of mitophagy caused by FOXD1 silencing (supplementary Fig. S8). Similarly, FOXD1 overexpression in HK-1 cells increased the level of mitophagy, but this increase was counteracted by simultaneous knockdown of BNIP3 (supplementary Fig. S8). These results further support the notion that FOXD1 promotes mitophagy in NPC cells through upregulation of BNIP3. To confirm these findings, we examined the efficacy of FOXD1 knockdown (shF#2) alone or in combination (shF#2 + BNIP3) on NPC growth in immunodeficient mice bearing orthotopic HONE1 xenograft tumors, compared to a blank control. FOXD1 silencing markedly inhibited the proliferation ability (Fig. 3H) and decreased the expression of both FOXD1 and BNIP3 (Fig. 3I). However, combining FOXD1 knockdown with BNIP3 overexpression could rescue these effects (Fig. 3H, 3I). Furthermore, FOXD1 depletion inhibited tumor growth, decreased Ki67 expression, increased Caspase 3 expression (Fig. 3J), and promoted cell apoptosis (Fig. 3K). Importantly, combining FOXD1 knockdown with BNIP3 overexpression reversed these effects (Fig. 3J, 3K). Collectively, these results demonstrate that FOXD1 facilitates NPC progression and mitophagy by transcriptionally upregulating BNIP3, both in vitro and in vivo.
FOXD1 promotes the progression and mitophagy of NPC through upregulating BNIP3 in vitro and in vivo. A The expression levels of FOXD1 and BNIP3 in control group (Vector), FOXD1 knockdown group (shF#2), and FOXD1 knockdown with BNIP3 simultaneous overexpression group (shF#2+BNIP3) were detected by WB. CCK8 assay, colony formation assay, wounding healing assay, and Transwell assay were used to measure the cell growth (B), colony forming (C), migration (D), and invasion (E) ability after FOXD1 knockdown with or without BNIP3 simultaneous overexpression in HONE1 and HK-1 cells. Localization of LC3B and TOM20 in HONE1 cells after transfection with Vector, shF#2 and shF#2+BNIP3 by fluorescence co-localization assay in HONE1 (F) and HK-1 (G) cells. H Representative tumor images and size of HONE1 tumors formed in the subcutaneous implantation mice was monitored every three days between different groups. I WB of FOXD1, BNIP3 and β-actin in the different group tumors. J IHC of Caspase-3 and Ki-67 in the different group tumors. K Representative TUNEL staining in subcutaneous tumor tissues of mice was shown. *p < 0.05, **p < 0.01, ***p < 0.001. Scale bars: 10μm.
Inhibition of FOXD1‑BNIP3-dependent mitophagy sensitizes NPC cells to Gemcitabine treatment
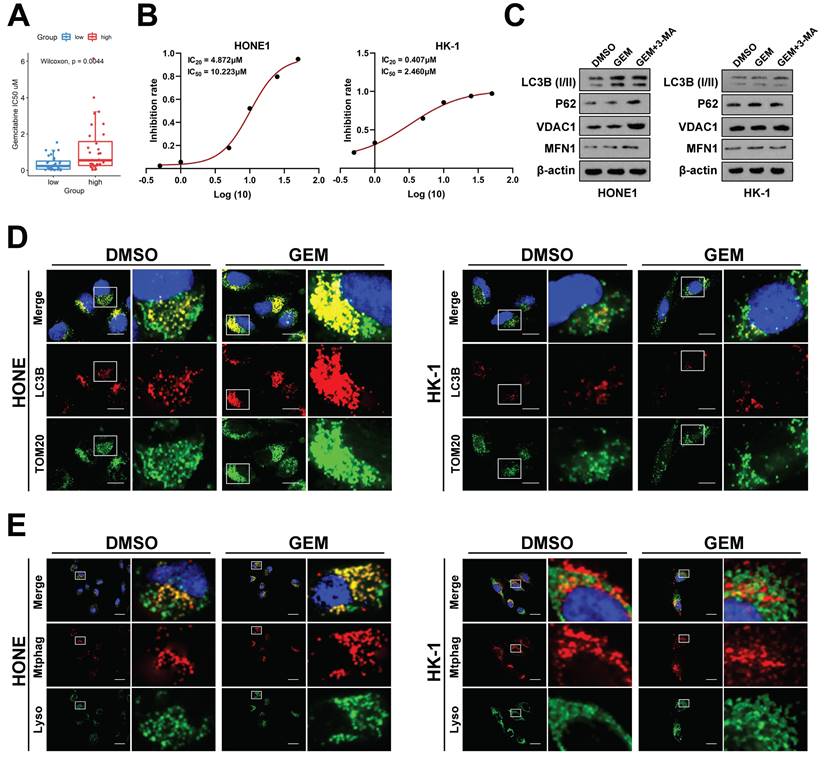
To further investigate the impact of FOXD1 on NPC drug sensitivity, we employed the GEO dataset GSE102349. Patients were stratified into two groups based on FOXD1 expression levels: FOXD1-high (37 cases) and FOXD1-low (37 cases). Drug sensitivity prediction analysis was performed using GDSC2 to predict the IC50 values of the FOXD1 high-expression group (high) and FOXD1 low-expression group (low), respectively, which showed that the drug sensitivity of GEM, the first-line chemotherapy drug for NPC treatment, was most negatively correlated with the expression of FOXD1 (Fig. 4A). Based on this finding, we further explored the role of FOXD1 in regulating gemcitabine sensitivity and the underlying molecular mechanisms. A Cell Counting Kit-8 (CCK8) assay was performed to assess the IC20 and IC50 values of gemcitabine in HONE1 and HK-1 cells. The IC20 value for HONE1 cells was 4.872 μM, with an IC50 value of 10.223 μM. In contrast, HK-1 cells displayed a lower IC20 value of 0.407 μM and an IC50 value of 2.460 μM (Fig. 4B). HONE1 and HK-1 cells were then treated with their respective IC20 concentrations of gemcitabine. To assess mitophagy levels, we employed a double fluorescence localization assay for LC3B and TOM20, as well as a Mtphagy and Lyso Dye assay. These assays confirmed that gemcitabine treatment significantly increased the mitophagy level in HONE1 cells (high FOXD1 expression) but had no effect on the mitophagy level in HK-1 cells (low FOXD1 expression) (Fig. 4D, 4E). To further explore the role of FOXD1 in gemcitabine-induced mitophagy, HONE1 and HK-1 cells were treated with DMSO (control), GEM, or gemcitabine combined with 3-methyladenine (3-MA), an autophagy inhibitor. Western blot analysis confirmed that gemcitabine treatment in HONE1 cells increased the level of mitophagy, and this effect was inhibited by co-treatment with 3-MA (Fig. 4C). However, gemcitabine treatment had no effect on mitophagy in HK-1 cells (Fig. 4C). Collectively, these findings suggest that gemcitabine can induce mitophagy in NPC cells with high FOXD1 expression.
Gemcitabine could enhance mitophagy level of NPC cells. A GDSC2 analysis showed that gemcitabine drug sensitivity is negatively correlated with FOXD1 expression. B Inhibition curve of gemcitabine on HONE1 and HK-1 cells. C The protein expression levels of mitophagy marker in HONE1 and HK-1 cells treated with DMSO, GEM and GEM+3-MA were detected by WB. The mitophagy level of HONE1 cell treated with DMSO and gemcitabine (GEM) were detected by TOM20 and LC3B dual fluorescence localization assay (D) and Mtphagy Dye and Lyso Dye assay (E). Scale bars: 10μm.
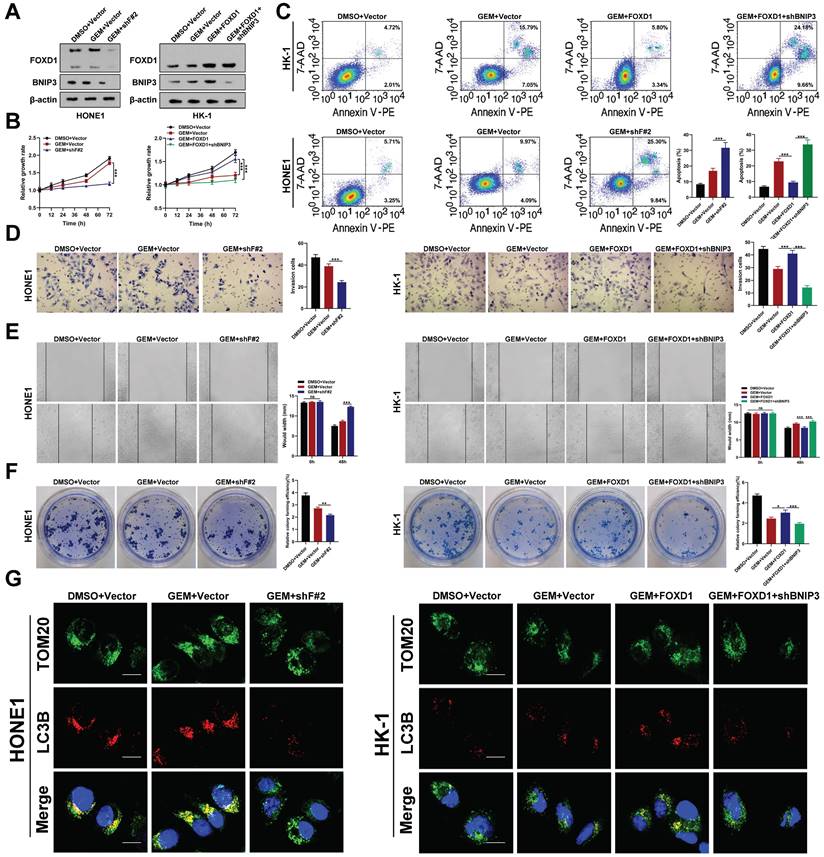
Western blot analysis revealed that gemcitabine treatment did not significantly alter the protein levels of FOXD1 or BNIP3. However, FOXD1 overexpression itself increased BNIP3 protein levels (Fig. 5A). In vitro experiments demonstrated that FOXD1 knockdown enhanced the inhibitory effect of gemcitabine on HONE1 cell growth (Fig. 5B), invasion (Fig. 5D), migration (Fig. 5E), and colony formation (Fig. 5F). Conversely, FOXD1 overexpression in HK-1 cells mitigated the inhibitory effects of gemcitabine, and this effect could be partially rescued by BNIP3 silencing. Flow cytometry analysis corroborated these findings, indicating that FOXD1 reduced the sensitivity of NPC cells to gemcitabine (Fig. 5C). To investigate the role of mitophagy in this process, we performed a dual fluorescence localization assay for TOM20 and LC3B. This assay revealed that FOXD1 knockdown diminished the enhancing effect of gemcitabine on mitophagy in HONE1 cells. In HK-1 cells, gemcitabine treatment alone did not significantly alter the mitophagy level compared to the control group. However, FOXD1 overexpression could induce mitophagy, and this effect was abrogated by BNIP3 knockout (Fig. 5G). Mtphagy Dye and Lyso Dye staining yielded similar results, demonstrating that FOXD1 silencing reduced the enhancing effect of gemcitabine on mitophagy levels in HONE1 cells. Likewise, in HK-1 cells, gemcitabine treatment alone had no significant effect on mitophagy, while FOXD1 overexpression could induce mitophagy, and BNIP3 depletion could inhibit this effect (Supplementary Fig. 9). Taken together, these findings suggest that FOXD1 promotes mitophagy by upregulating BNIP3, thereby reducing the sensitivity of NPC cells to gemcitabine treatment.
Inhibition of FOXD1-BNIP3-dependent mitophagy sensitizes NPC cells to Gemcitabine treatment. A The protein expression levels of FOXD1 and BNIP3 in HONE1 cells after treatment with DMSO+Vector, GEM+Vector and GEM+shF#2 and in HK-1 cells after treatment with DMSO+Vector, GEM+Vector, GEM+FOXD1 and GEM+FOXD1+shBNIP3 by WB assay. CCK8 assay, flow cytometry, Transwell assay, wounding healing assay, and colony formation assay were used to measure the cell growth (B), apoptosis (C), invasion (D), migration (E) and colony forming (F) ability after treatment with different conditions in HONE1 and HK-1 cells. G TOM20 and LC3B co-localization level in HONE1 and HK-1 cells treatment with different conditions were accessed by Fluorescence co-localization experiments. *p < 0.05, **p < 0.01, ***p < 0.001. Scale bars: 10μm.
Asn176 N-glycosylation of FOXD1 promotes FOXD1 nuclear translocation
Western blot analysis detected two distinct FOXD1 protein bands in human NPC cell lines (Fig. 1D) and tissues (Fig. 6B) with approximate molecular weights of 46 kDa and 60 kDa, respectively. Due to there is a molecular weight double band with such a large difference (46kDa and 60kDa), which made us generally consider glycosylation. Therefore, we hypothesized that the 60 kDa form in NPC cells might represent glycosylated FOXD1, while the 46 kDa form might be non-glycosylated. To further investigate the potential N-glycosylation sites of FOXD1 in NPC cells, we consulted online prediction websites such as Glycomine and NetNGlyc. This analysis identified three potential N-glycosylation modification sites within the FOXD1 protein sequence (Asn176, Asn211, and Asn457). To verify the presence of N-glycosylation on FOXD1 protein, HONE1, and C666-1 cells were treated with tunicamycin (TM), a known N-glycosylation inhibitor, at a concentration of 100 ng/mL for 48 hours. Western blot analysis confirmed that TM treatment resulted in a downward shift of approximately 15 kDa in the molecular weight of the FOXD1 protein band (Fig. 6A). Furthermore, HONE1 and C666-1 cells were treated with either recombinant peptide-N-glycosidase F (PNGase F) or endonuclease H (Endo H). Compared to the control group, treatment with either PNGase F or Endo H resulted in a near-complete shift of FOXD1 from the 60 kDa band to a band at approximately 46 kDa in both HONE1 and C666-1 cells (Fig. 6A). Similarly, Western blot analysis of lysates from clinical NPC tissues revealed a downward shift in the FOXD1 protein bands following treatment with either Endo H or PNGase F (Fig. 6B). Taken together, these findings suggest that FOXD1 can undergo N-glycosylation. The 60 kDa form detected represents the glycosylated form of FOXD1, while the ~46 kDa form likely represents the non-glycosylated form.
Asn176 N-glycosylation of FOXD1 promotes its nuclear translocation. A FOXD1 protein expression was detected by WB with or without TM, Endo H or PNGase F treatment of HONE1 and C666-1 cells. B The expression of FOXD1 protein in 3 NPC tissues was detected by WB with or without Endo H or PNGase F treatment of HONE1 and C666-1 cells. C Immunofluorescence distribution of FOXD1 in HONE1 and C666-1 cells treated with or without TM. D The binding of FOXD1 and BNIP3 promoter region in HONE1 and C666-1 cell treated with or without TM treatment was detected by agarose electrophoresis followed CHIP. E WB was used to detect the expression of Flag protein in HONE1 and C666-1 cells transfected with FLAG-FOXD1-WT, FLAG-FOXD1-N176Q, FLAG-FOXD1-N211Q and FLAG-FOXD1-N457Q plasmid. F WB detected the bands of Flag protein in HONE1 and C666-1 cells were transfected with different plasmids and treated with or without TM. CCK8 assay, wounding healing assay, Transwell assay and colony formation assay were used to measure the cell growth (G), migration (H), invasion (I), and colony forming (J) ability after treatment with different conditions in HONE1 and HK-1 cells. (K) Fluorescence of TOM20 and LC3B in HONE1 cell was detected through TOM20 and LC3B fluorescence colocalization experiments after cell was transfected with different plasmids. Scale bars: 10μm.
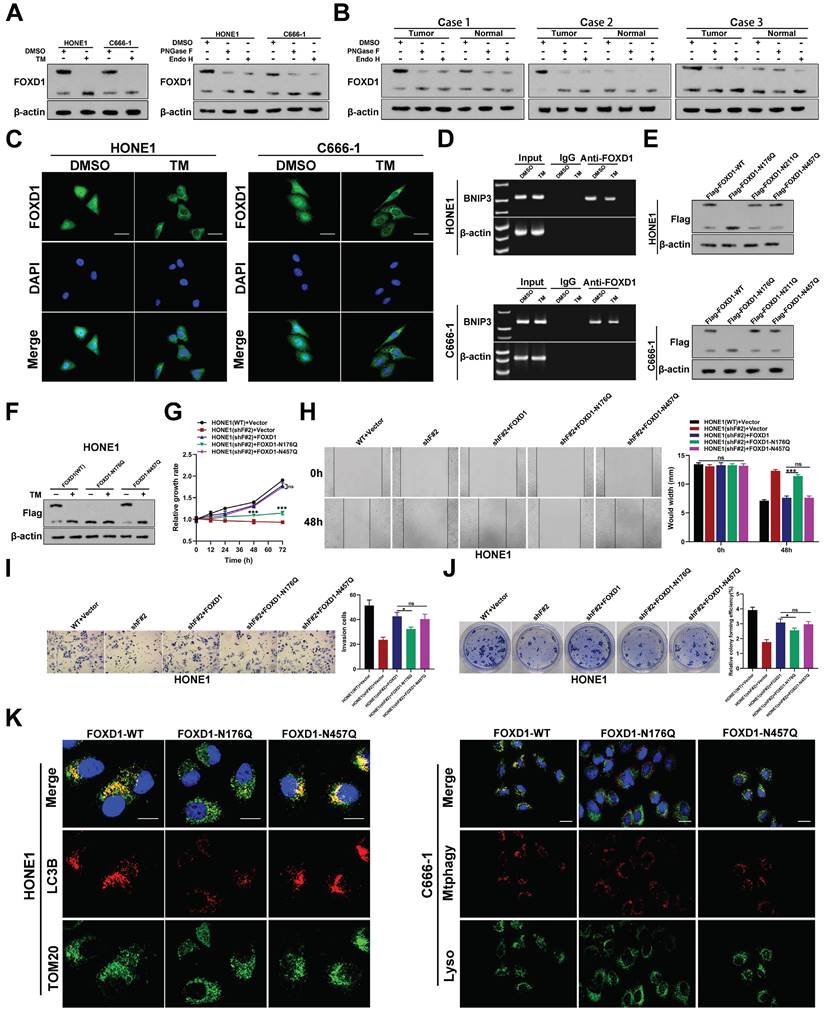
To elucidate the role of N-glycosylation in FOXD1 function, immuno-fluorescence (IF) analysis was performed. This assay confirmed that treatment with tunicamycin (TM), an N-glycosylation inhibitor, reduced the nuclear distribution of FOXD1 (Fig. 6C). Furthermore, ChIP assays combined with agarose gel electrophoresis demonstrated that the transcriptional regulatory effect of FOXD1 on BNIP3 decreased following TM treatment (Fig. 6D). These findings suggest that N-glycosylation of FOXD1 might promote its nuclear translocation. We consulted online prediction websites such as Glycomine and NetNGlyc to identify potential N-glycosylation modification sites within the FOXD1 protein sequence. Based on this analysis, we identified three asparagine (Asn) residues (Asn176, Asn211, and Asn457) as potential N-glycosylation sites. To investigate these potential sites, we constructed plasmids harboring mutations at each Asn residue, where the asparagine was replaced with glutamine (Gln). Wild-type plasmid (Flag-FOXD1-WT) and mutant plasmids (Flag-FOXD1-N176Q, Flag-FOXD1-N211Q, and Flag-FOXD1-N457Q) were constructed for subsequent experiments. These plasmids were then transfected into HONE1 and C666-1 cells, respectively. Western blot analysis revealed that compared with wild-type plasmids, only mutations at Asn176 resulted in a decrease in the molecular weight of the FOXD1 protein band. Mutations at Asn211 and Asn457 did not affect the molecular weight (Fig. 6E). Further experiments verified that treatment with TM effectively inhibited the N-glycosylation modification of FOXD1 and led to a decrease in the molecular weight of the FOXD1 protein band in NPC cells transfected with either the wild-type plasmid (WT) or the mutant plasmid at Asn457. However, TM treatment had no effect on the N-glycosylation modification of FOXD1 in NPC cells transfected with the mutant plasmid at Asn176 (Fig. 6F). Collectively, these results strongly suggest that Asn176 is the functional N-glycosylation modification site of FOXD1.
To further explore the functional significance of N-glycosylation at Asn176, we employed a series of assays. CCK8 and colony formation assays confirmed that FOXD1 knockout significantly reduced the NPC cell growth rate. Overexpression of either the wild-type FOXD1 plasmid (FOXD1-WT) or the FOXD1-N457Q mutant plasmid effectively reversed the inhibitory effect of FOXD1 silencing on cell growth (Fig. 6G, 6J). In contrast, overexpression of the FOXD1-N176Q mutant plasmid only restored cell growth to a certain extent. Wound healing (Fig. 6H) and transwell assays (Fig. 6I) revealed that FOXD1 knockdown markedly reduced the migration and invasion capacities of NPC cells. Overexpression of either FOXD1-WT or FOXD1-N457Q completely and effectively reversed the weakening effect of FOXD1 silencing on these processes. Overexpression of FOXD1-N176Q only restored these abilities to some extent, and the migration and invasion capacities of NPC cells transfected with FOXD1-N176Q were significantly lower than those observed in the FOXD1-WT or FOXD1-N457Q groups (Fig. 6H, 6I). In conclusion, N-glycosylation at Asn-176 appears to enhance the oncogenic potential of FOXD1. This modification promotes the proliferation, migration, and invasion abilities of NPC cells. Furthermore, while overexpression of FOXD1-WT or FOXD1-N457Q increased the mitophagy level of NPC cells, overexpression of FOXD1-N176Q did not enhance mitophagy.
To investigate whether N-glycosylation modification of FOXD1 affects the sensitivity of NPC cells to GEM, we performed a series of experiments. Western blot analysis revealed a downward shift in the molecular weight of FOXD1 protein bands in the GEM+TM group compared to the GEM group (Supplementary Fig. 10A), suggesting that TM treatment inhibited N-glycosylation. IF analysis confirmed a significant reduction in FOXD1 nuclear localization and intensity in the GEM+TM group compared to the GEM group (Supplementary Fig. 10B). This finding suggests that TM treatment might impair the nuclear translocation of FOXD1. As expected, GEM treatment inhibited the growth rate of NPC cells compared to the control group (DMSO). Notably, the growth rate of cells in the GEM+TM group was significantly slower than that in the GEM group (Supplementary Fig. 10C). Flow cytometry results further demonstrated that GEM treatment promoted NPC cell apoptosis compared to the control group. Interestingly, the addition of TM led to an even greater increase in apoptosis (Supplementary Fig. 10D). Wound healing, transwell, and colony formation assays all confirmed that GEM inhibited the migration and invasion capacities of NPC cells. Furthermore, the migration and invasion capacities in the GEM+TM group were significantly weaker than those observed in the GEM group (Supplementary Fig. 10E-10G). These findings suggest that N-glycosylation might contribute to the invasive and migratory abilities of NPC cells. Finally, we investigated the impact of N-glycosylation on mitophagy levels. Here, we observed that GEM treatment increased the mitophagy level of NPC cells, while the addition of TM reduced this effect (Supplementary Fig. 10H, 10I). In conclusion, N-glycosylation plays a critical role in NPC cell sensitivity to gemcitabine treatment. Importantly, N-glycosylation can enhance the mitophagy level and reduce the overall sensitivity of NPC cells to gemcitabine.
ALG3 interacts with FOXD1 and induces its N-glycosylation
To identify the glucosyltransferase mediating FOXD1 N-glycosylation, we transfected HONE1 cells with a Flag-tagged FOXD1 plasmid. We then performed a co-immunoprecipitation (co-IP) assay using a FLAG-tagged antibody followed by high-performance liquid chromatography-tandem mass spectrometry (HPLC-MS/MS) analysis. This analysis identified alpha-1,3-mannosyltransferase (ALG3) as a potential binding partner for the FOXD1 protein (Supplementary Fig. 11). We then investigated the functional role of ALG3 in FOXD1 N-glycosylation. Western blot analysis confirmed the knockdown and overexpression efficiency of ALG3. Overexpression of ALG3 resulted in an upward shift in the molecular weight of FOXD1 protein bands, suggesting increased glycosylation. Furthermore, it led to the upregulation of FOXD1 protein expression (Fig. 7A). Conversely, ALG3 knockdown resulted in a downward shift in FOXD1 protein bands and a decrease in its expression. Subsequently, ALG3 was knocked down or over-expressed in HONE1 and C666-1 cells following treatment with cycloheximide (CHX), which revealing that ALG3 could strikingly enhance the protein stability of FOXD1 (Supplementary Fig. 12A).
ALG3 interacts with FOXD1 and induces its N-glycosylation. A Protein expression of ALG3 and FOXD1 in HONE1 and C666-1 cells transfected with different plasmids. B co-IP assay verified that FOXD1 could directly bind with ALG3. C Immunofluorescence assay indicated that ALG3 could promote the nucleus distribution of FOXD1 in HONE1 and C666-1 cells. CCK8 assay, Transwell assay, wounding healing assay, and colony formation assay were used to measure the cell growth (D), invasion (E), migration (F), and colony forming (G) ability after ALG3 silencing or over-expression in HONE1 and HK-1 cells. Scale bars: 10μm.
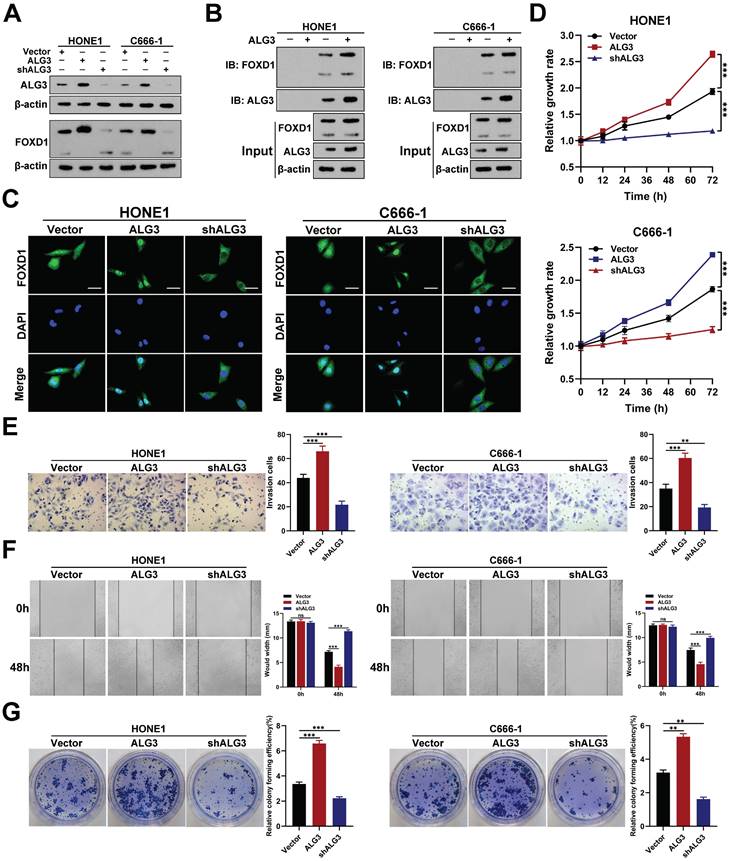
Co-IP assays further verified that ALG3 could directly interact with FOXD1 protein in both HONE1 and C666-1 cells (Fig. 7B). IF analysis confirmed that ALG3 overexpression increased the nuclear distribution of FOXD1, while knockdown decreased its nuclear localization (Fig. 7C). Moreover, WB assay revealed that compared with wild-type plasmids, mutations at Asn176 but not Asn457 in HONE1 and C666-1 cells could affect the the effect of ALG3 on N-glycosylation modification of FOXD1 (Supplementary Fig. 12B), which indicating that Asn176 is the site that ALG3 mediated the N-glycosylation modification of FOXD1.
These findings collectively suggest that ALG3 mediates N-glycosylation modification of FOXD1 and promotes its nuclear translocation. To further explore the role of ALG3 in NPC, we analyzed gene expression data sets from GEO. We found that ALG3 mRNA expression levels were significantly elevated in NPC tissues compared to controls in both GSE12452 and GSE53819 datasets (Supplementary Fig. 13). Functional assays demonstrated that ALG3 could significantly promote the proliferation of NPC cells, as evidenced by CCK8 and colony formation assays (Fig. 7D, 7G). Furthermore, wound healing and transwell assays revealed that ALG3 enhanced the migration and invasion capacities of NPC cells (Fig. 7E, 7F).
Inhibition of FOXD1‑dependent mitophagy sensitizes NPC cells to GEM treatment
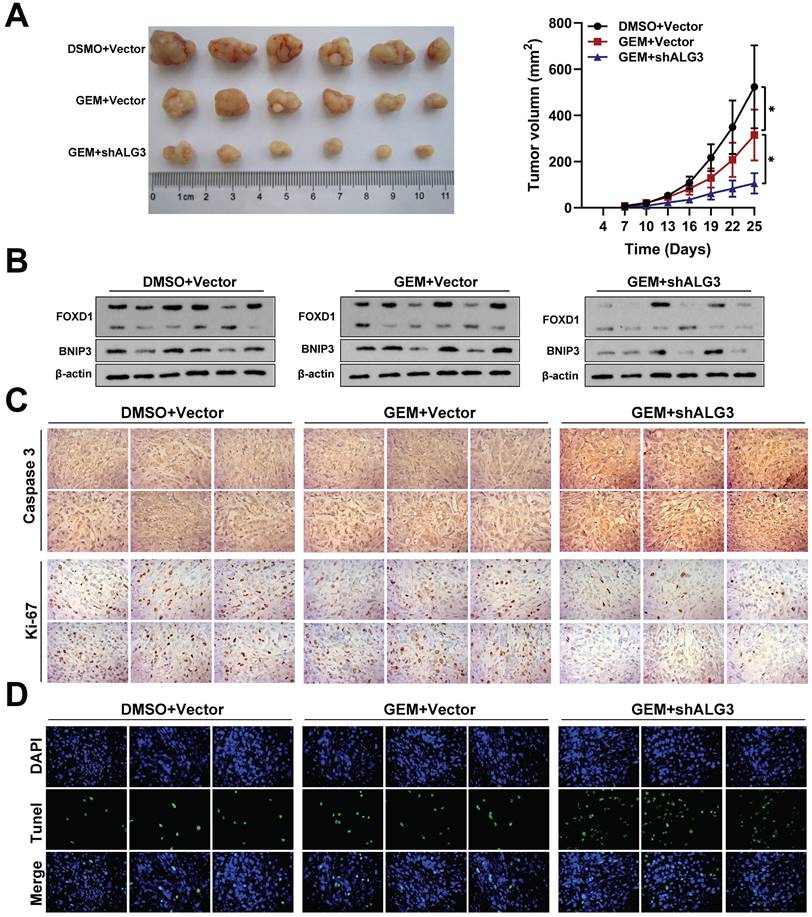
To validate our in vitro findings, we investigated the efficacy of gemcitabine (5 mg/kg) alone or in combination with shALG3 (gemcitabine 5 mg/kg + shALG3) on NPC growth in immunodeficient mice bearing orthotopic xenograft tumors. A normal saline control group was also included. Gemcitabine treatment alone had minimal effect on the expression levels of FOXD1 and BNIP3, but it did inhibit cell proliferation (Fig. 8A). However, the combination treatment with shALG3 depletion led to a significant decrease in the expression of both FOXD1 and BNIP3 (Fig. 8B). In vivo analysis revealed that both gemcitabine alone and the combination treatment significantly inhibited tumor growth, decreased Ki67 expression and increased Caspase 3 expression (Fig. 8C). TUNEL staining further confirmed that both gemcitabine alone and the combination treatment promoted cell apoptosis within the tumors (Fig. 8D). These findings support the hypothesis that ALG3 promotes BNIP3-mediated mitophagy in NPC cells by inducing N-glycosylation modification and enhancing FOXD1 protein stability.
Inhibition of FOXD1-dependent mitophagy sensitizes NPC cells to GEM treatment. A Representative tumor images and size of HONE1 tumors formed in the subcutaneous implantation mice was monitored every three days between different groups. B WB of FOXD1, BNIP3 and β-actin in the different group tumors. C IHC of Caspase-3 and Ki-67 in the different group tumors. D Representative TUNEL staining in subcutaneous tumor tissues of mice was shown. *p < 0.05.
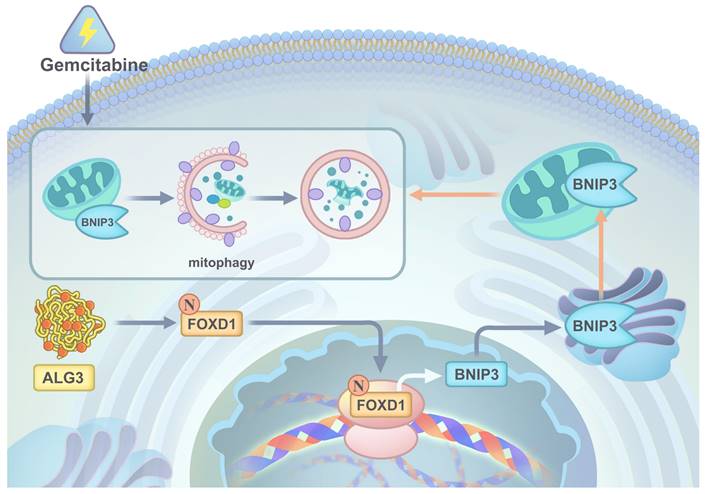
In conclusion, our comprehensive in vitro and in vivo studies employing gain-of-function, loss-of-function, and combination therapy approaches have demonstrated the critical roles of the ALG3-FOXD1 axis in mitophagy, a process that contributes to NPC growth and gemcitabine resistance. We found that combining gemcitabine treatment with ALG3 knockdown effectively inhibited NPC cell growth. A schematic representation summarizing the key molecular mechanisms underlying these observations is presented in Figure 9.
A graphic illustration of ALG3 promoting tumor progression and gemcitabine resistance f NPC by modulating FOXD1 N-glycosylation to facilitate its nuclear translocation to enhance BNIP3-dependent mitophagy level.
Discussion
Mitochondrial flexibility is crucial for the survival of NPC cells under stress conditions such as starvation, hypoxia, and chemo/radiotherapy [23]. Mitophagy, the selective degradation of damaged mitochondria, plays a vital role in maintaining cellular health [24]. However, growing evidence suggests that mitophagy can also contribute to cancer progression and metastasis [25]. Deciphering the factors regulating mitophagy in NPC development remains an area of active research. Transcription factor FOXD1 has been implicated in the development of various cancers [26-30]. Our analysis of GEO datasets revealed that FOXD1 is among the most significantly upregulated genes in NPC tissues. Herein, we demonstrated that NPC with high FOXD1 expression exhibits greater malignant potential and a poorer prognosis. Mechanistically, it is highly conceivable that FOXD1 triggers cytoprotective mitophagy in NPC cells by transcriptionally regulating BNIP3 expression under cellular stress. Furthermore, we found that FOXD1 expression negatively correlates with the clinical efficacy of gemcitabine therapy. Interestingly, combining FOXD1 knockdown or BNIP3 silencing with gemcitabine treatment, which effectively blocks mitophagy, significantly improved therapeutic outcomes. Collectively, our findings identify FOXD1 as a novel and crucial factor promoting NPC growth, metastasis, and resistance to gemcitabine therapy through its role in regulating mitophagy. This study highlights FOXD1 as a potential therapeutic target for NPC treatment.
Mitophagy, the selective degradation of damaged mitochondria, is a cellular response that allows for adaptation to environmental stress [31]. Disruptions in mitophagy are increasingly recognized as key contributors to tumor progression [31]. Herein, we demonstrated that FOXD1 functions as an independent prognostic factor and plays a critical role in promoting NPC cell growth, migration, and invasion. Emerging evidence suggests that FOXD1 expression is associated with aggressive tumor behavior in various cancers. However, the precise role of FOXD1 in cancer progression remains largely unexplored.
A key question emerging from this work is how FOXD1 promotes NPC cell growth under stress conditions. RNA sequencing analysis revealed a potential link between FOXD1 and the autophagy pathway, specifically in BNIP3-mediated mitophagy, which is thought to contribute to NPC growth and metastasis. We hypothesized that FOXD1 might transcriptionally activate BNIP3 expression, thereby promoting mitophagy and malignant progression in NPC cells, potentially leading to insensitivity to chemotherapeutic drugs. Our findings demonstrated that FOXD1 overexpression indeed transcriptionally upregulates BNIP3 expression, suggesting a novel role for FOXD1 as a regulator of BNIP3-mediated mitophagy. This observation aligns with growing evidence that mitophagy can protect cancer cells from the cytotoxic effects of chemotherapy drugs [32]. BNIP3, a receptor playing a critical role in mitophagy regulation within cancer cells, is a particularly well-studied example [32]. While some studies suggest that BNIP3-mediated mitophagy can induce cell death in specific contexts (e.g., glioma cells treated with ceramides), others have shown a protective role for BNIP3-mediated mitophagy (e.g., SH-SY5Y neuroblastoma cells treated with TNF-α) [32]. These findings highlight the context-dependent nature of BNIP3 function, where it can regulate both pro-death and pro-survival mitophagy pathways. Mechanistically, BNIP3 can promote autophagy by activating the autophagy pathway and initiating mitophagy through several mechanisms. First, BNIP3 can inhibit the phosphorylation of mTOR, a key negative regulator of autophagy, either by binding to Rheb or by releasing Beclin-1 through interaction with Bcl-2 [33]. Second, BNIP3 can directly initiate the engulfment of damaged mitochondria by autophagosomes. This process relies on the C-terminal transmembrane domain of BNIP3, which allows for its insertion into the outer mitochondrial membrane, as well as its LC3 interaction regions (LIRs) that facilitate binding to LC3B-II, a key autophagic protein [34]. In the present study, we observed a significant increase in BNIP3 expression upon FOXD1 overexpression. This correlated with enhanced malignant potential of NPC cells, including increased cell growth, migration, and invasion. These findings were further supported by in vivo studies. Furthermore, treatment with an autophagy inhibitor or BNIP3 knockdown significantly abrogated the observed enhancement in the malignant potential of NPC cells. Collectively, these findings suggest a novel mechanism by which FOXD1 promotes NPC progression and chemoresistance. Importantly, FOXD1 can transcriptionally activate BNIP3 expression, leading to BNIP3-mediated mitophagy and ultimately promoting NPC cell growth, migration, invasion, and insensitivity to chemotherapeutic drugs. Our findings highlight FOXD1 and BNIP3 as potential therapeutic targets for NPC treatment.
Gemcitabine remains a cornerstone of first-line therapy for advanced NPC, demonstrably increasing patient survival rates [35]. However, real-world clinical data reveals a limited objective response rate, often below 30%, highlighting the emergence of gemcitabine resistance in a significant subset of NPC patients [36]. This phenomenon warrants further investigation. Our findings demonstrate that FOXD1 can bind to the BNIP3 promoter region, thereby transcriptionally activating BNIP3 expression. Furthermore, we observed a significant increase in the LC3B II/LC3B I ratio, a marker of autophagic activity, and enhanced co-localization of LC3B with TOMM20 (a mitochondrial outer membrane protein) and mitochondrial markers. These findings suggest that gemcitabine treatment may activate mitophagy in NPC cells.
Interestingly, FOXD1 knockdown not only restricted BNIP3-mediated mitophagy but also increased the sensitivity of NPC cells to gemcitabine. Moreover, inhibiting mitophagy with BNIP3 shRNA further enhanced the inhibitory effects of gemcitabine on cell growth, migration, and invasion in HONE1 cells with high FOXD1 expression. Glycosylation modification is a prominent feature of malignant tumors and plays a crucial role in regulating protein function. It is involved in various cellular processes, including peptide chain folding, polymerization, transport, and maturation. Glycosylation modifications also contribute significantly to tumor proliferation, invasion, and metastasis [37, 38]. N-glycosylation modification is a specific type of co-translational or post-translational modification of newly synthesized proteins. This modification involves the attachment of a sugar chain to the free amino group (NH2) of a specific asparagine residue (N-X-S/T, where X is any amino acid except proline) within the protein sequence. PNGase F (glycosylpeptidase) is a highly effective glycoside endonuclease that can cleave the glycosidic bond between asparagine residues and N-acetylglucosamine. This cleavage removes most N-linked sugar chains from glycoproteins, releasing entire oligosaccharide chains [39]. Endo H has a narrower substrate specificity, primarily targeting high-mannose and hybrid-type N-glycans. This enzyme specifically hydrolyzes the glycosidic bond between N-acetylglucosamine residues [39]. To investigate the role of glycosylation in FOXD1 function, we treated NPC cells with TM, PNGase F, and Endo H. Western blot analysis confirmed N-glycosylation modification of the FOXD1 protein. Subsequently, online prediction tools were utilized to identify three potential N-glycosylation sites within the human FOXD1 protein sequence. Through directed mutagenesis, we further confirmed that asparagine residue 176 (Asn-176) serves as the N-glycosylation modification site for human FOXD1. A growing body of research highlights the critical role of N-glycosylation modifications in the proper folding, functional localization, intracellular transport, and stability of proteins [40].
For our investigation of FOXD1 N-glycosylation, we selected two NPC cell lines, HONE1 and C666-1, as primary models. These cell lines were chosen due to their high FOXD1 protein expression and the presence of detectable N-glycosylation modifications, as evidenced by the distinct banding patterns observed upon endoglycosidase digestion. These features make them ideal for studying N-glycosylation modifications in FOXD1. We treated NPC cells with tunicamycin, PNGase F, and Endo H to investigate the impact of N-glycosylation on FOXD1 function. Our findings suggest that N-glycosylation modifications can promote the nuclear translocation of FOXD1 and enhance its ability to bind to target DNA sequences, thereby upregulating the transcription of the downstream mitophagy-related gene BNIP3. To further explore the N-glycosyltransferases involved in FOXD1 glycosylation, we analyzed the expression and prognostic data of 114 glycosyltransferases in NPC tissues. This analysis identified ALG3 as a potential candidate. ALG3 is highly expressed in NPC tissues and exhibits a negative correlation with poor patient prognosis. Functionally, ALG3 possesses 1,3-glucosyltransferase activity, initiating the biosynthesis of N-linked oligosaccharides within the endoplasmic reticulum, a crucial step in N-glycosylation. Mutations in ALG3 can lead to a loss of mannose residues from the oligosaccharide chain [41]. Previous work by Sun et al. demonstrated that ALG3 could activate TGFβ signaling by mediating N-glycosylation modification of TGFBR2-β, ultimately promoting radioresistance and stem cell characteristics in breast cancer [41]. In our study, we observed that overexpression of ALG3 increased the level of N-glycosylation modification on FOXD1. This modification, in turn, promoted malignant phenotypes in NPC cells, including enhanced proliferation, migration, and invasion.
This study identified FOXD1 as a novel factor promoting NPC progression and resistance to gemcitabine therapy. We demonstrate that FOXD1 was upregulated in NPC tissues and was positively associated with decreased patient survival. Furthermore, our findings elucidated the functional role and underlying mechanism of FOXD1 in NPC development. We provided hitherto undocumented evidence that gemcitabine-induced mitophagy, a cellular process for eliminating damaged mitochondria, is suppressed by FOXD1 or BNIP3 knockdown. FOXD1 could promote cytoprotective mitophagy through transcriptional upregulation of BNIP3, thereby facilitating NPC cell migration and invasion, potentially alleviating cellular stress, and ultimately contributing to gemcitabine resistance. Mechanistically, we revealed a novel regulatory pathway where the N-glycosyltransferase ALG3 could interact with FOXD1, inducing its N-glycosylation and enhancing its nuclear distribution and transcriptional activity. FOXD1, along with its upstream regulators and downstream targets, holds promise as both a prognostic marker and a potential therapeutic target for NPC. Our findings suggest that designing inhibitors targeting the ALG3-FOXD1-BNIP3 axis or mitophagy represents a promising therapeutic approach to improve the efficacy of gemcitabine treatment for NPC.
Conclusions
Collectively, our findings demonstrate that the ALG3-FOXD1 axis enhances mitophagy by transcriptionally activating BNIP3 expression, thereby promoting NPC progression and modulating the response of NPC cells to gemcitabine. Combinations of therapeutic strategies that target both the ALG3-FOXD1-BNIP3 axis and gemcitabine-induced mitophagy may represent an effective treatment approach for NPC.
Supplementary Material
Supplementary figures and table.
Acknowledgements
We thank Home for Researchers editorial team (www.home-for-researchers.com) for language editing service.
Funding
This work was supported by the Funds for International Cooperation and Exchange of the National Natural Science Foundation of China (GZ1699), key research and development projects in Hunan Province (2022SK2022), the science and technology innovation Program of Hunan Province (2020RC4011), Scientific research project of Hunan Provincial Health Commission (202209034683), Central South University Research Programme of Advanced Interdisciplinary Studies (2023QYJC 017), and the Wisdom Accumulation and Talent Cultivation Project of the Third Xiangya hosipital of Central South University (BJ202001), the Natural Science Foundation of Hunan Province (2024JJ3044), the Major Scientific Research Program for High-level Talents in Healthcare of Hunan Province (R2023021), Young Scholars of “Furong Scholar Program” in Hunan Province (2020FR-XY3QN-2).
Availability of data and materials
The datasets used and/or analyzed during the current study are available from the corresponding author on reasonable request.
Ethics approval and consent to participate
The study was approved by the Institutional Review Board of Third Xiangya Hospital of Central South University. All patients provided written informed consent. All Institutional and National Guidelines for the care and use of animals were followed.
Author Contributions
Zhanwang Wang: Investigation, Data curation, Formal analysis. Yi Jin: Investigation, Formal analysis. He Dong: Investigation, Data curation. Yuxing Zhu: Investigation. Yaxing Cheng: Data curation. Xiaoming Liu: Formal analysis. Mengqing Xiao: Formal analysis. Ke Cao: Conceptualization, Supervision, Funding acquisition, Writing - original draft, Writing - review & editing. All authors read and approved the final manuscript.
Competing Interests
The authors have declared that no competing interest exists.
References
1. Chua MLK, Wee JTS, Hui EP, Chan ATC. Nasopharyngeal carcinoma. Lancet. 2016;387:1012-1024
2. Wu LR, Zhang XM, Xie XD, Lu Y, Wu JF, He X. Validation of the 8th edition of AJCC/UICC staging system for nasopharyngeal carcinoma: Results from a non-endemic cohort with 10-year follow-up. Oral Oncol. 2019;98:141-146
3. Zhang Y, Chen L, Hu GQ, Zhang N, Zhu XD, Yang KY. et al. Gemcitabine and Cisplatin Induction Chemotherapy in Nasopharyngeal Carcinoma. N Engl J Med. 2019;381:1124-1135
4. Hong S, Zhang Y, Yu G, Peng P, Peng J, Jia J. et al. Gemcitabine Plus Cisplatin Versus Fluorouracil Plus Cisplatin as First-Line Therapy for Recurrent or Metastatic Nasopharyngeal Carcinoma: Final Overall Survival Analysis of GEM20110714 Phase III Study. J Clin Oncol. 2021;39:3273-3282
5. Quintero-Ronderos P, Laissue P. The multisystemic functions of FOXD1 in development and disease. J Mol Med (Berl). 2018;96:725-739
6. Laissue P, Lakhal B, Vatin M, Batista F, Burgio G, Mercier E. et al. Association of FOXD1 variants with adverse pregnancy outcomes in mice and humans. Open Biol. 2016;6:160109
7. Fu L, Hu Y, Song M, Liu Z, Zhang W, Yu FX. et al. Up-regulation of FOXD1 by YAP alleviates senescence and osteoarthritis. PLoS Biol. 2019;17:e3000201
8. Honeycutt SE, N'Guetta PY, Hardesty DM, Xiong Y, Cooper SL, Stevenson MJ. et al. Netrin 1 directs vascular patterning and maturity in the developing kidney. Development. 2023;150:dev201886
9. Cheng P, Wang J, Waghmare I, Sartini S, Coviello V, Zhang Z. et al. FOXD1-ALDH1A3 Signaling Is a Determinant for the Self-Renewal and Tumorigenicity of Mesenchymal Glioma Stem Cells. Cancer Res. 2016;76:7219-7230
10. Cai K, Chen S, Zhu C, Li L, Yu C, He Z. et al. FOXD1 facilitates pancreatic cancer cell proliferation, invasion, and metastasis by regulating GLUT1-mediated aerobic glycolysis. Cell Death Dis. 2022;13:765
11. Long Y, Chong T, Lyu X, Chen L, Luo X, Faleti OD. et al. FOXD1-dependent RalA-ANXA2-Src complex promotes CTC formation in breast cancer. J Exp Clin Cancer Res. 2022;41:301
12. Panigrahi DP, Praharaj PP, Bhol CS, Mahapatra KK, Patra S, Behera BP. et al. The emerging, multifaceted role of mitophagy in cancer and cancer therapeutics. Semin Cancer Biol. 2020;66:45-58
13. Doblado L, Lueck C, Rey C, Samhan-Arias AK, Prieto I, Stacchiotti A. et al. Mitophagy in Human Diseases. Int J Mol Sci. 2021;22:3903
14. Han R, Liu Y, Li S, Li XJ, Yang W. PINK1-PRKN mediated mitophagy: differences between in vitro and in vivo models. Autophagy. 2023;19:1396-1405
15. Stanley P. Genetics of glycosylation in mammalian development and disease. Nat Rev Genet. 2024;25:715-729
16. Girgis M, Petruncio G, Russo P, Peyton S, Paige M, Campos D. et al. Analysis of N- and O-linked site-specific glycosylation by ion mobility mass spectrometry: State of the art and future directions. Proteomics. 2024;24:e2300281
17. Matsumoto Y, Ju T. Aberrant Glycosylation as Immune Therapeutic Targets for Solid Tumors. Cancers (Basel). 2023;15:3536
18. Li XJ, Qian CN. Serglycin in human cancers. Chin J Cancer. 2011;30:585-589
19. Lin Y, Lubman DM. The role of N-glycosylation in cancer. Acta Pharm Sin B. 2024;14:1098-1110
20. Boscher C, Dennis JW, Nabi IR. Glycosylation, galectins and cellular signaling. Curr Opin Cell Biol. 2011;23:383-392
21. Sun X, He Z, Guo L, Wang C, Lin C, Ye L. et al. ALG3 contributes to stemness and radioresistance through regulating glycosylation of TGF-β receptor II in breast cancer. J Exp Clin Cancer Res. 2021;40:149
22. Castaneda M, Hollander PD, Mani SA. Forkhead Box Transcription Factors: Double-Edged Swords in Cancer. Cancer Res. 2022;82:2057-2065
23. Chen Q, Zheng W, Zhu L, Liu H, Song Y, Hu S, Bai Y, Pan Y, Zhang J, Guan J, Shao C. LACTB2 renders radioresistance by activating PINK1/Parkin-dependent mitophagy in nasopharyngeal carcinoma. Cancer Lett. 2021;518:127-139
24. Yang M, Wei X, Yi X, Jiang DS. Mitophagy-related regulated cell death: molecular mecha-nisms and disease implications. Cell Death Dis. 2024;15:505
25. Abdelmaksoud NM, Abulsoud AI, Abdelghany TM, Elshaer SS, Rizk SM, Senousy MA. Mitochondrial remodeling in colorectal cancer initiation, progression, metastasis, and therapy: A review. Pathol Res Pract. 2023;246:154509
26. Huang Y, Zhang L, Liu T, Liang E. LMNB1 targets FOXD1 to promote progression of prostate cancer. Exp Ther Med. 2023;26:513
27. Wu T, Yang Z, Chen W, Jiang M, Xiao Z, Su X. et al. miR-30e-5p-mediated FOXD1 promotes cell proliferation by blocking cellular senescence and apoptosis through p21/CDK2/Rb signaling in head and neck carcinoma. Cell Death Discov. 2023;9:295
28. Zhang Q, Chen Z, Tang Q, Wang Z, Lu J, You Y. et al. USP21 promotes self-renewal and tumorigenicity of mesenchymal glioblastoma stem cells by deubiquitinating and stabilizing FOXD1. Cell Death Dis. 2022;13:712
29. Sun Q, Novak D, Hüser L, Poelchen J, Wu H, Granados K. et al. FOXD1 promotes dedifferentiation and targeted therapy resistance in melanoma by regulating the expression of connective tissue growth factor. Int J Cancer. 2021;149:657-674
30. Lin CH, Lee HH, Chang WM, Lee FP, Chen LC, Lu LS. et al. FOXD1 Repression Potentiates Radiation Effectiveness by Downregulating G3BP2 Expression and Promoting the Activation of TXNIP-Related Pathways in Oral Cancer. Cancers (Basel). 2020;12:2690
31. Rotimi DE, Iyobhebhe M, Oluwayemi ET, Evbuomwan IO, Asaleye RM, Ojo OA. et al. Mitophagy and spermatogenesis: Role and mechanisms. Biochem Biophys Rep. 2024;38:101698
32. Liu H, Huang H, Li R, Bi W, Feng L, E L. et al. Mitophagy protects SH-SY5Y neuroblastoma cells against the TNFα-induced inflammatory injury: Involvement of microRNA-145 and Bnip3. Biomed Pharmacother. 2019;109:957-968
33. Field JT, Gordon JW. BNIP3 and Nix: Atypical regulators of cell fate. Biochim Biophys Acta Mol Cell Res. 2022;1869:119325
34. Springer MZ, Poole LP, Drake LE, Bock-Hughes A, Boland ML, Smith AG. et al. BNIP3-dependent mitophagy promotes cytosolic localization of LC3B and metabolic homeostasis in the liver. Autophagy. 2021;17:3530-3546
35. Liu T, Dai S, Zhang H, Zhong X, Ding Z, Ma X. The best choice of induction chemotherapy for patients with locally advanced nasopharyngeal carcinoma: Bayesian network meta-analysis. Head Neck. 2022;44:518-529
36. Yeo BSY, Lee RS, Lim NE, Tan E, Jang IJH, Toh HC. et al. Efficacy and Safety of Cell-based Immunotherapy in The Treatment of Recurrent or Metastatic Nasopharyngeal Carcinoma-A Systematic Review and Meta-analysis. Oral Oncol. 2024;152:106786
37. Zhao J, Sun H, Wang C, Shang D. Breast cancer therapy: from the perspective of glucose metabolism and glycosylation. Mol Biol Rep. 2024;51:546
38. Bresnahan E, Bravo-Cordero JJ. Sweet dreams: glycosylation controls tumor cell dormancy. Trends Cancer. 2024;10:180-181
39. Yoon D, Moon JH, Cho A, Boo H, Cha JS, Lee Y. et al. Structure-Based Insight on the Mechanism of N-Glycosylation Inhibition by Tunicamycin. Mol Cells. 2023;46:337-344
40. Hu M, Zhang R, Yang J, Zhao C, Liu W, Huang Y. et al. The role of N-glycosylation modification in the pathogenesis of liver cancer. Cell Death Dis. 2023;14:222
41. Shang Z, Ming X, Wu J, Liu W, Xiao Y. CircPTK2 promotes cell viability, cell cycle process, and glycolysis and inhibits cell apoptosis in acute myeloid leukemia by regulating miR-582-3p/ALG3 axis. Expert Rev Hematol. 2022;15:1073-1083
Author contact
![]() Corresponding author: Ke Cao, Department of Oncology, Third Xiangya Hospital of Central South University, 138 Tongzipo Road, Changsha 410013, China. E-mail: csucaokecom; Tel.: +86 0731-88618240; Fax: +86 0731-88618285.
Corresponding author: Ke Cao, Department of Oncology, Third Xiangya Hospital of Central South University, 138 Tongzipo Road, Changsha 410013, China. E-mail: csucaokecom; Tel.: +86 0731-88618240; Fax: +86 0731-88618285.