Impact Factor ISSN: 1449-2288

 Global reach, higher impact
Int J Biol Sci 2025; 21(5):1932-1948. doi:10.7150/ijbs.104598 This issue Cite
Research Paper
TMEM105 modulates disulfidptosis and tumor growth in pancreatic cancer via the β-catenin-c-MYC-GLUT1 axis
Yifan Yin1#, Yixuan Sun2#, Hongfei Yao3#, Feng Yu1#, Qinyuan Jia1, Chengyu Hu1, Yuheng Zhu1, Zonghao Duan1, Dejun Liu1, Yongwei Sun1, Yanmiao Huo1 ![]() , Minwei Yang1
, Minwei Yang1 ![]() , Wei Liu1
, Wei Liu1 ![]()
1. Department of Biliary-Pancreatic Surgery, Ren Ji Hospital, School of Medicine, Shanghai Jiao Tong University, Shanghai, 200127, China.
2. Department of Gynecology and Obstetrics, Shanghai Sixth People's Hospital Affiliated to Shanghai Jiao Tong University School of Medicine, Shanghai, 200235, China.
3. Department of General Surgery, Pancreatobiliary Surgery Center, Huadong Hospital Affiliated to Fudan University, Shanghai, 200040, China.
# Equal contribution.
Received 2024-10-3; Accepted 2025-1-27; Published 2025-2-18
Abstract

Background: Pancreatic cancer (PCa) is one of the most malignant diseases in the world. Different from ferroptosis and apoptosis, disulfidptosis is a novel type of cell death. The role of disulfidptosis in PCa remains uncovered.
Methods: Disulfidptosis-related lncRNAs were identified based on TCGA-PAAD database. The disulfidptosis-related predict signature was constructed and verified by bioinformatic analysis. TCGA and GTEx database and Renji tissue microarray (TMA) were applied to determine TMEM105 and its clinical significance. F-actin and PI staining were performed to detect disulfidptosis of PCa cells. The biological function of TMEM105 was investigated by loss-of-function and gain-of-function assays. RNA pull-down and LC-MS/MS analysis were employed to detect TMEM105 interacted proteins. The tissue samples from PCa patients with PET-CT information were utilized to validate the TMEM105-β-catenin-c-MYC-GLUT1 pathway in clinical settings.
Results: A disulfidptosis-related predict signature, which was comprised of six lncRNAs, was constructed and validated by bioinformatic analysis. TMEM105 was identified as disulfidptosis-related lncRNA whose high expression predicted a poor prognosis in PCa. Functional studies revealed that TMEM105 promoted the growth and mitigated the disulfidptosis in PCa. Mechanically, TMEM105 upregulated the expression of β-catenin by maintaining the protein stability through the proteosome pathway. The forced expressed β-catenin increased the expression of glycolysis-related transcription factor c-MYC, thus induced the transcription activity of GLUT1.
Conclusion: These results revealed the growth acceleration and the disulfidptosis mitigation function of TMEM105 in PCa. Targeting the TMEM105-β-catenin-c-MYC-GLUT1 pathway could be a potent therapy for PCa patients.
Introduction
Globally, the morbidity of pancreatic cancer (PCa) ranks the fourth among all cancer types [1]. PCa is characterized by high malignancy, invasiveness and less than 7% of five-year survival rate [2]. Pancreatic ductal adenocarcinoma (PDAC) is the most prevalent type of PCa, accounting for approximately 80% of all cases [3]. Clinically, surgery is the primary treatment for pancreatic cancer. However, only a small number of PCa patients are eligible for surgery while fewer patients could achieve long-term survival after surgical treatment [4, 5]. Therefore, exploring the mechanisms of PCa tumorigenesis and developing effective treatment strategies are urgently needed.
Resistance toward regulated cell death is a typical characteristic of cancer [6]. It refers to upregulation of cancer cell growth and failure of therapy response [7]. For instance, defects of apoptosis could lead to drug resistance and metastasis of cancer cells [8]. Disulfidptosis, different from known types of regulated cell death, is a novel type of cell death. Solute carrier family 7 member 11 (SLC7A11) is a critical transporter protein, playing a key role in mediating cellular cystine uptake. Importantly, cystine serves as a crucial element for synthesizing glutathione and regulating cellular oxidative stress responses. However, as two-edged sword, cystine is cytotoxic as well. Normally, disulfidptosis was triggered under the circumstance where glucose was deprived in high-SLC7A11-expressed cancer cells. In this case, GLUT1 inhibitor treatment could induce depletion of NADPH in the pentose phosphate pathway (PPP), causing disulfide stress in cytoskeleton and the collapse of structural proteins, ultimately leading to disulfidptosis [9]. Nevertheless, the correlation of pancreatic cancer and disulfidptosis has not been fully elaborated.
Long non-coding RNAs (lncRNAs) refer to transcripts with over 200 nucleotides which couldn't be translated into proteins. It could regulate RNAs, DNAs and proteins to influence the cancer cells differentiation, proliferation and migration [10-12]. Numerous studies have verified that lncRNAs could serve as biomarker or therapeutic target in PCa. It was reported that the lncRNA TMEM105 played an important role in promoting breast cancer growth and metastasis by regulating tumor glycolysis [13]. In the research of thyroid papillary carcinoma, TMEM105 was reported to function as a cell cycle-related lncRNA in predicting progression-free survival time [14]. Besides, it was also a ferroptosis- and immune-related lncRNA for predicting patient prognosis in breast infiltrating duct and lobular carcinoma [15]. In addition, TMEM105 was believed to play a crucial role in coronary artery disease [16]. Anyhow, its function in PCa and disulfidptosis remained unclear.
In this study, TMEM105 was identified as a disulfidptosis-related biomarker to predict the prognosis of PCa patients, whose expression was significantly increased in tumorous tissues compared with normal tissues. Mechanically, TMEM105 engages a β-catenin-c-MYC-GLUT1 cascade to promote tumor growth and antagonize disulfidptosis in PCa.
Method and materials
Date collection
178 PCa patients with corresponding clinical data were obtained from TCGA (https://portal.gdc.cancer.gov/repository).
Screening of disufidptosis‑related lncRNAs
GYS1, LRPPRC, NCKAP1, NDUFA11, NDUFS1, NUBPL, OXSM, RPN1, SLC3A2 and SLC7A11 were defined as disulfidptosis-related genes from previous research [17]. Gene annotation was utilized for the identification and screening of lncRNAs. After Pearson correlation analysis (|Pearson R|>0.35, P value<0.001), 19 lncRNAs were selected. The “ggplot2”, “dplyr”, “limma” and “ggalluvial” packages were used to visualize the Sankey diagram of disulfidptosis-related genes and disulfidptosis-related lncRNAs.
Establishing and verifying the risk signature
Randomly, pancreatic cancer patients were divided into training and testing two groups by 1:1. The univariate Cox regression analysis was used on the co-expressed lncRNAs to select the prognostic-related lncRNAs of the training group (p<0.05). Then a least absolute shrinkage and selection operator regression analysis (LASSO) coupled with multivariate Cox regression analysis were performed on the establishment of the risk signature. The risk score was calculated by the following formula:
Risk score =[Exp (lncRNA)×coef (lncRNA)]
The Exp(lncRNA) indicated the lncRNAs expression and the coef(lncRNAs) indicated the corresponding coefficient. The receiver operating characteristic curves (ROC) and the area under the time-dependent ROC curves (AUCs) was constructed by “survmine” and “survival” packages. Finally, the testing cohort and entire cohort was applied to validate the risk signature.
Principal component analysis (PCA)
PCA is performed as a statistical method to reduce dimensionality and visualize the 19 disulfidptosis-related genes, 6 disulfidptosis-related lncRNAs, the risk signature and whole-genome expression profiles. The “Scatterplot3d” package was applied for the PCA visualization.
Patients and tissue microarray (TMA) construction
In this article, there are two groups of samples. The first group: 149 PCa and paired normal tissues from patients receiving surgical treatment in our institution were included to construct TMA. The second group:14 cases of PCa patients and their corresponding PET-CT information. The information of pathology was obtained from the Pathology Department. The overall survival time was calculated from date of receiving surgical treatment to the PCa-related death (approval number: RA-2024-196).
Two pathologists were invited to independently score the Tissue Microarray (TMA). The scoring criteria for positive staining area were as follows: 0%-5% scored as 0, 6%-35% scored as 1, 36%-70% scored as 2, and above 70% scored as 3. Staining intensity was graded with no staining as 0, weak staining as 1, moderate staining as 2, and strong staining as 3. The final score was calculated by multiplying the score for positive staining area by the staining intensity score. A score of 0 was denoted as “-”, 1-3 as “+”, 4-6 as “++", and above 6 as "+++”. When distinguishing between high and low expression groups, a final score below 4 was classified as TMEM105 low expression group, and a score above 4 was classified as the TMEM105 high expression group.
Cell culture and reagents
Pancreatic cell lines (HPNE, Capan-1, Mia CaPa-2, Patu8988, PANC-1 and SW-1990) were obtained from Cell Bank of the Chinese Academy of Sciences (Shanghai, China). Cells were all cultured in the medium instructed by American Type Culture Collection (ATCC) protocols. The reagents used in the study were listed as follows: dithiothreitol (DTT) (MCE, HY-15917), BAY-876 (MCE, HY-100017), SKL2001 (MCE, HY-101085).
Subcellular fractionation
Cytoplasmic and nuclear RNA was separated by using commercial kit (Norgen Biotek, Canada) according to instructions. Briefly, 400 μL of lysis buffer was added to the cell pellet, followed by incubation on ice for 10 minutes and centrifugation at 14,000 rpm for 15 minutes. Hence, the cytoplasmic components were obtained in supernatant while the nuclear was in pellet. Subsequently, the cytoplasmic and nuclear samples were dissolved and mixed with 800μL of 1.6M sucrose solution and centrifuged at 14,000 rpm for 15 minutes at 4°C to purify the cytoplasmic and nuclear fractions. Finally, the purified RNA was dissolved in Trizol.
Knockdown and overexpression assays
The small interfering RNAs (siRNAs) were purchased from Gene Pharma (Shanghai, China). Cells were seeded at an appropriate density in a 6-well plate overnight. siRNA (50 pmol) or 2.5 µl of Dharmacon transfection reagent were added separately into 200 µl of Opti-MEM medium and incubate for 5 minutes. Then, the two solutions were mixed, incubated for 20 minutes, and added to the 6-well plate for 48 to 72 hours. The sequence was as si-TMEM105-1: 5'-CCCAUAGCUGACACUUCUA-3' (sense), 5'-UAGAAGUGUCAGCUAUGGG-3' (antisense); si-TMEM105-2: 5'-GGCAAGCUCUGAUCUUACA-3' (sense), 5'-UGUAAGAUCAGAGCUUGCC-3' (antisense). Sequence of sh-TMEM105-1 and sh-TMEM105-2 was same as that of siRNAs.
The TMEM105 overexpression was achieved using Ubi-MCS-SV40-Puromycin synthesized by Genechem (Shanghai, China). Stable cell line was selected and maintained in the complete medium with 5μg/mL of puromycin.
Quantitative real‑time PCR (qPCR)
qPCR was performed as described previously [18]. Primer sequences are listed as follows: TMEM105 forward, 5'- ATGAAGATAAGAAGGCGA-3', reverse, 5'- GGTGAAAAACACGATGAG-3'; β-catenin forward, 5'-CACAAGCAGAGTGCTGAAGGTG-3', reverse, 5'- GATTCCTGAGAGTCCAAAGACAG-3'; c-MYC forward, 5'-GCCTCAGAGTGCATCGAC-3', reverse, 5'-TCCACAGAAACAACATCG-3'; GLUT1 forward, 5'-ATTGGCTCCGGTATCGTCAAC-3', reverse, 5'-GCTCAGATAGGACATCCAGGGTA-3'; human 18s forward, 5'- GGCCCTGTAATTGGAATGAGTC-3', reverse, 5'- CCAAGATCCAACTACGAGCTT-3'; Relative mRNA expression levels were calculated using the 2-ΔΔCt method and normalized to 18s RNA.
Western blotting (WB)
WB was performed as described previously. [19] Anti-β-catenin (Proteintech, Cat. No. 51067-2-AP), anti-GLUT1 (Proteintech, Cat. No. 21829-1-AP), anti-c-MYC (Proteintech, Cat. No. 10828-1-AP) and anti-β-Actin (Abcam, Cat. No. ab8226) were applied.
Proliferation and migration assays
For CCK-8 assays, cells were seeded at a density of 1,500 cells per well in a 96-well plate with triplicate technical replication per group. The cells were then incubated in a cell culture incubator at 37°C with 5% CO2 for 5 days. On each day, CCK-8 was added and incubated for 1.5 hours. Finally, cell viability was measured under the absorbance wavelength at 450 nm.
For colony formation assays, cells were seeded at a density of 1500 cells per well in a 6-well plate. After an incubation period of 7-10 days, the supernatant was discarded, the cells were washed with PBS, fixed with 4% paraformaldehyde, and stained with crystal violet. Subsequently, images were obtained using a microscope.
For transwell assays, 600μl complete culture medium was added to the lower chamber. After resuspended in serum-free medium at a density of 6 × 10⁴ cells per well, cells were added to the upper chamber of transwell. Following a 12-hour incubation, the cells were fixed with 4% paraformaldehyde and stained with crystal violet. The chamber was imaged under the microscope.
Subcutaneous xenograft models and patient derived xenograft (PDX) models
6-8 weeks male athymic nu/nu mice were applied for subcutaneous injection of Mia CaPa-2 cells with stable TMEM105 knockdown, Patu8988 cells with stable TMEM105 overexpression, along with control cells, at a cell concentration of 2 × 10⁶ cells/100 μl. Tumor volume was measured every four days using a caliper. Tumor volume was calculated as (long diameter × short diameter × short diameter × 1/2). After one month, the mice were euthanized by cervical dislocation under anesthesia, and the tumors were excised for analysis. PDX models were constructed as described previously [20].
EdU detection, cytoskeleton staining and Immunofluorescence (IF) staining
For the EdU detection, cells were cultured in an 8-well chamber slide (ibidi, Cat. No. 80826) at appropriate density. After the cells attached to the chamber, 5-Ethynyl-2'-deoxyuridine (EdU) assay commercial kit (ShareBio, Cat. No. SB-C6015) was applied according to manufacturer's instructions. For the cytoskeleton staining, cells were cultured in an 8-well chamber slide (ibidi, Cat. No. 80826) at appropriate density overnight. 4% paraformaldehyde were added into the chamber at room chamber for 15 minutes. Subsequently, samples were treated with 0.4% Triton X-100 for 5 minutes and stained with 594-phalloidin (ShareBio, Cat. No. SB-YP0052). IF staining was conducted as described previously. Anti-GLUT1 (Proteintech, Cat. No. 21829-1-AP) was used as primary antibody in IF staining assay [20]. All samples were stained with DAPI and visualized by confocal microscope (Zeiss, Germany).
Flow cytometry
Cells were seeded in 12-well plates at the density of 5 × 10⁵ and cultured overnight. Then the cells were cultured in glucose medium without DTT, in glucose-free medium without DTT and in glucose-free medium with DTT (0.25mmol/L) for about 12 h. PI (ShareBio, Cat. No. SB-Y6002) was used to stain the dead cells and the dead cells was measured by flow cytometry.
Glucose consumption assays
Cells were seeded and treated in the 6-well plate for 24 hours before being collected for the following experiment. Glucose assay kit (Invitrogen, Cat. A22189) was applied for the glucose consumption assay. All procedures were following the manufacturer's protocol. The enzyme working solution from the kit was added to each sample, followed by incubating at 37°C for 10 minutes. The absorbance A of the samples was measure at 505 nm of wavelength. The glucose consumption =5.55 × (A complete DMEM - A blank) / (A standard - A blank) - 5.55 × (A treatment - A blank) / (A standard - A blank). The relative glucose consumption was standardized by the number of cells.
NADP+/NADPH measurements
The intracellular levels of NADP+/NADPH were conducted according to the instructions of the commercial kit (S0179, Beyotime, China). Cells were seeded into 6-well plates at the proper density and subjected to the prescribed treatments. The cells were lysed using 200 μl of lysis buffer, and the samples were divided into two parts. Sample A was heated at 60°C for 30 minutes to allow NADP+ convert to NADPH, while sample B was kept on ice. Subsequently, the working buffer was added, and the samples were incubated for 10 minutes while avoiding light exposure. Finally, spectroscopic measurements were performed at 450 nm. The NADP+/NADPH ratio = (intensity of sample A)/ (intensity of sample B - intensity of sample A).
RNA pull-down assays and LC-MS/MS analysis
The resultant plasmid DNA was linearized with restriction enzyme NotI. Biotin-labeled RNAs were in vitro transcribed with the Biotin RNA Labeling Mix (Roche) and T7 RNA polymerase (Roche), treated with RNase-free DNase I (Roche) and purified with the RNeasy Mini Kit (Qiagen). Cells extract was mixed with biotinylated RNA (2 μg/100 pmol). Washed streptavidin agarose beads (100 ml, Invitrogen) were added to each binding reaction and further incubated at room temperature for 0.5 h. Beads were washed 5 times and boiled in SDS buffer. Finally, the retrieved protein was determined by LC-MS/MS and western blot analysis. For LC-MS/MS analysis, proteins were resolved by SDS-PAGE and total protein band was excised, eluted and digested by trypsin. Digests were analyzed by tims TOF pro2 system (Bruker). MS data was analyzed by PeakStudio 11 (Bioinformatics Solutions) by searching the Uniprot protein database.
Immunohistochemistry (IHC), in situ hybridization (ISH) and TUNEL assay
The experimental methods were performed as described previously [21]. The following probes or antibodies were used: TMEM105 specific probe synthesized by servicebio (Wuhan, China), anti-Ki-67 (1:1000, Cat. No. ab15580 Abcam), anti-SLC7A11 (Proteintech, Cat. No. 26864-1-AP), anti-c-MYC (Proteintech, Cat. No. 10828-1-AP), anti-GLUT1 (Proteintech, Cat. No. 21829-1-AP), TUNEL commercial kits (Absin, Cat. No. abs50022).
Statistical analysis
The data were presented as the mean values ± SD. Statistical analyses were performed via GraphPad Prism software 8. Two-tailed Student's t-tests were used for two group comparisons, and one-way analysis of variance (ANOVA) with a Tukey post-hoc test was used for multiple comparisons. Cell viability and tumor volume were analyzed by two-way ANOVA.
Results
Identifying disulfidptosis-related lncRNAs, construction and validation of the disulfidptosis-related predictive signature in PCa
Disulfidptosis is a novel type of cell death, which is triggered under the circumstance where glucose is deprived in high-SLC7A11-expressed cancer cells. Therefore, IHC staining was used to detect the SLC7A11 expression of 5 common cancer types. Obviously, PCa expressed higher level of SLC7A11 than others (Figure 1A). To reveal the role of disulfidptosis in PCa and predict the overall survival (OS) of PCa patients, we constructed a risk signature based on disulfidptosis-related lncRNAs by bioinformatic analysis. Firstly, the RNA sequence profile of PCa samples and corresponding clinicopathological information was obtained from TCGA. In the meantime, 10 disulfidptosis -related genes (GYS1, LRPPRC, NCKAP1, NDUFA11, NDUFS1, NUBPL, OXSM, RPN1, SLC3A2 and SLC7A11) were selected based on the previous reports [17]. In this situation, we acquired 100 disulfidptosis-related lncRNA (|Pearson R|>0.35, and p<0.001) (Figure 1B).
Identifying disulfidptosis-related lncRNAs, construction and validation of the disulfidptosis-related predictive signature in PCa. (A) SLC7A11 expression in five cancer types analyzed by IHC staining. Scale bar: 10x (100 μm) and 20x (50 μm). (B) Sankey diagram of disulfidptosis-related genes and disulfidptosis-related lncRNAs. (C) Cross-validation plot for the penalty term. (D) LASSO expression coefficient plot of disulfidptosis-related lncRNAs. (E) Forest plot of univariate COX regression analysis results for disulfidptosis-related lncRNAs. (F) Heatmap of the correlation between disulfidptosis-related lncRNAs and disulfidptosis-related genes. (G) Risk heatmap of the training set. (H) Distribution plot of risk scores in the training set. (I) Scatter plot of survival status in the training set. (J) Kaplan-Meier (KM) analysis for overall survival (OS) in the training set based on the TCGA database. (K) KM analysis for PFS in the training set based on the TCGA database.
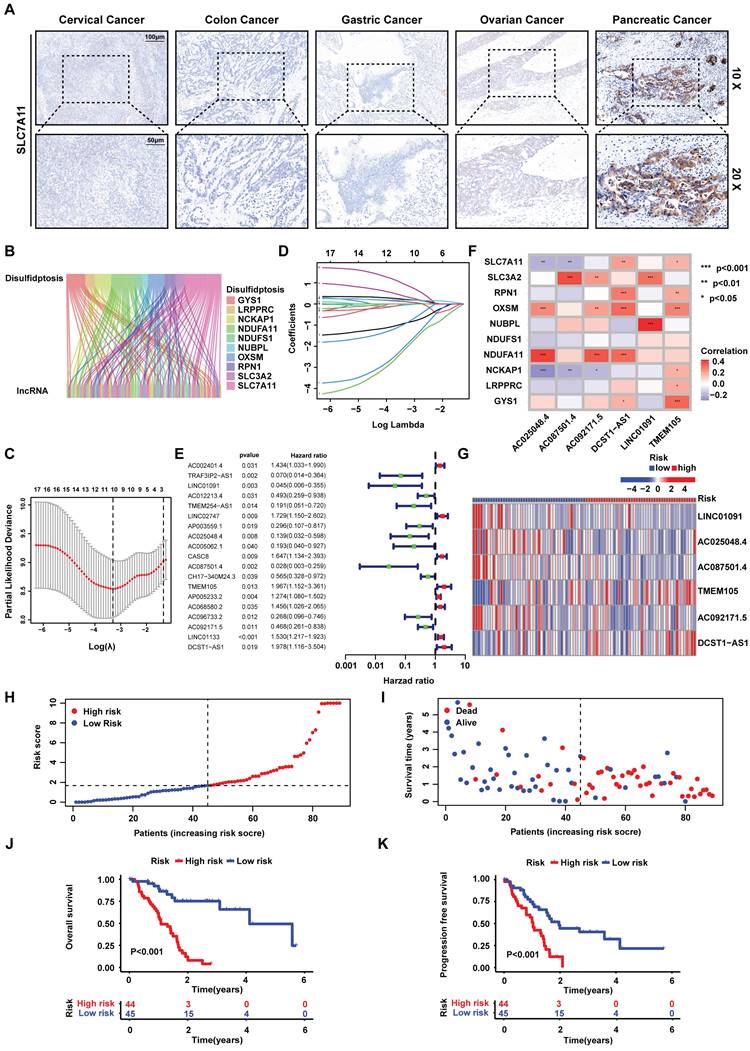
On the side, a total of 178 PCa patients were divided into training and testing groups. Univariate Cox regression was used to screen prognostic related lncRNAs in training cohort. Consequently, 19 lncRNAs (AC002401.4, TRAF3IP2-AS1, LINC01091, AC012213.4, TMEM254-AS1, LINC02747, AP003559.1, AC025048.4, AC005062.1, CASC8, AC087501.4, CH17-340M24.3, TMEM105, AP005233.2, AC068580.2, AC096733.2, AC092171.5, LINC01133 and DCST1-AS1) were achieved to construct risk signature by LASSO regression analysis (Figure 1C-E). Afterwards, six lncRNAs which (AC025048.4, AC087501.4, AC092171.5, DCST1-AS1, LINC01091 and TMEM105) affecting the prognosis independently were acquired by multivariate Cox regression, correlating with disulfidptosis-related genes closely (Pearson test) (Figure 1F). Inside, LINC01091, AC025048.4, AC087501.4, AC092171.5 and DCST1-AS1 were protective factors while TMEM105 was the only poor prognostic factors in the risk signature. Thus, a risk signature based on six disulfidptosis-related lncRNAs was then developed to predict the patients OS. The risk scores for all samples were calculated as the following formula: risk score = -3.7619 ×Exp (LINC01091) + -1.9756 ×Exp (AC025048.4) + -3.3182 ×Exp (AC087501.4) + 0.9454 ×Exp (TMEM105) + -1.8259 ×Exp (AC092171.5) + 1.8009 ×Exp (DCST1-AS1).
The training group was divided into high- and low- risk groups according to the median risk score. The correlation between the expression of 6 lncRNAs and every sample was depicted by the heatmap (Figure 1G). Moreover, the risk score was negatively correlated with the survival state (Figure 1H-I), while high-risk group presented worse OS and PFS compare to low-risk group (Figure 1J-K). Subsequently, through the univariate and multivariate Cox regression analysis, it was found that the risk signature could be deemed as independent risk factor to influence OS (P<0.001). To confirm the feasibility of risk signature, we checked it in testing group and entire cohort to reach the similar conclusion (Figure S1-6). We performed the PCA analysis of all genes, 10 disulfidptosis-related genes, 19 disulfidptosis-related lncRNAs and the risk signature (Figure S7). It was obvious that the risk signature could divide the samples into 2 groups perfectly.
High expression of TMEM105 predicts the poor prognosis in PCa
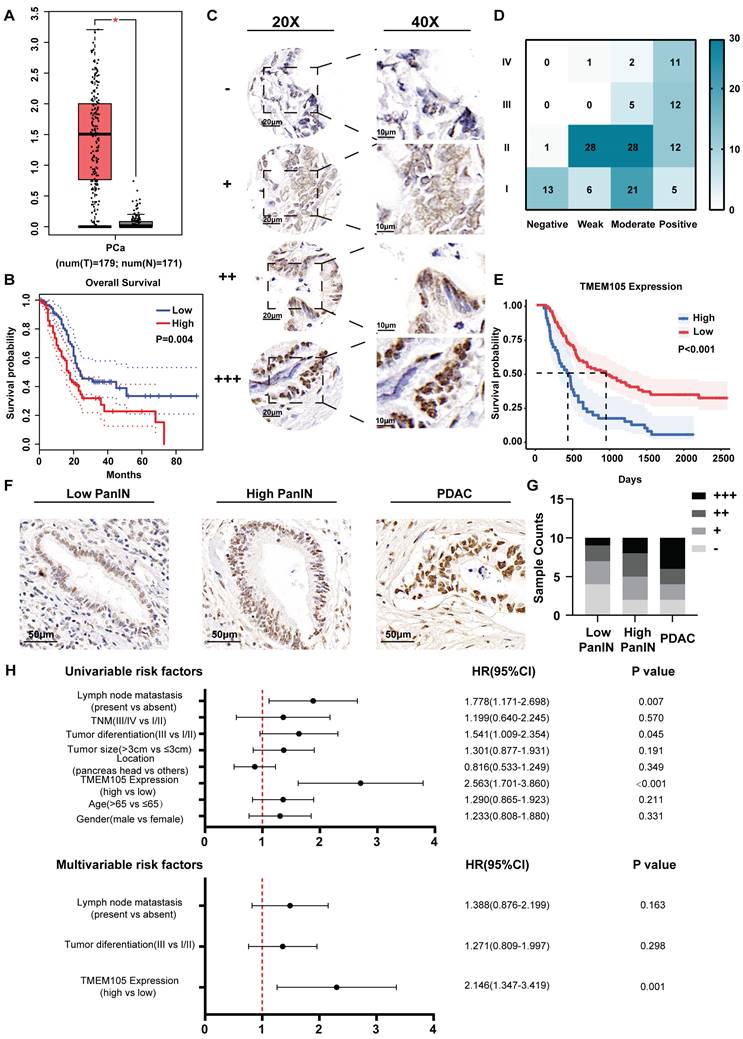
To further investigate the role of disulfidptosis-related lncRNAs in PCa, we initially conducted Gene Expression Profiling Interactive Analysis (GEPIA) [22]. It was found that there was significantly higher expression level of TMEM105 in PCa tumor tissues compared to adjacent normal tissues (Figure 2A). In consistant with the pro-tumoral effect predicted in the risk signature, high expression of TMEM105 also predicted a poor prognosis (Figure 2B). However, protective factors (LINC01091, AC025048.4, AC087501.4, AC092171.5) presented in the risk signature showed no significant differences in term of expression or prognosis in PCa. Consequently, TMEM105 was identified as the critical gene in this study to detect TMEM105 expression, 149 PCa as cases and their adjacent tissues in TMA were examined and scored (Figure 2C). It was found that TMEM105 was predominantly located in the nucleus of pancreatic cancer cells. Plus, TMEM105 showed higher expression in advanced stages of PCa compared to lower stage and correlated with poor prognosis (Figure 2D-E). Then, indicated number of ISH images was selected for statistical analysis (Figure 2F). As a result, the expression of TMEM105 was positively correlated with the pathological grade of PCa (Figure 2G). Subsequently, PCa samples in the Renji TMA were assigned into high- and low- expression groups based on TMEM105 expression. In the meantime, various clinical indicators were taken into consideration. Consequently, lymph node metastasis, tumor differentiation, and TMEM105 expression were identified to impact the prognosis of pancreatic cancer significantly by univariate COX regression analysis. Besides, multivariate COX regression analysis was also conducted while TMEM105 expression was confirmed as an independent risk factor influencing the prognosis of PCa (Figure 2H).
High expression of TMEM105 predicts a poor prognosis in PCa. (A) Expression profile of TMEM105 in TCGA database. (B) KM analysis of OS in patients with high or low TMEM105 expression by GEPIA. (C) Standard ISH grading images of TMEM105 expression in 149 pancreatic cancer tumors. Scale bar: 20x (20 μm) and 40x (10 μm) for negative (-), weak (+), moderate (++), and strong (+++) expressions. (D) Heatmap of correlation between TMEM105 expression and TNM stage based on ISH grading. (E) The KM analysis for the correlation between OS rate and TMEM105 expression based on the Renji cohort. (F) Representative standard ISH staining images of various stages of PCa progression in the Renji cohort, including PanIN (pancreatic intraepithelial neoplasia) and PDAC (pancreatic ductal adenocarcinoma); (scale bar: 50 μm). (G) Statistical analysis for ISH staining in different stages of PDAC, the grades were classified as negative (-), weakly positive (+), moderately positive (++), and strongly positive (+++). (H) Univariate and multivariate Cox regression analyses of clinical and pathological factors in the Renji cohort.
TMEM105 promotes PCa cells growth in vitro and in vivo
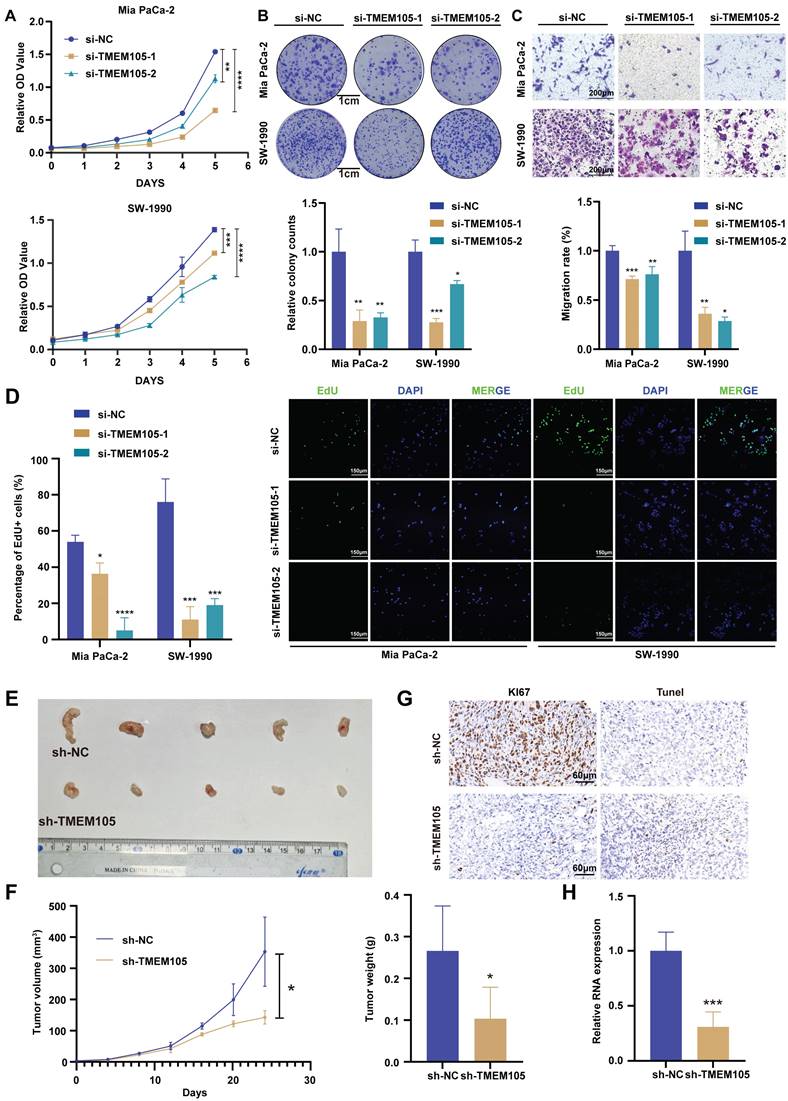
In order to verify the effect of TMEM105 on the proliferation and migration ability of PCa cells, CCK8, colony formation, EdU detection and transwell assays were performed. Mia CaPa-2 and SW1990, which expressed higher level of TMEM105, were selected to perform RNA interference (Figure S8-9). As a result, knockdown of TMEM105 significantly impaired cells viability and proliferation compared to control group (Figure 3A-B, D). Besides, the transwell assays revealed that knockdown of TMEM105 inhibited the cell migration (Figure 3C). Then, TMEM105 was overexpressed in PANC-1 and Patu8988 (Figure S10). As was expected, cell proliferation and migration were enhanced by TMEM105 overexpression (Figure S11-13). To investigate the impact of TMEM105 in PCa in vivo, shRNA lentiviruses were constructed to infect Mia PaCa-2 cells and stably downregulate the expression of TMEM105. Cells were then subcutaneously implanted into posterior axillary line of nude mice. After four weeks, the transplanted tumors were excised, and RNA was extracted from tumor tissue for knockdown validation efficiency (Figure 3H). It was revealed there was a significant reduction in term of both volume and weight of the tumor components following TMEM105 downregulation compared to the control group (Figure 3F). In addition, Ki-67 staining and TUNEL staining confirmed that TMEM105 knockdown inhibited pancreatic cancer cell proliferation and induced cell apoptosis in vivo (Figure 3G). Finally, in order to further invalidate the effect of TMEM105 on PCa progression in vivo, PDX models were constructed. TMEM105 were found stimulate the progression of PCa under the circumstance of PDX models (Figure S14). In conclusion, TMEM105 promotes the PCa progression both in vitro and in vivo.
TMEM105 promotes the growth of PCa both in vitro and in vivo. (A) Cell viability of TMEM105 knockdown Mia PaCa-2 and SW-1990 cells. (B) The colony formation assays of TMEM105 knockdown Mia PaCa-2 and SW-1990 cells and its analysis (scale bar: 1 cm). (C) Cell migration assay of TMEM105 knockdown Mia PaCa-2 and SW-1990 cells and its analysis (scale bar: 200 μm). (D) EdU staining of TMEM105 knockdown Mia PaCa-2 and SW-1990 cells and its analysis (scale bar: 150μm). (E) Tumor formation in subcutaneous tumors of the sh-NC and sh-TMEM105 Mia PaCa-2 cells. (F) Tumor growth curves and the weight comparation of the TMEM105 knockdown group and the control group in Mia PaCa-2 cells. (G) Ki67 staining and Tunel assays of the TMEM105 knockdown group and the control group in Mia PaCa-2 cells. (H) The expression of TMEM105 in TMEM105 knockdown group and the control group in Mia PaCa-2 cells. *p < 0.05, **p < 0.01, ***p < 0.001, ****p < 0.0001.
TMEM105 mitigates disulfidptosis induced by glucose deprivation in PCa
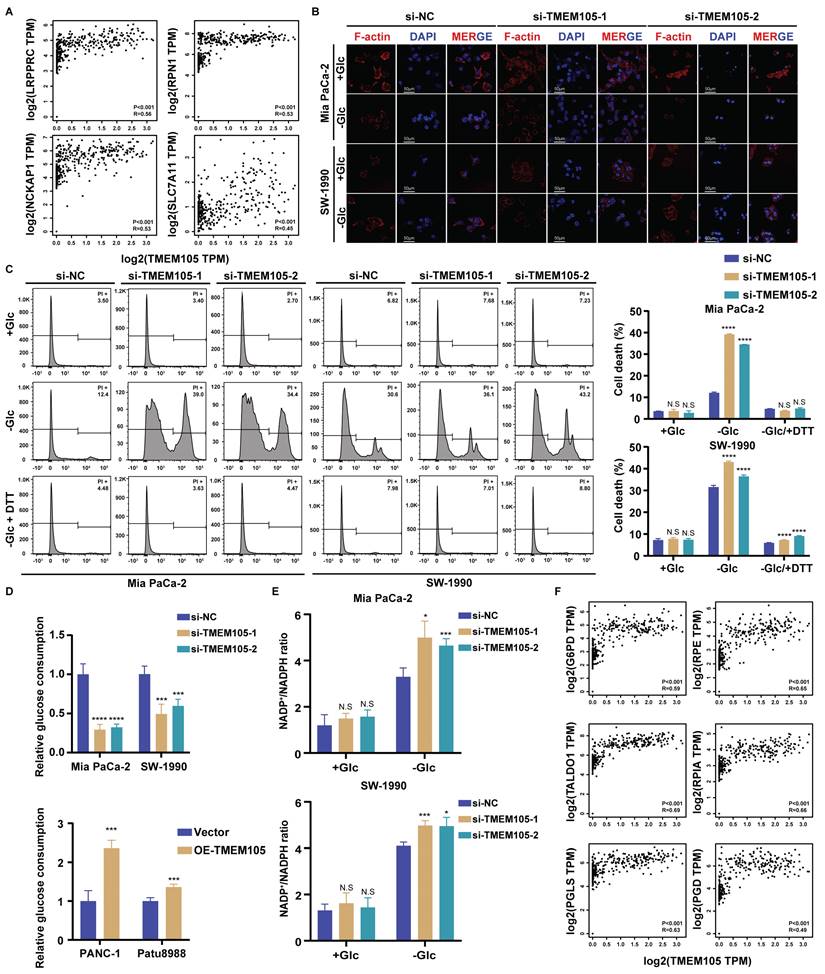
To verify whether TMEM105 was associated with disulfidptosis in PCa, we firstly analyzed the correlation between TMEM105 and disulfidptosis-related genes by GEPIA website based on TCGA and Genotype Tissue Expression (GTEx) database. The results demonstrated a strong correlation (Figure 4A and S15). Then PI staining was applied to detect the cell death. As was expected, there was no significant difference in term of cell death between si-TMEM105 and si-NC cells when cultured in glucose-containing medium. However, in glucose-free environment, knockdown of TMEM105 significantly augmented the cell death while TMEM105 overexpression restored the death rate. Furthermore, the application of disulfidptosis inhibitor DTT could also inhibit the death caused by glucose deprivation, confirming that this type of cell death is caused by TMEM105 mitigated disulfidptosis (Figure 4C and S16). Based on previous studies, inhibiting GLUT1 reduces cellular glucose uptake, thus leads to dysregulation of PPP and imbalance of NADP+/NADPH, resulting in collapse of the cell skeleton and ultimately disulfidptosis [9]. To further confirm that TMEM105 mitigated the cell death by disulfidptosis, cytoskeleton staining and NADP+/NADPH detection assays were conducted. As a result, the TMEM105 knockdown group exhibited more pronounced F-actin contraction and cell shrinkage in the glucose-free environment (Figure 4B). Subsequently, we detected the intracellular cellular glucose uptake and NADP+/NADPH ratio. It was found that in TMEM105 knockdown cells, the intracellular glucose levels decreased significantly (Figure 4D). In addition, downregulation of TMEM105 increased intracellular NADP+/NADPH ratio greatly in the glucose-free environment (Figure 4E). In consist with our expectation, the opposite results were observed in the TMEM105 overexpressed cells (Figure 4D and S17-18). Finally, the correlation analysis (GEPIA website based on TCGA and GTEx database) explained the mechanism of disulfidptosis -related PPP dysregulation (key genes in PPP was attained from previous study [23]) (Figure 4F and S19). In conclusion, TMEM105 regulates the cell skeleton, glucose uptake, ratio of NADP+/NADPH to ultimately mitigate disulfidptosis.
TMEM105 mitigates the PCa disulfidptosis. (A) The correlation between TMEM105 and disulfidptosis-related genes analyzed by GEPIA website based on TCGA and GTEx database. (B) F-actin staining of TMEM105 knockdown Mia PaCa-2 and SW-1990 cells maintained in glucose-free medium for 12 h (scale bar: 50 μm) (C) The TMEM105 knockdown Mia PaCa-2, SW-1990 cells were maintained in glucose-free medium with 0.25 mM DTT for 12 h and subjected to cell death staining. (D) The glucose consumption ability of the cells was evaluated in TMEM105 knockdown Mia PaCa-2, SW-1990 cells or TMEM105-overexpressing PANC-1, Patu8988 cells. (E) The TMEM105-knocking-down Mia PaCa-2 and SW-1990 cells were maintained in glucose-free medium for 12 h and subjected to NADP+/ NADPH detection. (F) The correlation between TMEM105 and PPP key genes analyzed by GEPIA website based on TCGA and GTEx database. *p < 0.05, **p < 0.01, ***p < 0.001, ****p < 0.0001.
GLUT1 is essential for the oncogenic roles of TMEM105 in PCa growth and disulfidptosis
Glucose transporter proteins (GLUT) constitute a protein family which is responsible for glucose transport. This family contains fourteen members including GLUT1 encoded by the SLC2A1 gene, which plays a significant role in the development of cancer. GLUT1 is highly expressed in various malignant tumors. Notably, its elevated expression in pancreatic cancer predicts a poor prognosis. GLUT1 is located in the cell membrane to facilitate glucose's entry into cells. Its biological function closely correlates with glucose metabolism, particularly glycolysis [24-27]. Previous studies have linked the occurrence of disulfidptosis to the accumulation of disulfides. This process derived from the reduction of NADP+/NADPH caused by inhibiting GLUT1 [9]. Thus, we speculated that TMEM105 may regulate the tumor progression and disulfidptosis in PCa through GLUT1. To verify this, 149 pancreatic cancer tissue samples, in consecutive sections, were subjected to IHC and ISH staining for detection of the TMEM105 and GLUT1 expression. Correlation analysis revealed a positive association between the expressions of TMEM105 and GLUT1 (Figure 5A). This positive correlation between TMEM105 and GLUT1 was also confirmed by GEPIA website (Figure 5B). In addition to that, the association was verified at GLUT1 protein level using WB and IF staining (Figure 5C-D). Besides, it was found that overexpression of TMEM105 resulted in increased proliferation and migration abilities of PANC-1 and Patu8988 cells, which were attenuated upon the addition of the GLUT1 inhibitor BAY-876 (Figure 5E and S20-21). Moreover, in the glucose-free environment, BAY-876 reversed the inhibited disulfidptosis caused by TMEM105 overexpression (Figure 5F-G).
GLUT1 is essential for the oncogenic roles of TMEM105 in PCa growth and disulfidptosis. (A) Staining and analyzing the correlation between TMEM105 and GLUT1 in consecutive sections of PCa tumor slide from Renji cohort (scale bar: 200 μm). (B) Correlation of TMEM105 with GLUT1 analyzed by GEPIA website based on TCGA and GTEx database. (C) WB analysis of GLUT1 and c-MYC in TMEM105 knockdown Mia-PaCa 2 and SW-1990 cells (si-1: si-TMEM105-1, si-2: si-TMEM105-2). (D) Fluorescence staining of GLUT1 expression in TMEM105 knockdown cells (scale bar: 200 μm). (E) Colony formation assay and transwell assays of TMEM105-overexpressing PANC-1 and Patu8988 cells treated with DMSO or 5 µM BAY-876 for 6 hours (scale bar: 1 cm, scale bar: 100 μm). (F) F-actin staining of TMEM105-overexpressing PANC-1 and Patu8988 cells treated with DMSO or 5µM BAY-876 for 6 h, followed by glucose-deprivation for 12 h (scale bar: 80 μm). (G) Cell death staining of TMEM105-overexpressing PANC-1 and Patu8988 cells treated with DMSO or 5µM BAY-876 for 6 h, followed by glucose-deprivation for 12 h. (H) Representative images of subcutaneous tumors of the TMEM105-overexpressing group and the control group after receiving BAY-876 treatment (BAY-876 3mg/kg, oral administration once a week for a total of 4 treatments). (I) The weight of subcutaneous tumors mentioned above. *p < 0.05, **p < 0.01, ***p < 0.001, ****p < 0.0001.
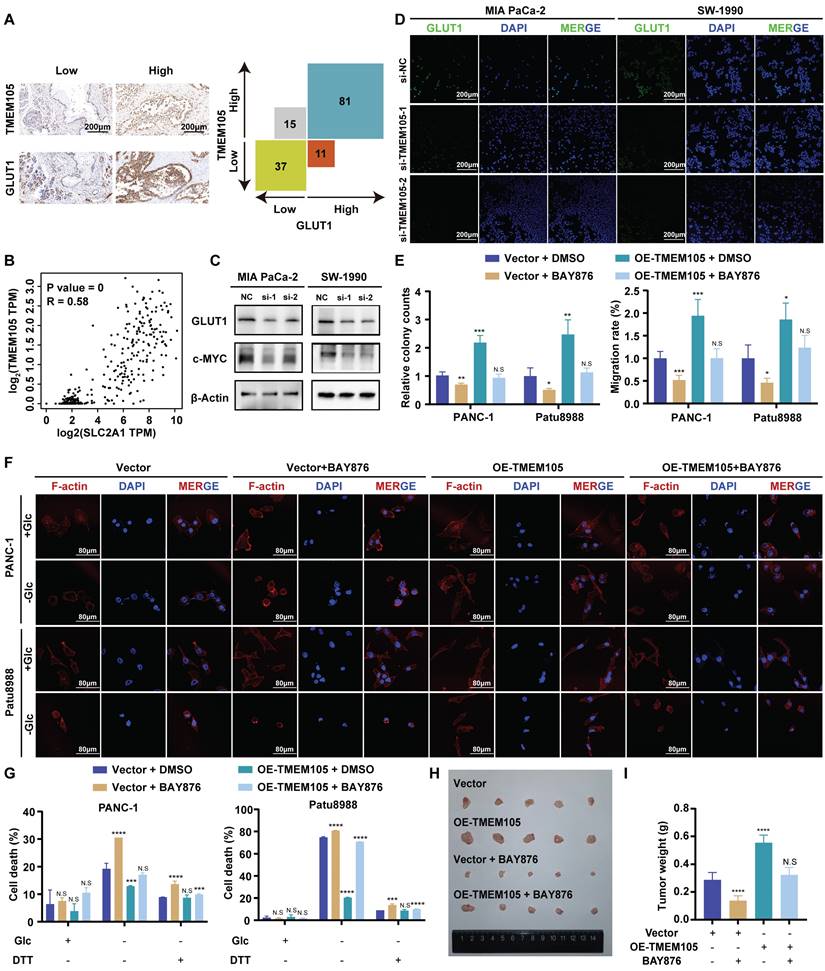
To further investigate the impact of TMEM105 on PCa progression in vivo, stable overexpressing Patu8988 cell lines were established and subcutaneously implanted into the posterior axillary line of nude mice, administered orally with or without BAY-876. After four weeks, the tumors were extracted. Intriguingly, oral administration of BAY-876 restored the augmentation of tumor weight and volume caused by TMEM105 overexpression (Figure 5H-I and S21). Additionally, Ki-67 staining and TUNEL assays respectively indicated that TMEM105 overexpression promoted tumor proliferation and inhibited tumor apoptosis, while inhibition of GLUT1 reversed this effect (Figure S22). In a word, GLUT1 is essential for the oncogenic roles of TMEM105 in PCa growth and disulfidptosis.
TMEM105 engages the glycolysis-related transcription factor c-MYC to induce GLUT1
To further explore the specific regulatory mechanism of TMEM105 regulating GLUT1 in PCa growth and disulfidptosis, GSEA analysis based on TCGA database was performed [28, 29]. Interestingly, we noticed that TMEM105 was significantly associated with the c-MYC pathway (Figure 6A). It is noteworthy that c-MYC is a glycolysis-related transcription factor which plays a vital role in transcriptionally regulating GLUT1 [30, 31]. Subsequently, to validate our speculation that the essential role of TMEM105 on GLUT1 is dependent on the glycolysis-related transcription factor c-MYC, cell lines with TMEM105 interference were established followed by overexpression of c-MYC (Figure 6B). As a result, the decreased proliferation (Figure 6C-D) and migration (Figure 6E) abilities of Mia CaPa-2 and SW-1990 cells brought by TMEM105 knockdown could be reversed by c-MYC overexpression. Furthermore, overexpression of c-MYC was found to inhibit disulfidptosis due to reduced TMEM105 levels in term of cell death (Figure 6F-G) and cell cytoskeleton (Figure 6H).
TMEM105 engages the glycolysis-related transcription factor c-Myc to induce GLUT1. (A) GSEA enrichment analysis of TMEM105 based on the TCGA database. (B) WB analysis of c-MYC in TMEM105-knockdown-c-MYC-overexpressing Mia PaCa-2 and SW-1990 cells (si-1: si-TMEM105-1). (C) The cell viability assay of TMEM105-knockdown-c-MYC-overexpressing Mia PaCa-2 and SW-1990 cells. (D) The colony formation assays of TMEM105-knockdown-c-MYC-overexpressing Mia PaCa-2 and SW-1990 cells (scale bar: 1 cm). (E) The transwell assays of TMEM105-knockdown-c-MYC-overexpressing Mia PaCa-2 and SW-1990 cells (scale bar: 100 μm). (F, G) Cell death staining of TMEM105-knockdown-c-Myc-overexpressing Mia PaCa-2 and SW-1990 cells maintained in glucose-free medium for 12h. (H) The F-actin staining of TMEM105-knockdown-c-Myc-overexpressing Mia PaCa-2 and SW-1990 cells maintained in glucose-free medium for 12h (scale bar: 40 μm). *p < 0.05, **p < 0.01, ***p < 0.001, ****p < 0.0001.
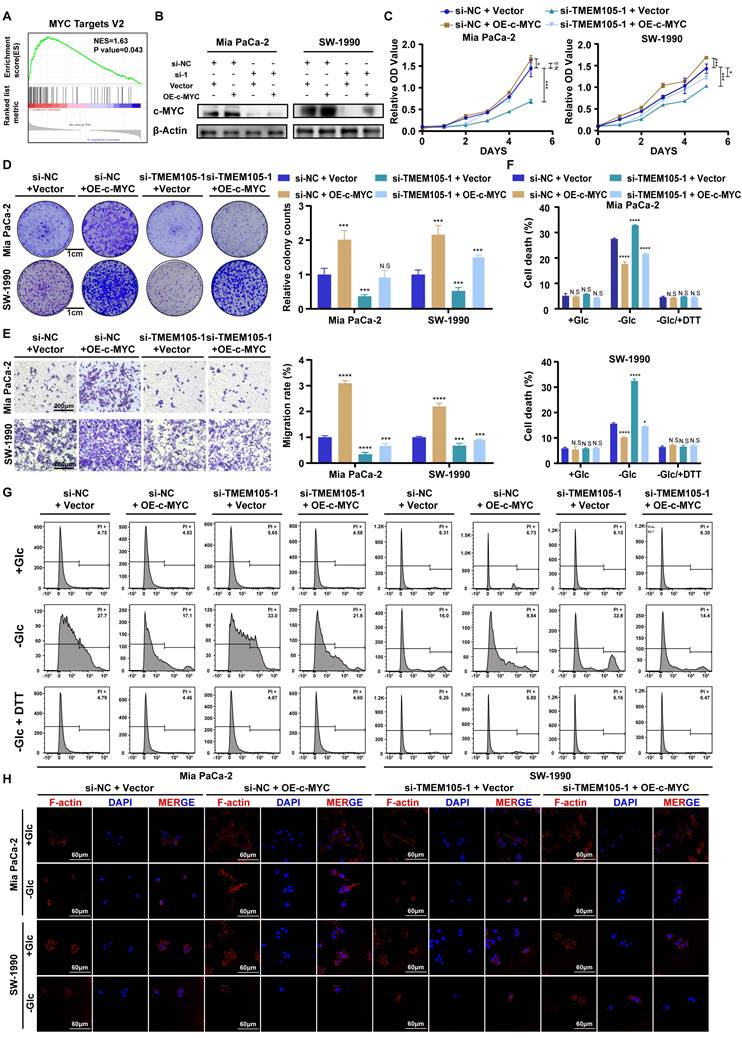
In conclusion, TMEM105 engages the glycolysis-related transcription factor c-Myc to induce GLUT1.
TMEM105 maintains the stability of β-catenin to enhance c-MYC expression
To further explore the mechanism, the cell cytoplasm and nucleus were separated. It was observed that TMEM105 (Figure 7A) located in the nucleus, which was consistant with the results of ISH staining (Figure 2C). Then, RNA pull-down was employed and the distinct protein bands were analyzed through LC-MS/MS. However, the interaction between TMEM105 and c-MYC was not observed, which indicated that the regulation of c-MYC by TMEM105 is indirect. Thus, we screened the proteins interacted with TMEM105 and finally narrowed down to β-catenin, which was reported to interacted with c-MYC directly (Figure 7B) [32-34]. β-catenin, a key intracellular signaling protein expressed in various cell compartments, plays a fundamental role in regulating cell proliferation, differentiation, and migration [35, 36]. It was reported that aberrant activation of β-catenin is closely associated with pancreatic cancer progression (Figure S23) [37].
Reduced TMEM105 inhibited tumor progression and enhanced disulfidptosis by β-catenin in pancreatic cancer. (A) qRT-PCR analysis of the subcellular distribution of TMEM105, with U6 as a nuclear marker and ACTB as a cytoplasmic marker. (B) Protein silver staining image after biotin-labeled RNA pulldown experiment. (C) RNA-pulldown assays to validate the interaction between TMEM105 and β-catenin. (D) WB analysis of β-catenin in TMEM105-knocking-down cells. (E) qRT-PCR of β-catenin in TMEM105 knockdown Mia PaCa-2 and SW-1990 cells at the RNA level. (F) WB analysis of TMEM105 knockdown Mia PaCa-2 and SW-1990 cells treated with 20 μg/mL CHX at indicated time or 10 μM MG132 for 6 h. (G) The cell viability assay of TMEM105-knockdown-SKL2001-treated Mia PaCa-2 and SW-1990 cells. (H) The colony formation assays of TMEM105-knockdown-SKL2001-treated Mia PaCa-2 and SW-1990 cells. (I) The transwell assays of TMEM105-knockdown-SKL2001-treated Mia PaCa-2 and SW-1990 cells. (J) Cell death staining of TMEM105-knockdown-SKL2001-treated Mia PaCa-2 and SW-1990 cells maintained in glucose-free medium for 12h. (K) F-actin staining of TMEM105-knockdown-SKL2001-treated Mia PaCa-2 and SW-1990 cells maintained in glucose-free medium for 12h (scale bar: 40 μm). (L) Representative ISH, CT, and PET-CT images of TMEM105 low- and high-expression groups in 14 patients with pancreatic cancer from Renji Hospital, the relationship between TMEM105 expression and SUV-Max was analyzed. (M) Statistical analysis of SUV-max values in 14 patients with pancreatic cancer from Renji Hospital. *p < 0.05, **p < 0.01, ***p < 0.001, ****p < 0.0001.
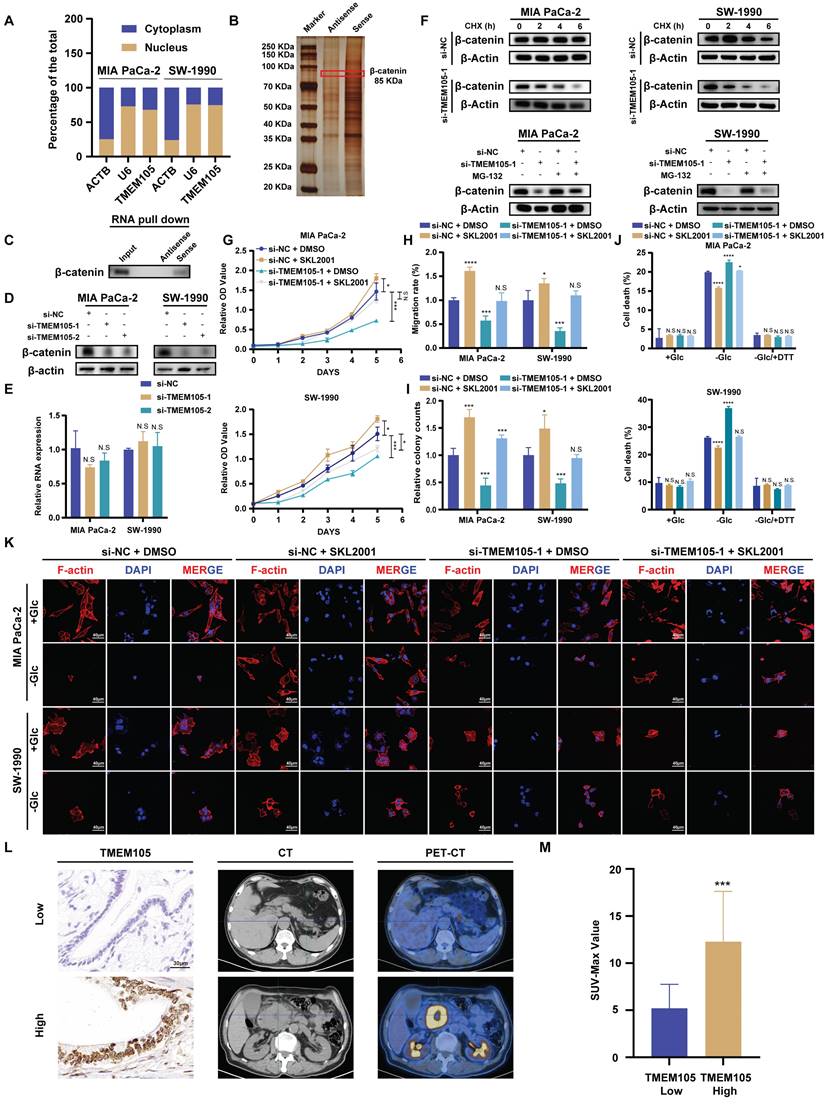
Notably, β-catenin-c-MYC signaling pathway is crucial in pancreatic cancer metabolism, especially in the regulation of glucose metabolism [38-40]. To verify this, WB analysis was performed after incubating biotin-labeled TMEM105 sense and antisense RNA products and confirmed the direct interaction of TMEM105 and β-catenin (Figure 7C). LncRNAs are commonly reported to regulate the stability of binding proteins [41-43]. Hence, we hypothesized that TMEM105 may exert its regulatory effects on pancreatic cancer progression and disulfidptosis through interacting with β-catenin. Importantly, it was noticed that the protein levels of β-catenin significantly decreased after TMEM105 knocking down (Figure 7D), while the mRNA levels of β-catenin remained unaffected (Figure 7E). The results above suggested that the regulatory role of TMEM105 on β-catenin occurred at the translational or post-translational level. Cycloheximide (CHX) is frequently used to assess protein half-life and stability [44]. Therefore, to validate the assumption of TMEM105 regulating β-catenin protein stability, CHX was added to Mia CaPa-2 and SW-1990 cells for WB analysis. It was showed a significant reduction in the half-life of β-catenin after downregulation of TMEM105. Subsequently, to elucidate how TMEM105 maintains β-catenin protein stability, proteasome inhibitor MG132 was introduced to Mia CaPa-2 and SW-1990 cells. The inhibitor eliminated the alteration of β-catenin expression caused by the loss of TMEM105 functionality (Figure 7F). Collectively, these findings suggest that TMEM105 maintains the protein stability of β-catenin by the proteasome pathway. Additionally, GEPIA analysis based on TCGA database verified the correlation between β-catenin and TMEM105. Furthermore, the upregulated β-catenin increased the expression of c-MYC (Figure S24-25). In conclusion, TMEM105 maintains the stability of β-catenin by the proteasome pathway to enhance c-MYC expression.
TMEM105 interacts with β-catenin in PCa
To further demonstrate the role of TMEM105 in regulating pancreatic cancer growth and disulfidptosis through β-catenin, Mia PaCa-2 and SW-1990 were treated with β-catenin activator SKL2001 (20μM) after TMEM105 knockdown. Through CCK-8 and colony formation assays, it was indicated that SKL2001 restored the suppressed proliferative capacity caused by TMEM105 knockdown (Figure 7G-H and S26). Besides, the cell migration capability of TMEM105 interfered cell lines was also enhanced with the treatment of SKL2001 through transwell assays (Figure 7I and S27). These findings suggested that TMEM105 stimulated the proliferation and metastasis of pancreatic cancer via β-catenin pathway. Moreover, SKL2001 was found to reverse the contraction of F-actin and the shrinkage of the cell cytoskeleton in the glucose-free environment induced by TMEM105 knockdown (Figure 7K). More importantly, SKL2001 also reduced cell death in the glucose-free environment resulting from downregulation of TMEM105 (Figure 7J). Take it to conclude, TMEM105 mitigates the pancreatic cancer disulfidptosis through combining with β-catenin.
In conclusion, TMEM105 regulates pancreatic cancer growth and disulfidptosis through β-catenin.
Validation of TMEM105-β-catenin-c-MYC-GLUT1 pathway in clinical settings
2-Fluoro-18-fluoro-2-deoxy-D-glucose (18F-FDG) is an analogue of glucose. After intravenous injection of 18F-FDG, it can be transported into cells via glucose transporters. Compared to normal tissues, tumors exhibit increased glucose metabolism. Therefore, in clinical, 18F-FDG is commonly used as a tracer in PET-CT scans to assess tumor progression [45-47]. To further validate that TMEM105 regulated pancreatic cancer growth and disulfidptosis through the β-catenin-c-MYC-GLUT1 pathway, tissue samples from pancreatic cancer patients with PET-CT information were utilized. The samples in consecutive sections were subjected to ISH and IHC staining to examine the correlation between the TMEM105-β-catenin-c-MYC-GLUT1 axis and glucose metabolism. As was shown, the expression of TMEM105 was positively correlated with the standard uptake value (SUV-Max) on the corresponding PET-CT scans of the patients (Figure 7L). Additionally, in cases with high TMEM105 expression, both c-MYC and GLUT1 were also highly expressed (Figure S28). In summary, clinical samples from PCa patients containing PET-CT information further confirm the role of TMEM105 in regulating PCa progression and disulfidptosis through the β-catenin-c-MYC-GLUT1 pathway.
Discussion
PCa is one of the most malignant tumors globally. In recent years, despite some progress in screening and treatment of PCa, it is still challenging to accurately identify and screen high-risk populations. The effectiveness of treatments such as surgery and chemotherapy are also not satisfactory. Hence, identifying biomarkers to predict PCa prognosis in conjunction with targeted therapy presents as a problem to be solved. Different from apoptosis and ferroptosis, disulfidptosis is a novel type of cell death and cannot be suppressed by conventional cell death inhibitors. The characteristic of disulfidptosis includes the massive uptake of cysteine, glucose starvation, and depletion of NADPH, with the most important being the accumulation of intracellular disulfide bond molecules. In glucose-deprived cancer cells, the high uptake of cysteine and inadequate NADPH supply jointly contribute to abnormal accumulation of disulfide bond compounds, which bind with actin cytoskeletal proteins, ultimately causing the collapse of the actin cytoskeleton network and cell death. Therefore, investigating disulfidptosis in PCa can provide further insights into the molecular mechanisms during development of cancer. Undoubtedly, targeting this unique form of cell death may become a potential molecular marker for screening and treating PCa.
In this study, we utilized bioinformatics analysis to develop a risk signature consisting of six lncRNAs associated with disulfidptosis for predicting the prognosis of PCa. Through analysis of expression and prognosis significance of PCa by GEPIA database and PCa samples from Renji Hospital, we identified the critical gene TMEM105. TMEM105 was a lncRNA that plays a role in promoting breast cancer growth and metastasis by regulating tumor glycolysis function in breast cancer liver metastasis [13]. It served as a cell cycle-related lncRNA for predicting progression-free survival time in thyroid papillary carcinoma,[14] and as an ferroptosis- and immune-related lncRNA for predicting patient prognosis in breast infiltrating duct and lobular carcinoma [15]. TMEM105 was also believed to play a crucial role in coronary artery disease [16]. In this study, TMEM105 was found to promote pancreatic cancer progression in vivo and in vitro, and mitigate disulfidptosis of PCa in vitro. However, its exact function in PCa has not been unveiled.
Targeting GLUT1 has been shown to significantly inhibit pancreatic cancer progression [25, 48]. Previous research has linked the occurrence of disulfidptosis to the increase of NADP+/NADPH resulting from GLUT1 inhibition,[9] which was also confirmed in this study. In our research, GSEA enrichment analysis was performed to find out the notable association of TMEM105 with c-MYC pathway. It was found that there was a significant positive correlation between c-MYC expression and TMEM105. In addition, the impact of TMEM105 on GLUT1 was dependent on c-MYC through interacting with β-catenin. As is reported, β-catenin-c-MYC signaling pathway participates in regulating various cellular functions in tumors. For example, in colorectal cancer, CD36 promoted GPC4 ubiquitination via proteasome-dependent pathway and exerts inhibitory effects on glycolysis through the β-catenin-c-MYC signaling pathway [49]. MUC5AC intensified glutamine utilization and nucleotide biosynthesis through the β-catenin-c-MYC pathway, thus enhancing pancreatic cancer resistance to gemcitabine [38]. Combined chemotherapy with niclosamide and gemcitabine induced β-catenin ubiquitination, consequently downregulated the β-catenin-c-MYC signaling pathway to inhibit pancreatic cancer progression [39]. In this experiment, stimulating β-catenin in TMEM105-knockdown cells led to the suppression of disulfidptosis and the restoration of proliferation and metastatic capabilities of pancreatic cancer cells. However, this study also has some limitations. Firstly, a logical in vivo validation model for disulfidptosis was not provided and established. Secondly, the specific regulatory mechanism of TMEM105 on the downstream β-catenin-c-MYC-GLUT1 signaling axis needs further elucidation.
In summary, this study reveals that TMEM105 is highly expressed in PCa and indicates poor prognosis. It exerts its regulatory effects on the progression of pancreatic cancer and disulfidptosis through the β-catenin-c-MYC-GLUT1 signaling axis. This study has confirmed TMEM105 mitigates disulfidptosis in PCa for the first time, and has elucidated the potential mechanism in regulating disulfidptosis.
Supplementary Material
Supplementary figures.
Competing Interests
The authors have declared that no competing interest exists.
References
1. Guo X, Cui Z. Current diagnosis and treatment of pancreatic cancer in China. Pancreas. 2005;31:13-22
2. Siegel RL, Miller KD, Fuchs HE, Jemal A. Cancer Statistics, 2021. CA Cancer J Clin. 2021;71:7-33
3. Makohon-Moore A, Iacobuzio-Donahue CA. Pancreatic cancer biology and genetics from an evolutionary perspective. Nat Rev Cancer. 2016;16:553-65
4. Traub B, Link KH, Kornmann M. Curing pancreatic cancer. Semin Cancer Biol. 2021;76:232-46
5. Zhang S, Yao HF, Li H, Su T, Jiang SH, Wang H. et al. Transglutaminases are oncogenic biomarkers in human cancers and therapeutic targeting of TGM2 blocks chemoresistance and macrophage infiltration in pancreatic cancer. Cell Oncol (Dordr). 2023;46:1473-92
6. Hanahan D. Hallmarks of Cancer: New Dimensions. Cancer Discov. 2022;12:31-46
7. Peng F, Liao M, Qin R, Zhu S, Peng C, Fu L. et al. Regulated cell death (RCD) in cancer: key pathways and targeted therapies. Signal Transduct Target Ther. 2022;7:286
8. Wong RS. Apoptosis in cancer: from pathogenesis to treatment. J Exp Clin Cancer Res. 2011;30:87
9. Liu X, Nie L, Zhang Y, Yan Y, Wang C, Colic M. et al. Actin cytoskeleton vulnerability to disulfide stress mediates disulfidptosis. Nat Cell Biol. 2023;25:404-14
10. Liu B, Sun L, Liu Q, Gong C, Yao Y, Lv X. et al. A cytoplasmic NF-κB interacting long noncoding RNA blocks IκB phosphorylation and suppresses breast cancer metastasis. Cancer Cell. 2015;27:370-81
11. Blank-Giwojna A, Postepska-Igielska A, Grummt I. lncRNA KHPS1 Activates a Poised Enhancer by Triplex-Dependent Recruitment of Epigenomic Regulators. Cell Rep. 2019;26:2904-15.e4
12. Statello L, Guo CJ, Chen LL, Huarte M. Gene regulation by long non-coding RNAs and its biological functions. Nat Rev Mol Cell Biol. 2021;22:96-118
13. Han J, Chen X, Wang J, Liu B. Glycolysis-related lncRNA TMEM105 upregulates LDHA to facilitate breast cancer liver metastasis via sponging miR-1208. Cell Death Dis. 2023;14:80
14. Li S, Ran MY, Qiao H. A cell cycle-related lncRNA signature predicts the progression-free interval in papillary thyroid carcinoma. Front Endocrinol (Lausanne). 2023;14:1110987
15. Wei T, Zhu N, Jiang W, Xing XL. Development and Validation of Ferroptosis- and Immune-Related lncRNAs Signatures for Breast Infiltrating Duct and Lobular Carcinoma. Front Oncol. 2022;12:844642
16. Gong J, Qiu C, Huang D, Zhang Y, Yu S, Zeng C. Integrative functional analysis of super enhancer SNPs for coronary artery disease. J Hum Genet. 2018;63:627-38
17. Yao H, Liu P, Yao L, Li X. Establishment of disulfidptosis-related LncRNA signature as biomarkers in colon adenocarcinoma. Cancer Cell Int. 2024;24:183
18. Yang J, Liu DJ, Zheng JH, He RZ, Xu DP, Yang MW. et al. IRAK2-NF-κB signaling promotes glycolysis-dependent tumor growth in pancreatic cancer. Cell Oncol (Dordr). 2022;45:367-79
19. Yao HF, Xu DP, Zheng JH, Xu Y, Jia QY, Zhu YH. et al. Analysis of cuproptosis-related lncRNA signature for predicting prognosis and tumor immune microenvironment in pancreatic cancer. Apoptosis. 2023;28:1090-112
20. Jia Q, Zhu Y, Yao H, Yin Y, Duan Z, Zheng J. et al. Oncogenic GALNT5 confers FOLFIRINOX resistance via activating the MYH9/ NOTCH/ DDR axis in pancreatic ductal adenocarcinoma. Cell Death Dis. 2024;15:767
21. Zhu YH, Jia QY, Yao HF, Duan ZH, Ma XS, Zheng JH. et al. The lncRNA LINC01605 promotes the progression of pancreatic ductal adenocarcinoma by activating the mTOR signaling pathway. Cancer Cell Int. 2024;24:262
22. Tang Z, Li C, Kang B, Gao G, Li C, Zhang Z. GEPIA: a web server for cancer and normal gene expression profiling and interactive analyses. Nucleic Acids Res. 2017;45:W98-w102
23. Shigeta K, Hasegawa M, Hishiki T, Naito Y, Baba Y, Mikami S. et al. IDH2 stabilizes HIF-1α-induced metabolic reprogramming and promotes chemoresistance in urothelial cancer. Embo j. 2023;42:e110620
24. Montel-Hagen A, Kinet S, Manel N, Mongellaz C, Prohaska R, Battini JL. et al. Erythrocyte Glut1 triggers dehydroascorbic acid uptake in mammals unable to synthesize vitamin C. Cell. 2008;132:1039-48
25. Cai K, Chen S, Zhu C, Li L, Yu C, He Z. et al. FOXD1 facilitates pancreatic cancer cell proliferation, invasion, and metastasis by regulating GLUT1-mediated aerobic glycolysis. Cell Death Dis. 2022;13:765
26. Zhu YH, Zheng JH, Jia QY, Duan ZH, Yao HF, Yang J. et al. Immunosuppression, immune escape, and immunotherapy in pancreatic cancer: focused on the tumor microenvironment. Cell Oncol (Dordr). 2023;46:17-48
27. Chen PC, Ning Y, Li H, Su JG, Shen JB, Feng QC. et al. Targeting ONECUT3 blocks glycolytic metabolism and potentiates anti-PD-1 therapy in pancreatic cancer. Cell Oncol (Dordr). 2024;47:81-96
28. Subramanian A, Tamayo P, Mootha VK, Mukherjee S, Ebert BL, Gillette MA. et al. Gene set enrichment analysis: a knowledge-based approach for interpreting genome-wide expression profiles. Proc Natl Acad Sci U S A. 2005;102:15545-50
29. Mootha VK, Lindgren CM, Eriksson KF, Subramanian A, Sihag S, Lehar J. et al. PGC-1alpha-responsive genes involved in oxidative phosphorylation are coordinately downregulated in human diabetes. Nat Genet. 2003;34:267-73
30. Liang J, Cao R, Zhang Y, Xia Y, Zheng Y, Li X. et al. PKM2 dephosphorylation by Cdc25A promotes the Warburg effect and tumorigenesis. Nat Commun. 2016;7:12431
31. Jing Z, Liu Q, He X, Jia Z, Xu Z, Yang B. et al. NCAPD3 enhances Warburg effect through c-myc and E2F1 and promotes the occurrence and progression of colorectal cancer. J Exp Clin Cancer Res. 2022;41:198
32. Niehrs C. The complex world of WNT receptor signalling. Nat Rev Mol Cell Biol. 2012;13:767-79
33. MacDonald BT, Tamai K, He X. Wnt/beta-catenin signaling: components, mechanisms, and diseases. Dev Cell. 2009;17:9-26
34. Clevers H, Nusse R. Wnt/β-catenin signaling and disease. Cell. 2012;149:1192-205
35. Liu J, Xiao Q, Xiao J, Niu C, Li Y, Zhang X. et al. Wnt/β-catenin signalling: function, biological mechanisms, and therapeutic opportunities. Signal Transduct Target Ther. 2022;7:3
36. Yu F, Yu C, Li F, Zuo Y, Wang Y, Yao L. et al. Wnt/β-catenin signaling in cancers and targeted therapies. Signal Transduct Target Ther. 2021;6:307
37. Zhou C, Zhu X, Liu N, Dong X, Zhang X, Huang H. et al. B-lymphoid tyrosine kinase-mediated FAM83A phosphorylation elevates pancreatic tumorigenesis through interacting with β-catenin. Signal Transduct Target Ther. 2023;8:66
38. Ganguly K, Bhatia R, Rauth S, Kisling A, Atri P, Thompson C. et al. Mucin 5AC Serves as the Nexus for β-Catenin/c-Myc Interplay to Promote Glutamine Dependency During Pancreatic Cancer Chemoresistance. Gastroenterology. 2022;162:253-68.e13
39. Kang HW, Kim JH, Lee DE, Lee YS, Kim MJ, Kim HS. et al. Combination therapy of niclosamide with gemcitabine inhibited cell proliferation and apoptosis via Wnt/β-catenin/c-Myc signaling pathway by inducing β-catenin ubiquitination in pancreatic cancer. Cancer Biol Ther. 2023;24:2272334
40. Yang X, Shao F, Guo D, Wang W, Wang J, Zhu R. et al. WNT/β-catenin-suppressed FTO expression increases m(6)A of c-Myc mRNA to promote tumor cell glycolysis and tumorigenesis. Cell Death Dis. 2021;12:462
41. Yang F, Huo XS, Yuan SX, Zhang L, Zhou WP, Wang F. et al. Repression of the long noncoding RNA-LET by histone deacetylase 3 contributes to hypoxia-mediated metastasis. Mol Cell. 2013;49:1083-96
42. Yang F, Zhang H, Mei Y, Wu M. Reciprocal regulation of HIF-1α and lincRNA-p21 modulates the Warburg effect. Mol Cell. 2014;53:88-100
43. Hu X, Feng Y, Zhang D, Zhao SD, Hu Z, Greshock J. et al. A functional genomic approach identifies FAL1 as an oncogenic long noncoding RNA that associates with BMI1 and represses p21 expression in cancer. Cancer Cell. 2014;26:344-57
44. Xie Y, Burcu M, Linn DE, Qiu Y, Baer MR. Pim-1 kinase protects P-glycoprotein from degradation and enables its glycosylation and cell surface expression. Mol Pharmacol. 2010;78:310-8
45. Ben-Haim S, Ell P. 18F-FDG PET and PET/CT in the evaluation of cancer treatment response. J Nucl Med. 2009;50:88-99
46. Pimiento JM, Davis-Yadley AH, Kim RD, Chen DT, Eikman EA, Berman CG. et al. Metabolic Activity by 18F-FDG-PET/CT Is Prognostic for Stage I and II Pancreatic Cancer. Clin Nucl Med. 2016;41:177-81
47. Wang YY, Zhou YQ, Xie JX, Zhang X, Wang SC, Li Q. et al. MAOA suppresses the growth of gastric cancer by interacting with NDRG1 and regulating the Warburg effect through the PI3K/AKT/mTOR pathway. Cell Oncol (Dordr). 2023;46:1429-44
48. Zhang Z, Li X, Yang F, Chen C, Liu P, Ren Y. et al. DHHC9-mediated GLUT1 S-palmitoylation promotes glioblastoma glycolysis and tumorigenesis. Nat Commun. 2021;12:5872
49. Fang Y, Shen ZY, Zhan YZ, Feng XC, Chen KL, Li YS. et al. CD36 inhibits β-catenin/c-myc-mediated glycolysis through ubiquitination of GPC4 to repress colorectal tumorigenesis. Nat Commun. 2019;10:3981
Author contact
![]() Corresponding authors: huoyanmiaocom; yangmw90com; sugliuwei2004com.
Corresponding authors: huoyanmiaocom; yangmw90com; sugliuwei2004com.