Impact Factor ISSN: 1449-2288
- Issue 12; 2026
- Issue 11; 2026
- Issue 10; 2026
- Issue 9; 2026
- Issue 8; 2026
- Volume 22; 2026
- Past Issues
- Advance Articles
- Editorial Board
- Cover Images
- Index & Coverage
- Cover Suggestion
- Special Issues
Introduction
Materials and Methods
Results
Discussion
Supplementary Material
Acknowledgements
References

 Global reach, higher impact
Int J Biol Sci 2011; 7(1):18-27. doi:10.7150/ijbs.7.18 This issue Cite
Research Paper
A Global View of 54,001 Single Nucleotide Polymorphisms (SNPs) on the Illumina BovineSNP50 BeadChip and Their Transferability to Water Buffalo
Vanessa N. Michelizzi1, Xiaolin Wu2, Michael V. Dodson1, Jennifer J. Michal1, Jorge Zambrano-Varon3, Derek J. McLean1, Zhihua Jiang1 ![]()
1. Department of Animal Sciences, Washington State University, Pullman, WA 99164-6351, USA;
2. Department of Dairy Science, University of Wisconsin-Madison, Madison, WI 53706-1284, USA;
3. Facultad de Medicina Veterinaria y de Zootecnia, Universidad Nacional de Colombia, Bogotá D.C., Colombia
Received 2010-12-3; Accepted 2010-12-25; Published 2010-12-30
Abstract
The Illumina BovineSNP50 BeadChip features 54,001 informative single nucleotide polymorphisms (SNPs) that uniformly span the entire bovine genome. Among them, 52,255 SNPs have locations assigned in the current genome assembly (Btau_4.0), including 19,294 (37%) intragenic SNPs (i.e., located within genes) and 32,961 (63%) intergenic SNPs (i.e., located between genes). While the SNPs represented on the Illumina Bovine50K BeadChip are evenly distributed along each bovine chromosome, there are over 14,000 genes that have no SNPs placed on the current BeadChip. Kernel density estimation, a non-parametric method, was used in the present study to identify SNP-poor and SNP-rich regions on each bovine chromosome. With bandwidth = 0.05 Mb, we observed that most regions have SNP densities within 2 standard deviations of the chromosome SNP density mean. The SNP density on chromosome X was the most dynamic, with more than 30 SNP-rich regions and at least 20 regions with no SNPs. Genotyping ten water buffalo using the Illumina BovineSNP50 BeadChip revealed that 41,870 of the 54,001 SNPs are fully scored on all ten water buffalo, but 6,771 SNPs are partially scored on one to nine animals. Both fully scored and partially/no scored SNPs are clearly clustered with various sizes on each chromosome. However, among 43,687 bovine SNPs that were successfully genotyped on nine and ten water buffalo, only 1,159 were polymorphic in the species. These results indicate that the SNPs sites, but not the polymorphisms, are conserved between two species. Overall, our present study provides a solid foundation to further characterize the SNP evolutionary process, thus improving understanding of within- and between-species biodiversity, phylogenetics and adaption to environmental changes.
Keywords: SNPs, kernel density plots, call frequency plots, cross species transferability, evolutionary process
Introduction
Like other mammals, cattle possess a large amount of single nucleotide polymorphisms (SNPs) in their genome. The current NCBI dbSNP collection contains more than 2.2 million bovine SNPs (http://www.ncbi.nlm.nih.gov/projects/genome/guide/cow/). Among them, ~2.1 million SNPs were contributed by the Baylor College of Medicine on behalf of the Bos taurus sequencing project using a single breed, Hereford cattle. The same team also provided an additional 114,958 SNPs discovered by comparing random shotgun reads from individuals of six diverse cattle breeds to the Hereford genome assembly. Based on 126,800 BAC (bacterial artificial chromosome)-end sequences and 1,091,070 BAC shotgun reads released by the ENCODE project [1] and the Bovine HapMap project [2], Matukumalli and colleagues [3] identified 89,832 unique putative SNPs for cattle. Expressed sequence tags (ESTs) derived from different sources of samples were also used to mine putative SNPs representing coding regions of the bovine genome [4]. In order to further enhance broad discovery of SNPs for wide utility, Van Tassell and colleagues [5] developed a deep sequencing approach on reduced representation libraries derived from different target populations. The approach relies on next generation sequencing, which was performed on an Illumina Genome Analyzer. Using DNA samples of 66 cattle representing three populations, the authors produced nearly 50 million sequences, which identified 62,042 putative SNPs and estimated their allele frequencies in cattle.
All of these publicly available SNP data made it possible for the Illumina scientists and collaborators to develop an informative and high-density SNP genotyping microarray for community use [3]. The Illumina BovineSNP50 BeadChip (Illumina Inc., San Diego, CA) is comprised of 54,001 SNP probes. After testing a panel of 576 animals, including 392 animals from 14 taurine dairy and beef breeds, 73 animals from three breeds of predominantly indicine background, 48 animals from two breeds that are taurine×indicine composites, and 45 animals from two African breeds, Matukumalli et al. [3] found that the average call rate for individual samples was greater than 97.5% and 85% of samples had call rates above 98.8%. The authors also observed that 51,383 (~95%) of the 54,001 called SNPs were polymorphic among the 558 cattle with an average minor allele frequency of 0.26. To date, the BovineSNP50 BeadChip has been used in cattle for genomic evaluation [6-7], identification of copy number variation [8], paternity validation [9], and whole genome association studies for Mycobacterium avium subsp. paratuberculosis infection [10-11] and growth [12]. The chip has also been used to estimate genetic variability between American and European bison [13].
Catttle (Bos taurus) and water buffalo (Bubalus bubalis) belong to the subfamily Bovinae. The former species was domesticated between 8,000 and 10,000 years ago [14], while domestication of the latter species occurred at least 7,000 years ago [15]. For centuries, both animals have been heavily used for production of power, milk and meat to benefit human society. Although both species shared a common ancestor approximately 16.9 million years ago [16], their phenotypic divarication has continued to present time. For example, a cow can produce 5 to 10 times more milk than a buffalo, but buffalo milk contains more total solids (18 - 23 % as compared to 13 - 16% in cow milk) (ftp://ftp.fao.org/docrep/fao/010/ah847e/ah847e.pdf). Water buffalo meat flavor is similar to beef, but contains about one-half the amount of cholesterol, and less than one-fourth the amount of fat, particularly saturated fat. Water buffaloes are able to subsist on a low quality, high roughage diet and are resistant to most of the internal and external parasites that affect cattle. Therefore, the primary goal of this study was to test and evaluate the cross-species transferability of SNPs from cattle to buffalo in a mammalian model system. In order to do so, we used the Illumina BovineSNP50 BeadChip as described above. Our report here represents the largest SNP transferability study between these two species at the whole genome level. In particular, characterization of cross-species SNP transferability might provide new insights into understanding molecular mechanisms of SNP divergence and genome evolution associated with the phenotypic divergence between these two species.
Materials and Methods
Water Buffalo DNA Preparation and Genotyping on Illumina Bovine50SNP BeadChips. Basic information on the 54,001 SNPs on the Illumina BovineSNP50 BeadChip (Illumina Inc., San Diego, CA), including SNP name, chromosome, and map location was downloaded from the Illumina website (Illumina Inc., San Diego, CA). Among these SNPs, 1,672 remain unassigned to any bovine chromosome, while 74 SNPs have information on chromosome, but without specified locations. In the present study, blood samples were collected from water buffalo and used for DNA extraction. Blood was collected into vacutainer tubes that contained EDTA as the anticoagulant. Thereafter, DNA was extracted from 200 µL of whole blood with the GenElute Blood Genomic DNA extraction kit (Sigma, St. Louis, MO) according to the manufacturer's instructions. Ten water buffalo DNA samples were genotyped at GeneSeek (Lincoln, NE) on the BovineSNP50 genotyping BeadChip.
Genotype Quality Control Process on Water Buffalo Samples. GeneSeek (Lincoln, NE) performed a quality control check on our water buffalo samples for their Illumina BovineSNP50 BeadChip genotypes. A custom-generated (using >500 Holstein cattle) cluster file was applied and then the markers were filtered by a specific set of criteria. All markers were individually inspected if they fell into the filtered set. Call rates below 80%, AB R Mean below 0.1, Cluster Separation below 0.13, AB T Mean below 0.2 or above 0.8, Gentrain score below 0.3, or Het Excess below -0.7 or above 0.7 usually cause a marker to be examined, unless there is a valid explanation for excluding one or more criteria. Because of the small number of samples this was applied as completely as possible. It should be understandable that there are noticeable differences between individual breeds of cattle and surely there are even more differences between cattle and water buffalo. Fortunately, we only observed three SNPs in our water buffalo data set that had a cluster separation score of less than 0.13.
Bovine Reference Genome Assembly (Btau_4.0). The Bovine Genome Sequencing and Analysis Consortium [17] has led to genome sequencing and its assembly for cattle. The current assembly (Btau4.0) combined both BAC and whole-genome shotgun (WGS) sequences, which were then placed on chromosomes by employing different mapping methods. The Consortium estimated that the bovine genome size is ~2.87 Gbp, and the current assembly covers at least 92% of the genome. As the SNP map locations are based on the Btau_4.0 assembly, we downloaded the gene information from the Cow Genome Resources at National Center for Biotechnology Information (NCBI) (Bovine Genome Resources). The information includes gene symbol, start position, stop position, orientation on the chromosome, and gene description.
SNP Density Estimation along Each Bovine Chromosome. A non-parametric, kernel density estimation method was used to describe the distribution of the number of SNP markers along the bovine genome. Let x1,x2,…,xn ~ f be an independent and identically-distributed sample of a random variable X, where xi is the observable location, say in bp, of the i-th SNP marker. Then, its kernel density estimator is:
(1)
where h>0 is a smoothing parameter called the bandwidth (BW), and K(●) is some kernel, taken to be a standard Gaussian function with mean zero and variance 1 in the present analysis.
(2)
In the above, h is a free parameter, which may exhibit a strong influence on the resulting kernel density estimates (plots). The kernel density plots showed similar patterns with BW = 1M or less, but the density plots tend to be over-smoothed with BW=5M and beyond. Thus, we choose to present the results obtained with BW=0.05M. This also corresponds to the fact that the 54,000 SNPs on the Illumina Bovine50KBeadchip have an average spacing of 51.5 Kb on the bovine genome.
Call Frequency Plots. Let xi be a map position pertaining to SNP i, and yi be a measure of call frequency, for i=1,…,n.. LOWESS (locally weighted scatterplot smoothing) was used to portray the relationship between xi's and yi's, as follows:
(3)
where g is a smoothing function and εi is a random variable with mean 0 and constant scale. LOWESS is a non-parametric curve- or function-fitting technique [18-19], in which the fit at point x is made using only points in the neighborhood of x. Thus, this method has weaker assumptions about the form of the relationship, as compared to parametric methods, and allows the relationship to be described more closely to its true form, as revealed by the data.
In this analysis, LOWESS starts with a local polynomial (a k-NN type fitting) least squares fit and then uses robust methods to obtain the final fit. First, a polynomial regression is fit in a neighborhood of x. This is equivalent to finding β∈ R p+1 that minimizes
(4)
where Wki(x) denote k-NN weights. Then, the residuals  and the scale parameter
  are computed, and robustness weights are defined as:
(5)
where:
(6)
Finally, the analysis fits the polynomial regression in (4) but with weights δiWki(x).
A noteworthy feature of the above procedure is that we do not need to define a global function of any form to fit a model to the data, but the fit is made locally only using a segment of the data. Mathematically, “local” is defined by the distance represented as the largest integer no greater than f×n, where f is the smoother span. The value of f gives the proportion of points in the plot which influence the smooth at each value. In general, a larger value of f gives more smoothness. Thus, the good choice of f is a value which is as large as possible that minimizes the variability in the smoothed points without distorting the pattern in the data. By this standard, we empirically decided that f=0.001 be used in the present analysis.
Results
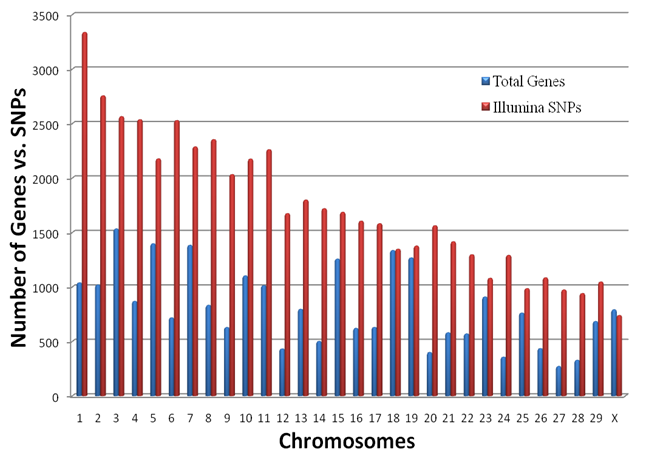
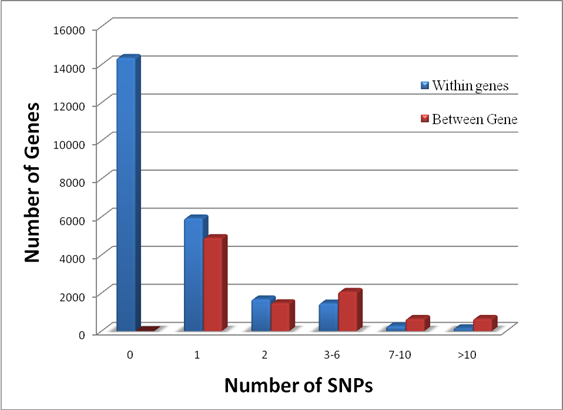
Genome Anchored Features of the Illumina Bovine50SNP BeadChip. The current annotation of the bovine genome (Btau_4.0) indicates that the gene count on bovine chromosomes ranges from 273 genes on chromosome 27 to 1,535 genes on chromosome 3, while the number of SNPs on the Illumina BovineSNP50 BeadChip varies from 740 SNPs on chromosome X to 3,339 SNPs on chromosome 1 (Figure 1). Overall, there are far more Illumina SNPs than genes on most chromosomes, but the difference between SNP and gene counts on chromosomes 18, 19 and 23 is not dramatic. The number of Illumina SNPs is less than the number of genes on chromosome X. Our analysis indicated that 19,294 SNPs (37%) are intragenic (i.e., located within bovine genes) and 32,961 SNPs (63%) are intergenic (i.e., located between bovine genes). The number of SNPs by genes and by intergenic regions was extrapolated from downloaded data and is shown in Figure 2. Over 14,000 genes in the bovine genome have zero intragenic SNPs and the remaining genes have between 1 and 44 intragenic SNPs. In the latter category, most genes have between 1 and 6 intragenic SNPs: around 6,000 bovine genes have only 1 intragenic SNP; more than 1,500 genes have 2 intragenic SNPs; 1,459 genes have between 3 and 6 intragenic SNPs; the remaining genes contain between 7 and 44 intragenic SNPs. On the other hand, every intergenic region is covered by at least 1 SNP: over 4,500 intergenic regions have only 1 SNP, nearly1,500 include 2 SNPs; 2,719 have between 3 and 10 SNPs; the remaining intergenic regions have between 11 and 58 SNPs (Figure 2).
Overall distribution of SNPs and genes on each bovine chromosome.
Distribution of genes having no (0) and a varying number of intragenic and intergenic SNPs on the Illumina BovineSNP50 BeadChip.
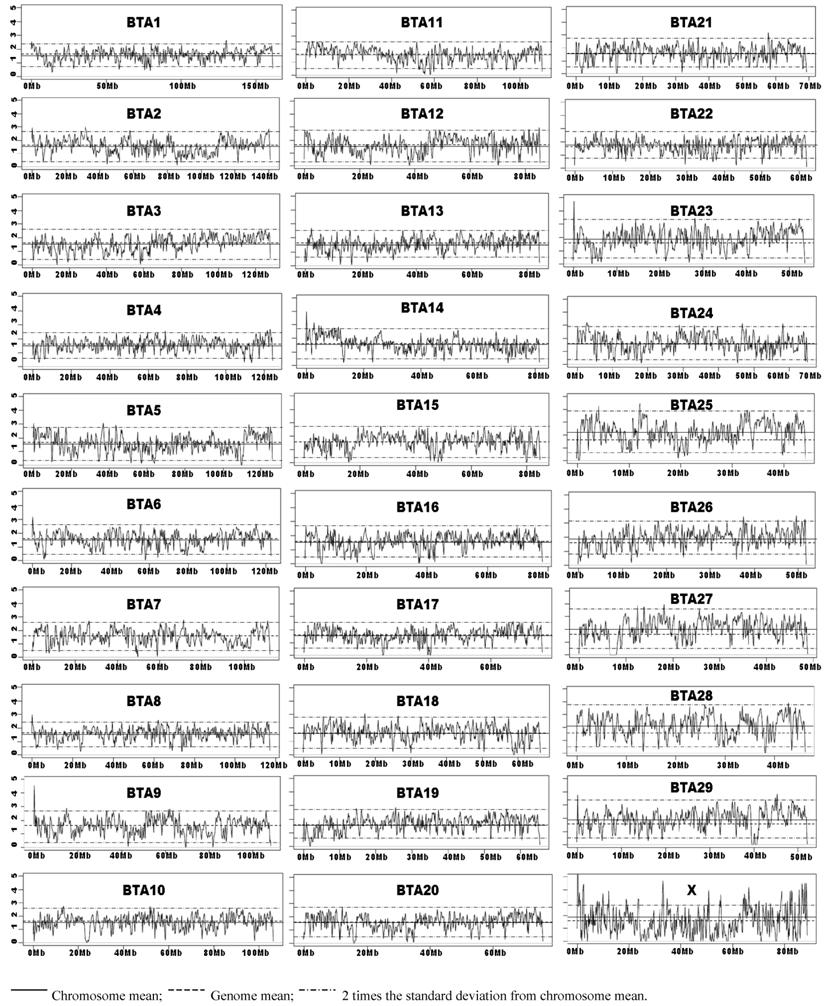
Chromosome Wide SNP Density Dynamics of the Illumina Bovine50SNP BeadChip. The kernel density plots showed similar patterns with BW = 1M or less, but the density plots tend to be flat with BW=5M and beyond (data not shown). As Illumina claimed that these 54,001 SNPs have an average spacing of 51.5 Kb, we choose to present the results obtained with BW=0.05M (50 Kb). The means for the whole genome average and by each chromosome, and two times the standard deviations of the chromosome mean were plotted on each kernel density plot (BW=0.05M). Empirically, we defined a SNP-rich region along the chromosome as the region at which the computed kernel density value was above two times the standard deviation of the chromosome SNP density mean. Likewise, a region along the chromosome was considered SNP-poor if the point fell below two times the standard deviation of the chromosome SNP density mean. As shown in Figure 3, bovine chromosomes 3, 11, 13, 16, 17, 19, 20, 22, and 28 have almost no SNP-rich regions, but still possess various numbers of SNP-poor regions. When the low point of the SNP-poor regions approaches zero, it indicates that this region has no SNPs placed on the Illumina BovineSNP50 BeadChip. Chromosome X shows the greatest SNP density dynamics, because it harbors more than 30 SNP-rich regions and also has at least 20 regions with no SNPs (Figure 3).
Kernel density plots of SNPs on the Illumina BovineSNP50 BeadChip by chromosomes.
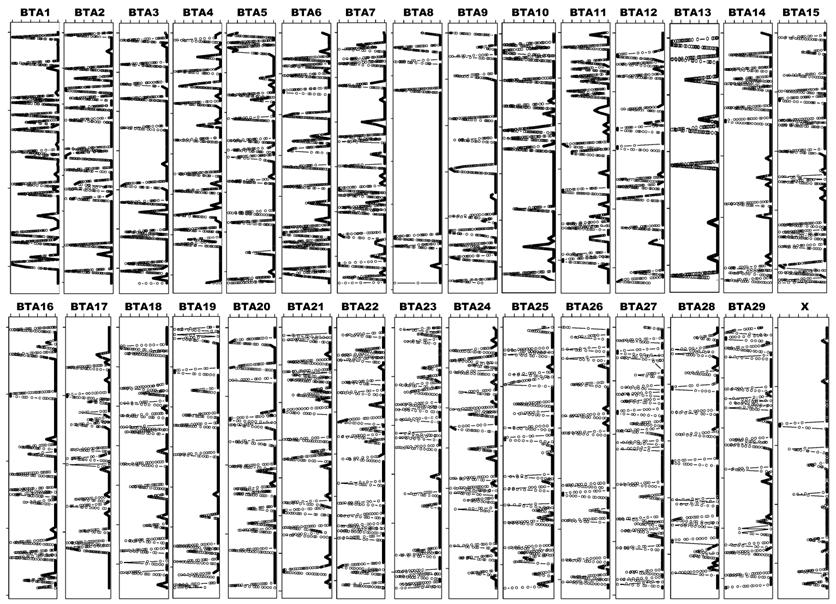
Call Frequency of the Bovine 54,001 SNPs on Water Buffalo Samples. Among 54,001 SNPs on the Illumina BovineSNP50 BeadChip, 41,870 (77.5%) were successfully genotyped on all 10 water buffalo DNA samples (call frequency = 1), while 5,360 (9.9%) had no calls (call frequency = 0) (Table 1). The remaining 6,771 (12.6%) SNPs had calls on various numbers of water buffalo samples, including 733 bovine SNPs on one animal, 560 on two animals, 512 on three, 470 on four, 458 on five, 546 on six, 703 on seven, 972 on eight, and 1,817 on nine water buffalo samples, respectively (Table 1). We also observed that 78.27% of the intragenic SNPs across the genome had a call frequency of 1.0, whereas 77.13% of intergenic SNPs had a call frequency of 1.0. The chi-squared test showed that the difference (78.27%-77.13%=1.13%) is significantly different from zero (P = 0.0059). However, 9.79% of all intragenic SNPs across the genome had no calls, while 10% of intergenic SNPs had a call frequency of 0. On the basis of chromosomes, the percentage of SNPs with a call frequency of 1 ranged from 74.3 on bovine chromosome 27 (BTA27) to 81.1 on chromosome X (BTAX), while the percentage with a call frequency of 0 varied from 4.7 on BTAX to 11.5 on BTA27. Most interestingly, each bovine chromosome can be divided into cluster regions of SNPs with high or low call frequencies (Figure 4). For example, BTA8 contains seven cluster regions of SNPs with a call frequency of 1 and seven cluster regions of SNPs that had calls on water buffalo samples ranging from 0 to 9 animals.
Statistics for different subsets of 54,001 bovine SNPs grouped by number of buffalo with a scored genotype.
| No. of bovine SNPs in the set | No. of water buffalo with a genotype scored for SNPs in set | No. of Polymorphic SNPs in water buffalo | No. of SNPs that are Heterozygous on all called animals | Heterozygote % |
|---|---|---|---|---|
| 5,360 | 0 | - | - | - |
| 733 | 1 | 413 | 413 | 100 |
| 560 | 2 | 314 | 252 | 80.25 |
| 512 | 3 | 245 | 171 | 69.80 |
| 470 | 4 | 217 | 128 | 58.99 |
| 458 | 5 | 190 | 104 | 54.74 |
| 546 | 6 | 196 | 95 | 48.47 |
| 703 | 7 | 235 | 106 | 45.11 |
| 972 | 8 | 234 | 76 | 32.48 |
| 1,817 | 9 | 233 | 53 | 22.75 |
| 41,870 | 10 | 926 | 32 | 3.46 |
Call frequency plots of bovine SNPs on water buffalo samples. The chromosome size can be seen in Figure 3. The six scale marks on the top of each chromosome represent 0 (left most), 20, 40, 60, 80 and 100% (right most) of call frequency.
Polymorphic Status of the Bovine 54,001 SNPs on Water Buffalo Samples. Among 41,870 bovine SNPs that were successfully genotyped on all 10 water buffalo DNA samples, only 926 (2.2%) are polymorphic in water buffalo, including 254, 132, 95, 80, 82, 58, 59, 52, 60, and 54 SNPs with minor allele frequencies of 0.05. 0.10, 0.15, 0.20, 0.25, 0.30, 0.35, 0.40, 0.45 and 0.50, respectively (Supplemental Table 1). However, 386 of these 926 SNPs called on all 10 water buffalo DNA samples have minor allele frequencies ≤0.10 and are probably too rare to be useful in water buffalo. While only 926 SNPs were polymorphic in all ten samples, there were 6,771 bovine SNPs that had calls on one to nine water buffalo samples; of these, 2,277 (33.6%) are polymorphic markers in the species. Interestingly, 1,398 of these SNPs were heterozygous on all called animals (Table 1). Although the heterozygous status decreased from 100% when all 413 SNPs were called as heterozygotes on one animal to 22.75% when 53 of 233 SNPs were heterozygous on all nine called water buffalo samples, the observed figure significantly exceeds the expectation (chi square = 5.924, P=0.0149 for the former case and chi square = 44.053, P=0.0000 for the latter case). However, among 41,870 SNPs that had calls on all ten samples, only 32 were heterozygotes without significant bias from the expected number of 41 (chi square = 1.111, P=0.2919).
Discussion
Approximately, 97% of the SNPs on the BovineSNP50 BeadChip have map locations on the current bovine reference genome assembly (Btau_4.0), which can be downloaded in order to characterize SNPs at a whole genome level. While all of the SNPs are evenly distributed across the bovine genome, the number of SNPs on each chromosome is not correlated with the number of genes on each chromosome (Figure 1). As a consequence, not all genes have intragenic SNPs; in fact, most genes do not have a SNP (Figure 2). Of the genes that do have intragenic SNPs, most have only 1. In contrast, all intergenic regions have at least 1 SNP and there are many more intergenic SNPs with a 1:1.71 intragenic to intergenic SNP ratio. These intragenic SNPs may be used as targets for future functionality research when utilizing the BovineSNP50 BeadChip to transfer markers to water buffalo.
The intergenic SNPs can also be transferred from cattle to water buffalo. While they may not be primary targets for functionality research as they fall in non-coding or “junk” DNA regions, these SNPs might provide secondary targets for research regarding regulation of gene expression. Research has shown that aside from the coding regions, evidence exists that another 80% of the bases in the genome are expressed, which may indicate that “junk” DNA is not actually junk [20]. The non-coding regions contain “genetic switches” that do not encode proteins but regulate where and when genes are expressed [21] and may encode signals that are functionally important to chromosome assembly, DNA replication, and gene expression [22]. Subirana and Messeguer [23] found that non-coding DNA may play a role in maintaining structure and function of eukaryotic chromosomes; this includes roles in centromere function, chromosome condensation, axis formation, and chromosome pairing during meiosis. Variations in non-coding DNA may also influence many complex conditions and diseases [24]. The emerging data regarding function in non-coding regions makes intergenic SNPs ideal targets for research on disease expression and structural functionality.
SNP density plots evaluate SNP distribution dynamics across the genome and identify SNP-poor and SNP-rich regions (Figure 3). We observed that most regions fall within 2 standard deviations of the chromosome SNP density mean. The fact that the 54,001 SNPs on the Illumina Bovine50K BeadChip have an average spacing of 51.5 Kb (i.e., at least 1 SNP per every 50 Kb) prompted us to generate SNP density plots with a BW=0.05M (50 Kb) for each chromosome. These density plots might not be most ideal to portray the distribution of these SNPs on these chromosomes, but they sufficiently depicted some SNP-poor and a few SNP-rich regions. For example the most dynamic chromosome in terms of SNP distribution is chromosome X, which has more than 30 SNP-rich regions and at least 20 regions with zero SNPs (Figure3). Therefore, further research in SNP identification should focus on SNP-poor regions in order to provide even coverage along the entire bovine genome, which can be used on future SNP BeadChips.
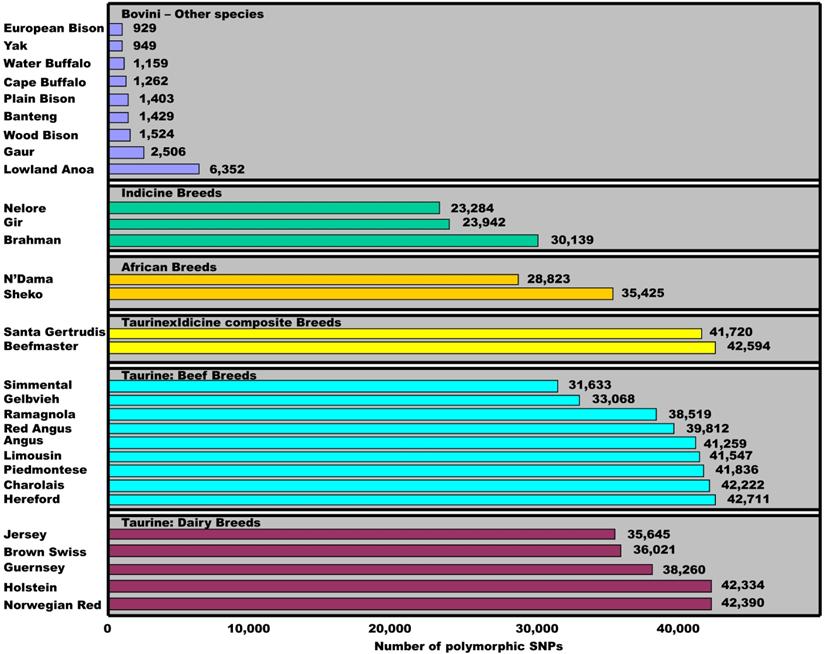
To date, the Illumina BovineSNP50 BeadChip has been used to genotype various breeds and species in the tribe Bovini. Matukumalli and colleagues [3] used the chips to genotype 576 animals and found that the number of SNPs with minor allele frequencies of ≥0.05 ranged from 31,633 to 42,711 among 14 taurine breeds, from 41,720 to 42,594 between two taurine×indicine composite breeds, from 28,823 to 35,425 between two African breeds and from 23,284 to 30,139 among three indicine breeds (Figure 5). However, the figure further reduced to 6,352, 2,506, 1,604, 1,429, 1,262, and 949 SNPs when the 54,001 bovine SNPs were tested on samples of Lowland Anoa (Bubalus depressicornis), Gaur (Bos gaurus), North American Bison (Bison bison), Banteng (Bos javanicus), Cape Buffalo (Syncerus caffer), and Yak (Bos grunniens), respectively [3]. Pertoldi and colleagues [13] also genotyped the same set of 54,001 bovine SNP probes on bison samples of three sub-species and found only 929 cattle SNPs remain polymorphic in European Bison, 1,524 in American wood Bison and 1,403 in American Plain Bison, respectively. When we combine the SNPs that were successfully genotyped on both nine and ten water buffalo samples, a total of 1,159 bovine SNPs remained polymorphic in the species (Figure 5). These results clearly indicate that polymorphic status of cattle SNPs is variable within and between species. Therefore, the present study provides insight into the SNP evolutionary process, and helps to understand within- and between-species biodiversity, phylogenetics and adaption to environmental changes.
Polymorphic dynamics of cattle SNPs within and between species. The minor allele frequency for each SNP is ≥0.05 in a given population. Data sources: Matukumalli et al. [3], Pertoldi et al. [13] and our present study.
In recent years, the water buffalo research community has been working hard to generate genome resources in terms of cytogenetic characterization, whole genome mapping and whole genome sequencing (reviewed by Michelizzi et al. [25]). The present study added more than 1,000 useful SNPs as genetic markers to the water buffalo genome resources (Supplemental Table 1). For example, this set of genetic markers can be used to advance sustainable water buffalo production systems for higher productivity through manipulating the variation within and between breeds, in order to realize more rapid and better-targeted gains in breeding value. This process would help water buffalo breeders and farmers to overcome challenges and problems such as poor reproductive efficiency, sub-optimal production potential, high incidence of infertility diseases, low rates of calf survival and high costs of feeding. No doubt, phenotypic data is required to estimate the effects associated with the SNP so accurate recording systems are as necessary as marker discovery. The functions of many of these genes and the importance of these SNPs have been investigated in cattle and they can provide insight into potential functions of the transferable SNPs in water buffalo. Therefore, this research makes it possible to identify potential economically important genes in water buffalo based on known functionality of these genes in cattle.
In fact, our present work was performed on the Illumina BovineSNP50 BeadChip v1. Since then, Illumina has improved the BeadChip and made the BovineSNP50 v2 with a total of 54,609 bovine SNPs (http://www.illumina.com/products/bovine_snp50_whole-genome_genotyping_kits.ilmn). Now, the next-generation High-Density Bovine BeadChip (BovineHD) array is also available, featuring a total of 777,962 SNPs (http://www.illumina.com/products/bovinehd_whole-genome_genotyping_kits.ilmn). On the other hand, the community has also improved the bovine whole genome assembly. For example, using the Celera Assembler, the Center for Bioinformatics and Computational Biology at University of Maryland has reassembled the bovine genome and released the data to the public [26]. The UMD3.0 release involves 36.82 million reads into a 2.649 billion bp genome out of which 2.640 billion (99%) bp were placed on chromosomes (http://www.cbcb.umd.edu/research/bos_taurus_assembly.shtml). In addition, several groups have started to sequence the water buffalo genome (reviewed by Michelizzi et al. [25]). Using the Illumina Genome Analyzer IIx, we recently sequenced a male sample of water buffalo and obtained over 46 Gb of sequences for the species. The whole genome assembly of water buffalo is underway. All these new resources present powerful high-throughput solutions for us to pursue a larger whole-genome SNP transferability study between cattle and water buffalo in the near future. For example, with the whole genome assembly available in both species, we would be able to further examine how sequence conservation causes the scored SNP sites, how sequence divergence causes the partially scored or non-scored SNP sites and what sequence contexts make SNPs remain polymorphic or result in copy number variations in water buffalo.
Supplementary Material
Supplementary Table 1Acknowledgements
We thank Dr. Barry Simpson at GeneSeek for pursuing genotype quality control on our water buffalo samples. This work was supported by USDA/FAS grant BIO12-001-009 to Z.J.
Conflict of Interests
The authors have declared that no conflict of interest exists.
References
1. Margulies EH, Cooper GM, Asimenos G. et al. Analyses of deep mammalian sequence alignments and constraint predictions for 1% of the human genome. Genome Res. 2007;17:760-774
2. Bovine HapMap Consortium, Gibbs RA, Taylor JF. et al. Genome-wide survey of SNP variation uncovers the genetic structure of cattle breeds. Science. 2009;324:528-532
3. Matukumalli LK, Lawley CT, Schnabel RD. et al. Development and characterization of a high density SNP genotyping assay for cattle. PLoS One. 2009;4:e5350
4. Hawken RJ, Barris WC, McWilliam SM, Dalrymple BP. An interactive bovine in silico SNP database (IBISS). Mamm Genome. 2004;15:819-827
5. Van Tassell CP, Smith TP, Matukumalli LK. et al. SNP discovery and allele frequency estimation by deep sequencing of reduced representation libraries. Nat Methods. 2008;5:247-252
6. Wiggans GR, Sonstegard TS, VanRaden PM. et al. Selection of single-nucleotide polymorphisms and quality of genotypes used in genomic evaluation of dairy cattle in the United States and Canada. J Dairy Sci. 2009;92:3431-3436
7. Wiggans GR, VanRaden PM, Bacheller LR. et al. Selection and management of DNA markers for use in genomic evaluation. J Dairy Sci. 2010;93:2287-2292
8. Bae JS, Cheong HS, Kim LH. et al. Identification of copy number variations and common deletion polymorphisms in cattle. BMC Genomics. 2010;11:232
9. Weller JI, Glick G, Ezra E. et al. Paternity validation and estimation of genotyping error rate for the BovineSNP50 BeadChip. Anim Genet. 2010 [Epub ahead of print]
10. Settles M, Zanella R, McKay SD. et al. A whole genome association analysis identifies loci associated with Mycobacterium avium subsp. paratuberculosis infection status in US holstein cattle. Anim Genet. 2009;40:655-662
11. Pant SD, Schenkel FS, Verschoor CP. et al. A principal component regression based genome wide analysis approach reveals the presence of a novel QTL on BTA7 for MAP resistance in holstein cattle. Genomics. 2010;95:176-182
12. Snelling WM, Allan MF, Keele JW. et al. Genome-wide association study of growth in crossbred beef cattle. J Anim Sci. 2010;88:837-848
13. Pertoldi C, Tokarska M, Wójcik JM. et al. Depauperate genetic variability detected in the American and European bison using genomic techniques. Biol Direct. 2009;4:48
14. Bradley DG, Cunningham EP. Genetic aspects of domestication. The Genetics of Cattle, eds by Fries and Ruvinski. Oxon, UK: CAB International. 1998:15-32
15. Bibi F, Vrba ES. Unraveling bovin phylogeny: accomplishments and challenges. BMC Biol. 2010;8:50
16. Fernandez MH, Vrba ES. A complete estimate of the phylogenetic relationships in ruminantia: a dated species-level supertree of the extant ruminants. Biol Rew. 2005;80:269-302
17. Bovine Genome Sequencing, Analysis Consortium, Elsik CG, Tellam RL, Worley KC. et al. The genome sequence of taurine cattle: a window to ruminant biology and evolution. Science. 2009;324:522-528
18. Cleveland WS. Robust locally weighted regression and smoothing scatterplots. J. Amer. Statist. Assoc. 1979;74:829-836
19. Cleveland WS. LOWESS: A program for smoothing scatterplots by robust locally weighted regression. Am. Stat. 1981;35:54
20. Pennisi E. Genomics. DNA study forces rethink of what it means to be a gene. Science. 2007;316:1556-1557
21. Ludwig MZ. Functional evolution of noncoding DNA. Curr Opin Genet Dev. 2002;12:634-639
22. Carrol S, Nicolas G, Benjamin P. Regulating Evolution: How Gene Switches Make Life. Scientific American. 2008:60-67
23. Subirana JA, Messeguer X. The most frequent short sequences in non-coding DNA. Nucleic Acids Res. 2010;38:1172-1181
24. Cobb J, Büsst C, Petrou S. et al. Searching for functional genetic variants in non-coding DNA. Clin Exp Pharmacol Physiol. 2008;35:372-375
25. Michelizzi VN, Dodson MV, Pan Z. et al. Water buffalo genome science comes of age. Int J Biol Sci. 2010;6:333-349
26. Zimin AV, Delcher AL, Florea L. et al. A whole-genome assembly of the domestic cow, Bos taurus. Genome Biol. 2009;10(4):R42
Author contact
![]() Corresponding author: Dr. Zhihua Jiang, Department of Animal Sciences, Washington State University, Pullman, WA 99164 - 6351, USA. Tel: +509 335 8761; Fax: +509 335 4246; E-mail: jiangzedu
Corresponding author: Dr. Zhihua Jiang, Department of Animal Sciences, Washington State University, Pullman, WA 99164 - 6351, USA. Tel: +509 335 8761; Fax: +509 335 4246; E-mail: jiangzedu