Impact Factor ISSN: 1449-2288

 Global reach, higher impact
Int J Biol Sci 2013; 9(8):792-802. doi:10.7150/ijbs.5862 This issue Cite
Research Paper
Exploring Valid Reference Genes for Quantitative Real-time PCR Analysis in Plutella xylostella (Lepidoptera: Plutellidae)
Wei Fu1,2,3, Wen Xie2, Zhuo Zhang3,4, Shaoli Wang2, Qingjun Wu2, Yong Liu3,4, Xiaomao Zhou1, Xuguo Zhou5, ![]() , Youjun Zhang2,
, Youjun Zhang2, ![]()
1. Institute of Pesticide Science, Hunan Agricultural University, Changsha 410128, China.
2. Department of Plant Protection, Institute of Vegetables and Flowers, Chinese Academy of Agricultural Sciences, Beijing 100081, China.
3. Hunan Plant Protection Institute, Hunan Academy of Agricultural Sciences, Changsha 410125, China.
4. Key Laboratory of Integrated Management of the Pests and Disease on Horticultural Crops in Hunan Province, Changsha 410125, China.
5. Department of Entomology, University of Kentucky, Lexington, KY 40546-0091, U.S.A.
Received 2013-1-10; Accepted 2013-6-15; Published 2013-8-20
Abstract
Abstract: Quantitative real-time PCR (qRT-PCR), a primary tool in gene expression analysis, requires an appropriate normalization strategy to control for variation among samples. The best option is to compare the mRNA level of a target gene with that of reference gene(s) whose expression level is stable across various experimental conditions. In this study, expression profiles of eight candidate reference genes from the diamondback moth, Plutella xylostella, were evaluated under diverse experimental conditions. RefFinder, a web-based analysis tool, integrates four major computational programs including geNorm, Normfinder, BestKeeper, and the comparative ΔCt method to comprehensively rank the tested candidate genes. Elongation factor 1 (EF1) was the most suited reference gene for the biotic factors (development stage, tissue, and strain). In contrast, although appropriate reference gene(s) do exist for several abiotic factors (temperature, photoperiod, insecticide, and mechanical injury), we were not able to identify a single universal reference gene. Nevertheless, a suite of candidate reference genes were specifically recommended for selected experimental conditions. Our finding is the first step toward establishing a standardized qRT-PCR analysis of this agriculturally important insect pest.
Keywords: Plutella xylostella, reference gene, qRT-PCR analysis, biotic factor, abiotic factor.
Introduction
Gene expression analysis is becoming increasingly important in biological research. Quantitative real-time PCR (qRT-PCR) is often the best method to analyze gene expression because of its large dynamic range, high sensitivity, and good reproducibility [1-4]. However, variations in RNA extraction, reverse transcription, cDNA concentration, and PCR efficiency make qRT-PCR analysis prone to error [5] [6]. To obtain reliable and valid gene expression profile, quality assurance and control(s) are essential [7]. Using “housekeeping” gene(s) as a reference is the most widely adopted approach [8]. However, as there are no universally applicable genes with invariant expression, it is necessary to meticulously evaluate the expression profiles of candidate reference genes for each experimental system. Normalization with less than optimal internal controls may result in different values and lead to erroneous interpretations. Computational programs geNorm [9], NormFinder [10], and BestKeeper [11] have been developed to search for the best-suited reference genes in a given set of biological samples.
An ideal reference gene should exhibit similar mRNA expression levels across various biotic and abiotic conditions. Housekeeping genes involved in basic and ubiquitous cellular functions, including β-actin (ACTB), glyceraldehyde-3-phosphate dehydrogenase (GAPDH), and 18S rRNA ribosomal RNA (18S rRNA), have been used extensively as reference genes in different organisms. The assumption is that these housekeeping genes are uniformly expressed regardless of the experimental conditions. However, several reports have demonstrated that these widely used reference genes differentially expressed under specific experimental conditions [12-14], which essentially nullified their utility in gene expression analysis [15]. In reality, no reference genes are stably expressed and suitable for all the cell and tissue types, and various experimental conditions, i.e., there is no universal reference gene(s) [7][9][14].
The diamondback moth, Plutella xylostella (L.) (Lepidoptera: Plutellidae), is a highly destructive pest of cruciferous crops worldwide, and has developed resistance to a wide array of insecticides [16][17]. P. xylostella genome is the very first genome documenting an insect pest of agricultural importance [18]. Plus, P. xylostella has become an emerging insect model to study insect-plant interactions. A quick PubMed search yields nearly 700 research papers involving P. xylostella. With the advent of post-genomic era, we expect an exponential increase in the molecular level research of P. xylostella in the coming years. With the advent of genomics, there is an unprecedented opportunity to investigate the genetic basis of its physiological and biological functions [19-23]. Despite the demonstrated need for systematic validation of references genes in qRT-PCR studies, normalization procedures have received little attention for this species, with many studies continuing to use a single reference gene and most failing to report reference gene stability across various experimental treatments. There have been 18 published articles involving qRT-PCR studies in the diamondback moth; only four reference genes (ACTB, GAPDH, ribosomal protein L32 (RPL32), and ribosomal protein S13 (RPS13)) were used in these studies (Google Scholar search, up to August 6, 2012). The ACTB gene is the most common reference gene (10 research papers). Meanwhile, over half of these qRT-PCR analyses have been performed in different developmental stages and/or various tissue types (Supplementary Material: Table S1). Fortunately, several stable reference genes have been reported under different conditions for the diamondback moth; however, only five candidate reference genes and two different conditions (developmental stages and tissue) were tested [24].
The objective of this study was to address an important but often neglected aspect of gene expression studies in P. xylostella, as well as in other insects: the selection and validation of appropriate reference genes with stable expression across various biotic and abiotic conditions. Here, we selected a panel of candidate genes from P. xylostella transcriptome, and investigated their potential as internal references for normalization of gene expression in P. xylostella. This panel included eight housekeeping genes [ACTB, GAPDH, 18S rRNA, RPL32, RPS13, EF1, ribosomal protein S20 (RPS20), and ribosomal protein S23 (RPS23)] and two target genes [Cu/Zn superoxide dismutase (SOD) and cytochrome P450 (CYP6BG1)]. The stability of these candidates was investigated under three biotic (developmental stage, tissue type, and insecticide susceptibility) and four abiotic conditions (temperature, photoperiod, insecticide, and mechanical injury). As a result, different sets of reference genes were recommended, depending on the experimental conditions. To validate this recommendation, the expression profile of two target genes SOD and CYP6BG1 was investigated.
Methods
Colony maintenance
The laboratory strain of P. xylostella was a gift from Drs Jianzhou Zhao and Tony Shelton (Cornell University, USA). It was originally collected in 1988 from cabbage at the New York State Agricultural Experiment Station, Geneva, NY, and has been maintained on Chinese cabbage for more than 60 generations in our laboratory[25] [26]. Larvae of P. xylostella were maintained on Chinese cabbage. Adults were provisioned with a 10% honey solution.
Treatments
Biotic factors
The different developmental stages including eggs, all four larval instars (collected at the first day of each instar), pupae, and adults. Tissues, including head, midgut and carcass, were dissected from third-instar larvae and kept at -80°C [20]. Three P. xylostella laboratory strains with different insecticide susceptibility were used to evaluate the stability of candidate reference genes. The susceptible strain has been kept in the laboratory without exposure to any insecticide for more than 60 generations, while the Cry1Ac and abamectin resistant strains were selected with Cry1Ac toxin and abamectin for approximately 60 and 20 generations, respectively [26].
Abiotic factors
To examine temperature influence, third-instar larvae were exposed to 5°C, 15°C, 25°C, and 35°C for 2 h with 60-70% RH before subjecting to subsequent RNA extraction. For photoperiod, second-instar larvae were treated with exposure to continued light, dark, and 12:12h light: dark regime for 96 h with 60-70% RH. For insecticide treatment, three P. xylostella laboratory colonies were exposed to Cry1Ac toxin following Wang et al. with minor adjustments [27]. Cabbage leaf discs were dipped into different concentrations (0, 1, 5, and 10 μg/ml) of Cry1Ac toxin for 10s, then air-dried, and placed in glass Petri dishes containing wet filter paper. Second-instar larvae were released onto each of the three replicated leaf discs. P. xylostella larvae were allowed to feed on the treated disc for 48h at 26°C, 60-70% RH, and a 16:8h (light:dark) photoperiod. Mortality was approximately 2, 5, 15 and 40% for 0, 1, 5, and 10 μg/ml of Cry1Ac treatment, respectively. The surviving insects were collected for subsequent RNA extraction. Finally, third-instar P. xylostella larvae were pricked in the belly with a sterile needle to create mechanical injury. After 2h, no mortality was recorded in response to artificial injury, and then P. xylostella larvae were collected for RNA extraction. For both biotic and abiotic conditions, approximately 30 individuals were collected for each treatment with four technical replications, and each experiment was repeated three times independently.
Total RNA extraction and cDNA synthesis
Total RNA was extracted using Trizol (Invitrogen, Carlsbad, CA) following the manufacturer's protocol. The resulting total RNA was re-suspended in nuclease-free water and quantified using a Nanodrop 2000 (Thermo Scientific, Wilmington, DE, USA). RNA samples used had an A260/A280 (absorbance at 260 nm / absorbance at 280 nm) ratio between 1.8 and 2.0. To ensure consistent amounts of cDNA, we measured the concentration of RNA twice for each sample. After adjusting the samples to equal concentrations, one microgram of RNA was reverse transcribed into first-strand cDNA using a PrimeScript®RT reagent kit with gDNA Eraser (Perfect Real Time) (TaKaRa, Tokyo, Japan). cDNA samples were generated from each of three replicates derived from different insect colonies. cDNA was stored at -20°C.
Quantitative real-time PCR
For qRT-PCR analysis, SYBR Green RealMasterMix (TIANGEN, Beijing, China) was used in a reaction mixture that comprised 5 pmol of each gene-specific primer and 1 μl of cDNA sample, in a final volume of 25 μl. The primers used are described in Table 1 and were designed using Primer Premier 5 software (Premier Biosoft, www.premierbiosoft.com). qRT-PCR was carried out in a LightCycler of the ABI Prism 7500 Sequence Detection System (Applied Biosystems, Foster, CA), under the following conditions: 3 min of polymerase activation at 95°C; followed by 40 cycles of denaturation at 95°C for 30 s, annealing at 60°C for 30 s, and elongation at 72°C for 35 s. The qRT-PCR efficiency was determined for each gene using slope analysis with a linear regression model. Relative standard curves for the transcripts were generated with serial dilutions of cDNA (1/3, 1/9, 1/27, 1/81, and 1/243). The corresponding qRT-PCR efficiencies (E) were calculated according to the equation: E = (10[-1/slope]-1) × 100 [28].
Primers used for qRT-PCR analysis
| Gene | Accession Number | Primer Sequence (5′-3′) | Amplicon size (bp) | Ea (%) | R2 b |
|---|---|---|---|---|---|
| 18S rRNA | AY371192 | F: GTTGTTGGGAAGTTGACC R: CAGTGCGGCATTCAGT | 187 | 96.5 | 0.991 |
| ACTB | AB282645 | F: GCGACTTGACCGACTACCT R: GCCGCAAGATTCCATACCC | 272 | 102.8 | 0.999 |
| EF1 | EF417849 | F: GCCTCCCTACAGCGAATC R: CCTTGAACCAGGGCATCT | 161 | 111.1 | 0.995 |
| GAPDH | AJ489521 | F: GCCACCACTGCCACTC R: CGGGACGGGAACACG | 177 | 112.8 | 0.997 |
| RPL10 | AB180439 | F: CAAGGACCAGTTCCACATC R: GCACCACGCATCCCAGT | 111 | 82.9 | 0.997 |
| RPL32 | AB180441 | F: CCAATTTACCGCCCTACC R: TACCCTGTTGTCAATACCTCT | 120 | 102.8 | 0.996 |
| RPS13 | AY174891 | F: TCAGGCTTATTCTCGTCG R: GCTGTGCTGGATTCGTAC | 100 | 96.4 | 0.995 |
| RPS20 | AB180449 | F: GCCCACCAAGTTCCTGC R: ATCTCCGAGGGCGAGTG | 123 | 96.3 | 0.995 |
| RPS23 | AB180672 | F: ATGGGCTGACAAGGATTAC R: TGCGGATGGCAGAGTT | 140 | 111.4 | 0.995 |
| V-ATPase | AB189032 | F: TGTCTGCCACCTTTATCG R: TGATTGCCAGGACAG | 117 | 82.1 | 0.995 |
| CYP6BG1 | AB372008 | F: ATGACGCACCTGCACCGCAA R: ACGGGAAGTACGTGAACGGCA | 95 | 99.0 | 0.997 |
| SOD | GQ166954 | F: CCATGGGCGGCAGCATGACC R: CGTGGCGACGAACTGACGGA | 95 | 99.0 | 0.997 |
aPCR efficiency (calculated from the standard curve)
bRegression coefficient
Statistical analysis
Data analysis was carried out using ABI 7500 SDS System software (version 1.4) (Applied Biosystems). The threshold cycle (Ct value) denotes the cycle at which the fluorescent signal is first significantly different from the background. All biological replicates were used to calculate the average Ct value. Stability of the eight candidate reference genes were comprehensively evaluated using algorithms geNorm version 3.5 (http://medgen.ugent.be/~jvdesomp/genorm/) [9], NormFinder version 0.953 (http://www.mdl.dk/publications normfinder.htm) [10], BestKeeper (http://www.wzw.tum.de/gene-quantification/bestkeeper.html) [11], and the comparative ΔCt method [29]. Finally, we compared and ranked the tested candidates based on a web-based analysis tool RefFinder (http://www.leonxie.com/referencegene.php) [30]. geNorm algorithm first calculates an expression stability value (M) for each gene and then performs a pair-wise comparison (Vn/n+1) of this gene with the others. NormFinder ranks the stability of tested candidates, but independent of each other. BestKeeper determines the standard deviation with user selecting the best genes based on these variables. Based on rankings from each program, RefFinder assigns an appropriate weight to an individual gene and calculated the geometric mean of their weights for the overall final ranking.
Validation of reference gene selection
A putative stress-related gene (SOD) and a defense-related gene (CYP6BG1) were used to assess the validity of selected reference genes. SOD expression levels were determined in injured and control third-instar larvae of P. xylostella with specific primers (Table 1). CYP6BG1 expression levels were determined in three tissues (head, midgut, and carcass) of third-instar larvae of P. xylostella [20]. Two different normalization factors (NFs) were calculated based on (1) the geometric mean of the genes with the lowest Geomean values (as determined by RefFinder ), and (2) a single reference with the lowest or highest Geomean value. Raw Ct values were transformed to relative quantities using the ΔCt formula, Q = E-ΔCt, where E is the amplification efficiency of the gene and ΔCt is the Ct value of the sample minus the Ct value of the sample with the highest expression as calibrator.
Results
Transcriptional profiling of candidate reference genes
Initially, 10 candidate reference genes and two target genes were investigated by reverse transcription polymerase chain reaction (RT-PCR). All genes tested were expressed in P. xylostella, and visualized as a single amplicon with expected size on a 2% agarose gel. All amplicons were sequenced and displayed >97% identity with their corresponding sequences. Furthermore, gene-specific amplification of these genes was confirmed by a single peak in real-time melting-curve analysis (Supplementary Material: Figure S1). A standard curve was generated for each gene, using three-fold serial dilution of the pooled cDNAs. The correlation coefficient and PCR efficiency for each standard curve were shown in Table 1. The PCR efficiency of amplification was, for the most part, constant. Ribosomal protein L10 (RPL10) (82.9%) and vacuolar ATP synthetase subunit E (V-ATPase) (82.1%) were excluded from this study because of their low PCR efficiencies.
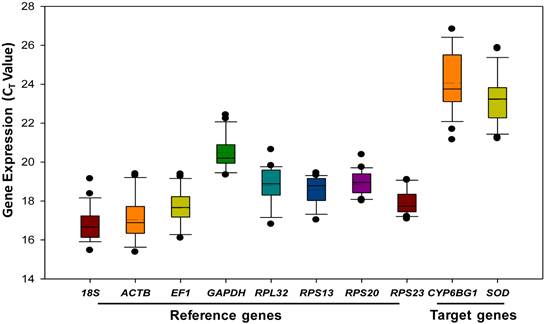
Gene expression analyses of the eight remaining reference genes exhibited a narrow Ct range, covering all the experimental conditions (Figure 1). Ct values ranged from 15 to 23, while most of the values were distributed between 17 and 20. 18S rRNA and ACTB were the most abundant transcripts, reaching the threshold fluorescence peak after 17 cycles. The least abundant transcripts were the two target genes (SOD and CYP6BG1), which had a Ct value of 23 or higher.
Expression profiles of candidate reference genes and target genes in Plutella xylostella. The expression level of candidate reference genes and target genes in the 24 tested samples are documented in Ct-value. The dot indicates the maximum or minimum value of replicated samples, while whiskers indicate the standard error of the mean.
Stability of candidate reference genes under biotic conditions
Developmental stage
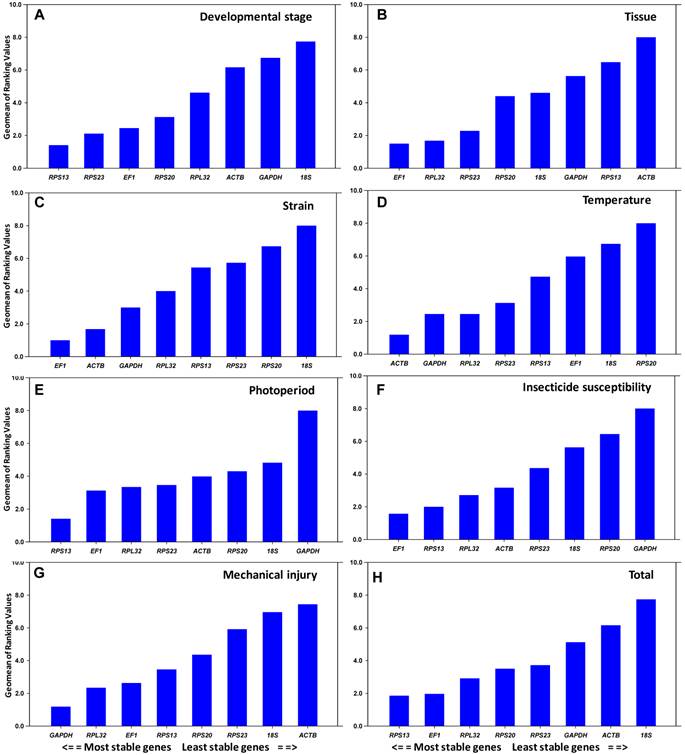
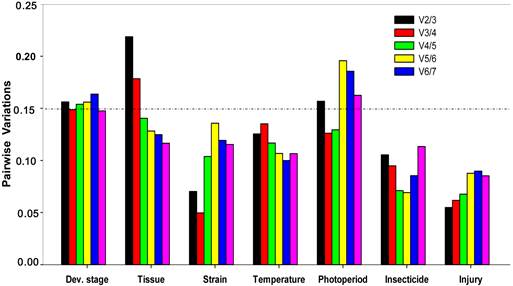
All computation programs, except geNorm , determined RPS13 as the most stable gene (Table 2). According to RefFinder, the overall order from the most stable to the least stable reference genes across different developmental stages was: RPS13 < RPS23 < EF1 < RPS20 < RPL32 < ACTB < GAPDH < 18S rRNA (Figure 2A). With geNorm, the pairwise variations V3/4 value was below the proposed 0.15 cut-off threshold. Moreover, the inclusion of additional reference genes did not lower the Vn+1 value below the proposed 0.15 cut-off until the seventh gene was added (Figure 3). Thus, the combination of control genes recommended for this subset was three genes (RPS13, RPS23 and EF1).
Stability of reference gene expression under biotic conditions
| Biotic Condition | Reference Gene | geNorm | Normfider | BestKeeper | ΔCt | ||||
|---|---|---|---|---|---|---|---|---|---|
| Stability | Rank | Stability | Rank | Stability | Rank | ||||
| Developmental stage | 18S | 1.02 | 7 | 1.15 | 8 | 0.85 | 7 | 1.32 | 8 |
| ACTB | 0.78 | 5 | 0.80 | 5 | 0.92 | 8 | 1.08 | 6 | |
| EF1 | 0.37 | 1 | 0.47 | 3 | 0.62 | 5 | 0.85 | 3 | |
| GAPDH | 0.92 | 6 | 1.14 | 7 | 0.75 | 6 | 1.31 | 7 | |
| RPL32 | 0.66 | 4 | 0.82 | 6 | 0.55 | 3 | 1.06 | 5 | |
| RPS13 | 0.56 | 3 | 0.29 | 1 | 0.33 | 1 | 0.81 | 1 | |
| RPS20 | 0.46 | 2 | 0.48 | 4 | 0.48 | 2 | 0.87 | 4 | |
| RPS23 | 0.37 | 1 | 0.36 | 2 | 0.62 | 4 | 0.83 | 2 | |
| Tissue | 18S | 0.81 | 3 | 0.73 | 4 | 0.78 | 7 | 1.06 | 4 |
| ACTB | 1.08 | 7 | 1.29 | 8 | 0.96 | 8 | 1.44 | 8 | |
| EF1 | 0.86 | 4 | 0.40 | 1 | 0.34 | 1 | 0.92 | 1 | |
| GAPDH | 0.96 | 6 | 0.83 | 6 | 0.61 | 4 | 1.13 | 6 | |
| RPL32 | 0.54 | 1 | 0.51 | 2 | 0.43 | 2 | 0.94 | 2 | |
| RPS13 | 0.91 | 5 | 0.87 | 7 | 0.73 | 6 | 1.15 | 7 | |
| RPS20 | 0.71 | 2 | 0.78 | 5 | 0.71 | 5 | 1.06 | 5 | |
| RPS23 | 0.54 | 1 | 0.59 | 3 | 0.60 | 3 | 0.96 | 3 | |
| Strain | 18S | 0.71 | 7 | 0.90 | 7 | 0.86 | 8 | 1.01 | 7 |
| ACTB | 0.11 | 1 | 0.06 | 1 | 0.25 | 2 | 0.50 | 1 | |
| EF1 | 0.11 | 1 | 0.06 | 1 | 0.22 | 1 | 0.50 | 1 | |
| GAPDH | 0.18 | 2 | 0.22 | 2 | 0.28 | 3 | 0.55 | 2 | |
| RPL32 | 0.20 | 3 | 0.29 | 3 | 0.38 | 4 | 0.56 | 3 | |
| RPS13 | 0.34 | 4 | 0.60 | 4 | 0.70 | 7 | 0.76 | 4 | |
| RPS20 | 0.61 | 6 | 0.82 | 6 | 0.41 | 6 | 0.94 | 6 | |
| RPS23 | 0.50 | 5 | 0.74 | 5 | 0.40 | 5 | 0.87 | 5 | |
Stability of candidate reference gene expression. The stability of reference gene expression was measured using the Geomean method. A lower Geomean value denotes more stable expression.
Optimal number of reference genes for normalization in Plutella xylostella. The pairwise variation (Vn/Vn+1) was analyzed between the normalization factors NFn and NFn+1 by the geNorm software to determine the optimal number of reference genes included in the qRT-PCR analysis. Average value of pairwise variations (V) dictates whether inclusion of an extra reference gene would add to the stability of the normalization factor.
Tissue
All computation programs, except geNorm, identified EF1 as the most stable (Table 2). According to RefFinder, from the most stable to the least stable in different tissues, the gene overall final order was: EF1 < RPL32 < RPS23 < RPS20 < 18S rRNA < GAPDH < RPS13 < ACTB (Figure 2B). GeNorm analysis revealed that the pair-wise variation value V4/5 was below the proposed 0.15 cut-off (Figure 3). Increasing variation in this value corresponds to decreasing expression stability, because of the inclusion of a relatively unstable fifth gene. Including a fifth reference gene had no significant effect on the normalization factor. Thus, the combination of control genes recommended for this subset was four genes (EF1, RPL32, RPS23 and RPS20).
Strain
All computation programs identified EF1 and ACTB as the most stable pair of genes (Table 2). According to RefFinder, from the most stable to the least stable in different strains, the gene overall final order was: EF1 < ACTB < GAPDH < RPL32 < RPS13 < RPS23 < RPS20 < 18S rRNA (Figure 2C). Although GeNorm analysis revealed that all pair-wise variation values were below the proposed 0.15 cut-off (Figure 3), two reference genes are sufficient for accurate normalization. According to the minimal use of at least three reference genes proposed [9], the combination of control genes recommended for this subset was three genes (EF1, ACTB and GAPDH).
Stability of candidate reference genes under abiotic conditions
Temperature
All computation programs, except BestKeeper, identified ACTB as the most stable gene (Table 3). According to RefFinder, from the most stable to the least stable under the temperature stress, the gene overall final order was: ACTB < GAPDH < RPL32 < RPS23 < RPS13 < EF1 < 18S rRNA < RPS20 (Figure 2D). GeNorm analysis revealed that all the pair-wise variation values were below the proposed 0.15 cut-off (Figure 3). According to the minimal use of at least three reference genes proposed [9], the combination of control genes recommended for this subset was three genes (ACTB, GAPDH and RPL32).
Stability of reference gene expression under abiotic conditions
| Abiotic Condition | Reference Gene | geNorm | Normfider | BestKeeper | ΔCt | ||||
|---|---|---|---|---|---|---|---|---|---|
| Stability | Rank | Stability | Rank | Stability | Rank | Stability | Rank | ||
| Temperature | 18S | 0.61 | 6 | 0.67 | 7 | 0.58 | 8 | 0.80 | 7 |
| ACTB | 0.36 | 1 | 0.28 | 1 | 0.37 | 2 | 0.55 | 1 | |
| EF1 | 0.51 | 5 | 0.58 | 6 | 0.50 | 6 | 0.71 | 6 | |
| GAPDH | 0.47 | 4 | 0.29 | 2 | 0.36 | 1 | 0.58 | 3 | |
| RPL32 | 0.37 | 2 | 0.34 | 3 | 0.38 | 3 | 0.57 | 2 | |
| RPS13 | 0.42 | 3 | 0.47 | 5 | 0.43 | 4 | 0.65 | 5 | |
| RPS20 | 0.66 | 7 | 0.69 | 8 | 0.56 | 7 | 0.81 | 8 | |
| RPS23 | 0.36 | 1 | 0.41 | 4 | 0.47 | 5 | 0.60 | 4 | |
| Photoperiod | 18S | 0.62 | 4 | 0.65 | 6 | 0.49 | 3 | 0.89 | 6 |
| ACTB | 0.49 | 2 | 0.55 | 4 | 0.79 | 7 | 0.80 | 3 | |
| EF1 | 0.69 | 5 | 0.50 | 2 | 0.40 | 2 | 0.83 | 4 | |
| GAPDH | 0.89 | 7 | 1.22 | 8 | 0.91 | 8 | 1.33 | 8 | |
| RPL32 | 0.44 | 1 | 0.61 | 5 | 0.66 | 5 | 0.85 | 5 | |
| RPS13 | 0.44 | 1 | 0.20 | 1 | 0.49 | 4 | 0.71 | 1 | |
| RPS20 | 0.75 | 6 | 0.67 | 7 | 0.27 | 1 | 0.92 | 7 | |
| RPS23 | 0.53 | 3 | 0.52 | 3 | 0.67 | 6 | 0.79 | 2 | |
| Insecticide | 18S | 0.36 | 3 | 0.43 | 6 | 0.42 | 7 | 0.54 | 5 |
| ACTB | 0.38 | 4 | 0.33 | 5 | 0.18 | 1 | 0.50 | 3 | |
| EF1 | 0.30 | 2 | 0.19 | 1 | 0.23 | 2 | 0.43 | 1 | |
| GAPDH | 0.53 | 7 | 0.61 | 8 | 0.50 | 8 | 0.70 | 7 | |
| RPL32 | 0.24 | 1 | 0.27 | 3 | 0.38 | 6 | 0.46 | 2 | |
| RPS13 | 0.24 | 1 | 0.20 | 2 | 0.33 | 4 | 0.43 | 1 | |
| RPS20 | 0.47 | 6 | 0.55 | 7 | 0.33 | 5 | 0.64 | 6 | |
| RPS23 | 0.41 | 5 | 0.32 | 4 | 0.32 | 3 | 0.50 | 4 | |
| Injury | 18S | 0.66 | 5 | 0.73 | 7 | 0.80 | 8 | 0.89 | 6 |
| ACTB | 0.77 | 7 | 0.78 | 8 | 0.62 | 6 | 0.93 | 7 | |
| EF1 | 0.33 | 1 | 0.43 | 4 | 0.39 | 3 | 0.69 | 3 | |
| GAPDH | 0.33 | 1 | 0.31 | 2 | 0.32 | 1 | 0.64 | 1 | |
| RPL32 | 0.44 | 2 | 0.28 | 1 | 0.51 | 5 | 0.64 | 1 | |
| RPS13 | 0.51 | 3 | 0.32 | 3 | 0.50 | 4 | 0.65 | 2 | |
| RPS20 | 0.58 | 4 | 0.72 | 6 | 0.34 | 2 | 0.86 | 5 | |
| RPS23 | 0.71 | 6 | 0.70 | 5 | 0.64 | 7 | 0.85 | 4 | |
Photoperiod
All computation programs, except BestKeeper, identified RPS13 as the most stable gene (Table 3). According to RefFinder, from the most stable to the least stable under the photoperiod stress, the gene overall final order was: RPS13 < EF1 < RPL32 < RPS23 < ACTB < RPS20 < 18S rRNA < GAPDH (Figure 2E). GeNorm analysis revealed that the pair-wise variation value V3/4 was below the proposed 0.15 cut-off (Figure 3). Thus, the combination of control genes recommended for this subset was three genes (RPS13 EF1 and RPL32).
Insecticide susceptibility
Both NormFinder and ΔCt method identified EF1 as the most stable gene, while geNorm and Bestkeeper identified RPS13 and ACTB as the most stable genes, respectively (Table 3). According to RefFinder, from the most stable to the least stable under the insecticide stress, the overall order was: EF1 < RPS13 < RPL32 < ACTB < RPS23 < 18S rRNA < RPS20 < GAPDH (Figure 2F). GeNorm analysis revealed that all pair-wise variation value was below the proposed 0.15 cut-off (Figure 3). According to the minimal use of at least three reference genes proposed [9], the combination of control genes recommended for this subset was three genes (EF1, RPS13 and RPL32).
Mechanical injury
All computation programs, except NormFinder, identified GAPDH as the most stable gene (Table 3). According to RefFinder, from the most stable to the least stable under the injury stress, the gene overall final order was: GAPDH < RPL32 < EF1 < RPS13 < RPS20 < RPS23 < 18S rRNA < ACTB (Figure 2G). GeNorm analysis revealed that all pair-wise variation values were below the proposed 0.15 cut-off (Figure 3). According to the minimal use of at least three reference genes proposed [9], the combination of control genes recommended for this subset was three genes (GAPDH, RPL32 and EF1).
Validation of reference gene selection
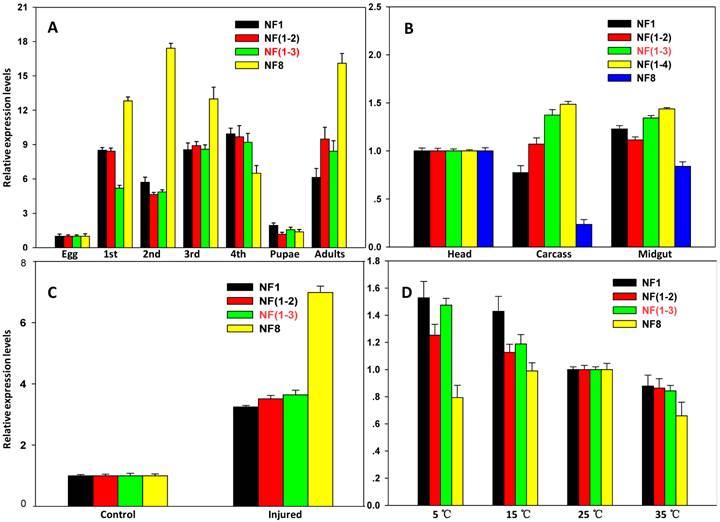
To validate selected reference genes (genes with the low Geomean value are considered stable), the expression profiles of two target genes CYP6BG1 and SOD were evaluated under various experimental conditions. Using two best reference genes [RPS13 and RPS23; NF (1-2)] or three best reference genes [RPS1, RPS23 and EF1; NF (1-3)] for normalization, similar expression levels of CYP6BG1, a putative defense-related gene, were observed in all developmental stages except the first larvae. The CYP6BG1 expression were higher normalized using the reference gene with highest Geomean value (18S rRNA; NF8) than normalized using other normalization factors in all developmental stages except the fourth larvae and pupae (Figure 4A). When normalized using more than one reference genes [NF (1-2), NF (1-3) and NF (1-4)], CYP6BG1 expression in the carcass, was higher compared to the head, but was reduced when normalized against only one reference gene (NF1 or NF8). Using one reference gene with the lowest Geomean value, there were no differences between the head and carcass, but important differences were evident when normalized against the gene with the highest Geomean value (ACTB; NF8) (Figure 4B). When normalized using the combination of control genes recommended as reference genes [NF (1-3)], the expression of SOD, a putative stress-related gene, under injury stress treatment was increased by 3.6-fold compared with the control insects. Using one reference gene with the lowest Geomean value (GAPDH; NF1) or two best references [GAPDH and RPL32; NF (1-2)] for normalization, similar expression levels were observed; however, important differences were evident when normalized against the gene with the highest stability value (ACTB; NF8) (Figure 4C). The SOD expression levels were higher normalized using the best reference gene (ACTB; NF1) than normalized using recommended normalization factors [NF (1-3)] but the differences were inconspicuous in different temperature conditions, whereas the expression levels were lower normalized using unstable reference gene (RPS20; NF8) and the differences were evident (Figure 4D).
Validation of the gene stability measures. Expression profiles of CYP6BG1 in seven developmental stages (A) and three tissues (B) were investigated using different normalization factors. In addition, expression profiles of a target gene, SOD, under injured condition (C) and different temperature regime (D) were evaluated as well. Results are represented as mean ± SD. Each treatment, which involved 15 larvae, was independently replicated six times, expect for the egg stage. mRNA was extracted from the mass homogenates of 15 larvae. Bars represent the means and standard deviations of six biological replicates.
Discussion
For valid qRT-PCR analysis, the selection of suitable reference genes is an important prerequisite to a successful gene expression profiling study [2][3][5][6]. Most gene expression studies in the literature use a single internal control for normalization, and the validity of the conclusions depends highly on the control gene used [12]. As a consequence, genes currently used as references for qRT-PCR analysis in insects are almost exclusively putative reference genes [14]. At the present time, several stable reference genes have been reported under different conditions for fruit fly [14] [31], honeybee [32], locust [33] [34], psocids [35], Rhodnius prolixus [36], and moths [24]. Reference genes in qRT-PCR analysis have often been selected based on consensus and experience in other organisms rather than empirical evidence (Supplementary Material: Table S1). Teng et al. [24] compared the expression levels of five candidate reference genes across different developmental stages in P. xylostella, and Actin A1 and E2F were the most appropriate reference genes for different developmental stages. However, our results showed that ACTB had a higher Geomean value among different developmental stages and tissues (Figure 2B). Considering the function of this gene product in cytoskeletal structure, it is not surprising that its transcription level varies among different tissues in P. xylostella. In addition, Teng et al [24] demonstrated that Actin A1 was most stable in P. xylostella and Chilo suppressalis, whereas it was least stable in the other two lepidopteran insects (Bombyx mori and Spodoptera exigua) across different developmental stages.
The most commonly used reference genes include those involved in basic cellular processes, including 18S rRNA, ACTB, and GAPDH, which were also used for many years as references in northern blots and conventional RT-PCR assays. However, more recent studies have shown that the expression of these 'classic' reference genes can be variable under diverse conditions [15]. However, rankings of the tested candidate reference genes by different algorithms can vary (Table 2 and 3). To solve this problem, RefFinder, a user-friendly web-based analysis tool, combines all four algorithms geNorm, Normfinder, BestKeeper, and the comparative ΔCt method to comprehensively evaluate and rank reference genes from experimental datasets. Based on the rankings from each program, it assigns an appropriate weight to an individual gene and calculated the geometric mean of their weights for the overall final ranking. Here, we describe an assessment of eight reference genes for their use as internal controls in gene expression studies in a given set of cDNA samples containing different biotic and abiotic treatments in diamondback moth.
Our results showed that it is unrealistic to find an universally applicable reference gene covering all conditions. EF1, which plays an important role in translation by catalyzing the GTP-dependent binding of aminoacyl-tRNA to the acceptor site of the ribosome, were the most stable reference gene for all three biotic factors (developmental stages, tissues, and strains). This result is in accordance with reference gene analyses in Drosophila [14], Orthoptera [34], and Hymenoptera [37], which also ranked EF1 as the most stable reference. However, under temperature stress, EF1 was ranked as one of the least stable genes (Figure 2D), indicating that it is not a suitable reference gene in temperature-related experiments.
There has been ongoing discussion about the optimal number of reference genes required for qRT-PCR analysis. When several reference genes are used simultaneously in a given experiment, the probability of biased normalization decreases. In this study, the number of reference genes used for normalization did impact qRT-PCR analysis. geNorm not only identifies the most stable reference gene but also selects the optimum pair of genes with least variation in their expression ratios. geNorm determines the pairwise variations (V n/n+1) in normalization factors (the geometric mean of multiple reference genes) using n or n+1 reference genes. Using microarray data as a training set for the algorithm, a threshold value of V < 0.15 was suggested for normalization [9]. Our results demonstrated that the use of a single reference gene can be insufficient to normalize the expression data or can lead to erroneous interpretation, while multigene normalizer usually provides more conservative estimation of target gene expression. As a result, we strongly suggest that multiple internal references are necessary for studying gene expression under various experimental conditions. However, the threshold value of V < 0.15 was not absolute. When using more than three reference genes, the stability of multigene normalizer maybe decline after adding the fourth reference gene which was not the best stable reference gene (Figure 4B). We recommend the combination of three best reference genes for tissue subset was enough, although geNorm suggested that the combination of reference gene for this subset was four genes. It is important to understand the background of the algorithms used, in order to choose reference genes which are suitable for the task at hand, instead of relying on one method of reference gene selection. Table 4 lists the optimal reference genes to accurately normalize and quantify gene expressions in P. xylostella.
Combination of control genes in P. xylostella recommended for different sample subsets
| Biotic Factor | Reference Gene | Abiotic Stress | Reference Gene |
|---|---|---|---|
| Development stage | RPS13, RPS23 and EF1 | Temperature | ACTB, DAPDH and RPL32 |
| Tissue | EF1, RPL32 andRPS23 | Photoperiod | RPS13 EF1 and RPL32 |
| Strain | EF1, ACTB and GAPDH | Insecticide susceptibility | EF1, RPS13 and RPL32 |
| Mechanical injury | DAPDH, RPL32 and EF1 |
Conclusion
In this study, a total of eight candidate reference genes were evaluated under various experimental conditions throughout the entire qRT-PCR workflow. Based on the comprehensive analysis, a suite of internal references are recommended to accurately normalize and quantify gene expression in P. xylostella (Table 4). This study not only provides a standardized procedure for quantification of gene expression in the diamondback moth, but also lays a solid foundation for the genomics and functional genomics research in this emerging insect model.
Supplementary Material
Fig.S1 and Table S1.
Acknowledgements
This research was supported by the National Natural Science Foundation of China (31071709 and 31171876), the 863 Program (2012AA101502), the Special Fund for Agro-scientific Research in the Public Interest (201103021) and the Beijing Key Laboratory for Pest Control and Sustainable Cultivation of Vegetables.
Competing Interests
The authors have declared that no competing interest exists.
References
1. Bustin S. Absolute quantification of mRNA using real-time reverse transcription polymerase chain reaction assays. J Mol Endocrinol. 2000;25:169-193
2. Bustin S, Benes V, Nolan T. et al. Quantitative real-time RT-PCR--a perspective. J Mol Endocrinol. 2005;34:597-601
3. VanGuilder H, Vrana K, Freeman W. Twenty-five years of quantitative PCR for gene expression analysis. Biotechniques. 2008;44:619-626
4. Citri A, Pang Z, Südhof T. et al. Comprehensive qRT-PCR profiling of gene expression in single neuronal cells. Nat Protoc. 2012;7:118-117
5. Bustin S, Benes V, Garson J. et al. The MIQE guidelines: Minimum information for publication of quantitative real-time PCR experiments. Clin Chem. 2009;55:611-622
6. Bustin S, Beaulieu J, Huggett J. et al. MIQE précis: Practical implementation of minimum standard guidelines for fluorescence-based quantitative real-time PCR experiments. BMC Mol Biol. 2010;11:74
7. Derveaux S, Vandesompele J, Hellemans J. How to do successful gene expression analysis using real-time PCR. Methods. 2010;50:227-230
8. Radonić A, Thulke S, Mackay I. et al. Guideline to reference gene selection for quantitative real-time PCR. Biochem Biophys Res Commun. 2004;313:856-862
9. Vandesompele J, De Preter K, Pattyn F. et al. Accurate normalization of real-time quantitative RT-PCR data by geometric averaging of multiple internal control genes. Genome Biol. 2002;3:RESEARCH0034
10. Andersen C, Ledet-Jensen J, Ørntoft T. Normalization of real-time quantitative RT-PCR data: a model-based variance estimation approach to identify genes suited for normalization, applied to bladder and colon cancer data sets. Cancer Res. 2004;64:5245-5250
11. Pfaffl M, Tichopad A, Prgomet C. et al. Determination of stable housekeeping genes, differentially regulated target genes and sample integrity: BestKeeper--Excel-based tool using pair-wise correlations. Biotechnol Lett. 2004;26:509-515
12. Suzuki T, Higgins P, Crawford D. Control selection for RNA quantitation. Biotechniques. 2000;29:332-337
13. Lee P, Sladek R, Greenwood C, Hudson T. et al. Control genes and variability: absence of ubiquitous reference transcripts in diverse mammalian expression studies. Genome Res. 2002;12:292-297
14. Ponton F, Chapuis M, Pernice M. et al. Evaluation of potential reference genes for reverse transcription-qRT-PCR studies of physiological responses in Drosophila melanogaster. J Insect Physiol. 2011;57:840-850
15. Dheda K, Huggett J, Chang J, Kim L. et al. The implications of using an inappropriate reference gene for real-time reverse transcription PCR data normalization. Anal Biochem. 2005;344:141-143
16. Talekar N, Shelton A. Biology, ecology, and management of the diamondback moth. Annu Rev Entomol. 1993;38:275-301
17. Wu G, Jiang S. Field monitor of insecticide resistance and toxicological mechanism in Plutella xylostella (L.). Acta Phytophylacica Sinica. 2002;29:351-355
18. You M, Yue Z, He W. et al. A heterozygous moth genome provides insights into herbivory and detoxification. Nat Genetics. 2013;45:220-225
19. Sayyed A, Saeed S, Noor-ul-ane M. et al. Genetic, biochemical, and physiological characterization of spinosad resistance in Plutella xylostella(Lepidoptera: Plutellidae). J Econ Entomol. 2008;101:1658-1666
20. Bautista M, Miyata T, Miura K. et al. RNA interference-mediated knockdown of a cytochrome P450, CYP6BG1, from the diamondback moth, Plutella xylostella, reduces larval resistance to permethrin. Insect Mol Biol. 2009;39:38-46
21. Yang Z, Wen L, Wu Q. et al. Effects of injecting cadherin gene dsRNA on growth and development in diamondback moth Plutella xylostella (Lep.: Plutellidae). J Appl Entomol. 2008;133:75-81
22. Sonoda S. Molecular analysis of pyrethroid resistance conferred by target insensitivity and increased metabolic detoxification in Plutella xylostella. Pest Manag Sci. 2010;66:572-575
23. Son Y, Kim Y. Immunosuppression induced by entomopathogens is rescued by addition of apolipophorin III in the diamondback moth, Plutella xylostella. J Invertebr Pathol. 2011;106:217-222
24. Teng X, Zhang Z, He G. et al. Validation of reference genes for quantitative expression analysis by real-time RT-PCR in four Lepidopteran Insects. J Insect Sci. 2012;12:1-17
25. Zhao J, Cao J, Li Y. et al. Transgenic plants expressing two Bacillus thuringiensis toxins delay insect resistance evolution. Nat Biotechnol. 2003;21:1493-1497
26. Yang Z, Wu Q, Wang S. et al. Expression of cadherin, aminopeptidase N and alkaline phosphatase genes in Cry1Ac-susceptible andCry1Ac-resistant strains of Plutella xylostella (L.). J Appl Entomol. 2012;136:539-548
27. Wang L, Li X, Zhang J. et al. Monitoring of resistance for the diamondback moth to Bacillus thuringiensis Cry1ac and Cry1ba toxins and a Bt commercial formulation. J Appl Entomol. 2007;131:441-446
28. Pfaffl M. A new mathematical model for relative quantification in real-time RT-PCR. Nucleic Acids Res. 2001;29:e45
29. Silver N, Best S, Jiang J. et al. Selection of housekeeping genes for gene expression studies in human reticulocytes using real-time PCR. BMC Mol Biol. 2006;7:33
30. Xie F, Sun G, Stiller J. et al. Genome-wide functional analysis of the cotton transcriptome by creating an integrated EST database. PLoS ONE. 2011;6:e26980
31. Shen G, Jiang H, Wang X. et al. Evaluation of endogenous references for gene expression profiling in different tissues of the oriental fruit fly Bactrocera dorsalis (Diptera: Tephritidae). BMC Mol Biol. 2010;11:76
32. Scharlaken B, Graaf D, Goossens K. et al. Reference gene selection for insect expression studies using quantitative real-time PCR: the head of the honeybee, Apis mellifera, after a bacterial challenge. J Insect Sci. 2008;8:33
33. Van Hiel M, Van Wielendaele P, Temmerman L. et al. Identification and validation of housekeeping genes in brains of the desert locust Schistocerca gregaria under different developmental conditions. BMC Mol Biol. 2009;10:56
34. Chapuis M, Tohidi-Estahani D, Dodgson T. et al. Assessment and validation of a suite of reverse transcription-quantitative PCR reference genes for analyses of density-dependent behavioural plasticity in the Australian plague locust. BMC Genomics. 2011;12:7
35. Jiang H, Liu Y, Tang P. et al. Validation of endogenous reference genes for insecticide-induced and developmental expression profiling of Liposcelis bostsrychophila (Psocoptera: Liposcelididae). Mol Biol Rep. 2010;37:1019-1029
36. Majerowicz D, Alves-Bezerra M, Logullo R. et al. Looking for reference genes for real-time quantitative PCR experiments in Rhodnius prolixus (Hemiptera: Reduviidae). Insect Mol Bio. 2011;20:713-722
37. Hornáková D, Matousková P, Kindl J. et al. Selection of reference genes for real-time polymerase chain reaction analysis in tissues from Bombus terrestris and Bombus lucorum of different ages. Anal Biochem. 2010;397:118-120
Author contact
![]() Corresponding author: E-mails: zhangyoujuncn (Y.J.Z.); xuguozhouedu (X.G.Z.)
Corresponding author: E-mails: zhangyoujuncn (Y.J.Z.); xuguozhouedu (X.G.Z.)