Impact Factor ISSN: 1449-2288
- Issue 12; 2026
- Issue 11; 2026
- Issue 10; 2026
- Issue 9; 2026
- Issue 8; 2026
- Volume 22; 2026
- Past Issues
- Advance Articles
- Editorial Board
- Cover Images
- Index & Coverage
- Cover Suggestion
- Special Issues
Introduction
Materials and Methods
Results
Discussion
Conclusions
Abbreviations
Supplementary Material
Acknowledgements
References

 Global reach, higher impact
Int J Biol Sci 2015; 11(12):1348-1362. doi:10.7150/ijbs.13132 This issue Cite
Research Paper
Muscle Transcriptional Profile Based on Muscle Fiber, Mitochondrial Respiratory Activity, and Metabolic Enzymes
Xuan Liu1, Yang Du1, Nares Trakooljul1, Bodo Brand1, Eduard Muráni1, Carsten Krischek2, Michael Wicke3, Manfred Schwerin1, Klaus Wimmers1, Siriluck Ponsuksili1 ![]()
1. Leibniz Institute for Farm Animal Biology (FBN), Institute for Genome Biology, Wilhelm-Stahl-Allee 2, D-18196 Dummerstorf, Germany
2. 2 Institute of Food Quality and Food Safety, University of Veterinary Medicine Hannover, D-30173 Hannover, Germany.
3. 3 Department of Animal Science, Quality of Food of Animal Origin, Georg-August-University Goettingen, D-37075 Goettingen, Germany.
Received 2015-7-3; Accepted 2015-9-7; Published 2015-11-1
Abstract

Skeletal muscle is a highly metabolically active tissue that both stores and consumes energy. Important biological pathways that affect energy metabolism and metabolic fiber type in muscle cells may be identified through transcriptomic profiling of the muscle, especially ante mortem. Here, gene expression was investigated in malignant hyperthermia syndrome (MHS)-negative Duroc and Pietrian (PiNN) pigs significantly differing for the muscle fiber types slow-twitch-oxidative fiber (STO) and fast-twitch-oxidative fiber (FTO) as well as mitochondrial activity (succinate-dependent state 3 respiration rate). Longissimus muscle samples were obtained 24 h before slaughter and profiled using cDNA microarrays. Differential gene expression between Duroc and PiNN muscle samples were associated with protein ubiquitination, stem cell pluripotency, amyloid processing, and 3-phosphoinositide biosynthesis and degradation pathways. In addition, weighted gene co-expression network analysis within both breeds identified several co-expression modules that were associated with the proportion of different fiber types, mitochondrial respiratory activity, and ATP metabolism. In particular, Duroc results revealed strong correlations between mitochondrion-associated co-expression modules and STO (r = 0.78), fast-twitch glycolytic fiber (r = -0.98), complex I (r=0.72) and COX activity (r = 0.86). Other pathways in the protein-kinase-activity enriched module were positively correlated with STO (r=0.93), while negatively correlated with FTO (r = -0.72). In contrast to PiNN, co-expression modules enriched in macromolecule catabolic process, actin cytoskeleton, and transcription activator activity were associated with fiber types, mitochondrial respiratory activity, and metabolic enzyme activities. Our results highlight the importance of mitochondria for the oxidative capacity of porcine muscle and for breed-dependent molecular pathways in muscle cell fibers.
Keywords: microarray, muscle, muscle fiber, mitochondrial Respiratory Activity
Introduction
Skeletal muscle activity requires energy through anabolism and catabolism of glycogen, carbohydrates, and fat, all of which are important for energy storage and supply [1]. The major currency molecule of energy, adenosine triphosphate (ATP), is produced mainly through oxidative phosphorylation in mitochondria. In oxygen-deficient or oxygen-depleted conditions, like exhaustive exercise or even death after slaughter in meat-producing animals, anaerobic glycolysis produces an accumulation of lactic acid and lowers the muscle pH, both of which ultimately lead to muscle ache and cell damage or to impaired meat tenderness and flavor [1, 2]. Further, factors like the proportion of glycolytic and oxidative fibers are associated with meat characteristics such as color [3]. Generally, a higher fat content and more oxidative fibers than glycolytic fibers can improve the juiciness and tenderness of meat. Therefore, energy metabolism in the muscle cells needs to be properly regulated for optimal metabolic functions for different muscle fibers and can ultimately influence meat quality [2].
Two well-studied commercial pig breeds, Duroc and Pietrain, exhibit distinct muscle phenotypes and meat quality. For example, Duroc pigs are fattier and have lower muscle mass but a higher percentage of slow-twitch oxidative muscle fibers compared to Pietrain pigs, which are more muscular and have a higher lean meat percentage and more fast-twitch glycolytic fibers. These differences may be attributed to differences in gene expression profiles of the muscle in these two breeds, which arise as early as the prenatal stages [4, 5]. Although mitochondrial respiratory and metabolic enzyme activities have been well studied in the different muscle fiber types of these two breeds [6-8], the underlying molecular basis of their differences remains to be unraveled.
In the present study, microarray-based transcription profiling, differential gene expression and weighted gene co-expression network analysis (WGCNA) were used to dissect pathways associated with muscle fiber types and activities of glycolytic and oxidative enzymes in longissimus muscle samples obtained 24 h before slaughter of Duroc and Pietrain. WGCNA groups genes into a co-expression network/module based on their similarity of expression patterns. This approach has been demonstrated to identify genes sharing similar functions and/or involved in related molecular events [9]. Results from the present study shed light on biological pathways related to energy metabolism and mitochondrial respiratory activity in muscle cell, and this may have implications for pork quality.
Materials and Methods
Sample collection and phenotypic measurement
This experiment and muscle biopsy collection have been approved and authorized by the German and European animal welfare regulations for animal husbandry, transport, and slaughter [6-8]. Animal care and tissue collection procedures followed the guidelines of the German Law of Animal Protection, and the experimental protocol was approved by the Animal Care Committee of the research institutions and with an official permission from the responsible authorities (Niedersächsischen Landesamt für Verbraucherschutz und Lebensmittelsicherheit (LAVES) 33.42502/01-47.05). The experimental protocol was carried out in accordance with the approved guidelines for safeguarding good scientific practice
As previously described [6-8], Duroc and Pietrain (PiNN) pigs, which are a subset of animals from our previous study, were raised until 180 days of age. To avoid the effects of the malignant hyperthermia syndrome (MHS) locus, only muscle samples from MHS-negative genotype pigs were investigated. Muscle biopsies were collected from five female and male pigs of each breed (n=20) for DNA microarray analysis and phenotypic measurements. Biopsies were collected from the longissimus muscle (LM) between the 13/14th thoracic vertebrae (Th) 24 h before slaughter. Phenotypic measurements of muscle fiber types, mitochondrial respiratory activity, and activities of glycolytic and oxidative enzymes were performed as described previously [6-8]. A short definition and a brief description of the applied methods for all phenotypic traits are provided in Supplemental Table S1.
Total RNA isolation
Total RNA was isolated from the LM biopsies kept at -80 °C (Duroc n=10, PiNN n=10) using Tri-Reagent and RNeasy Mini kit (Qiagen) with an on-column DNase treatment according to the manufacturer's protocol. The RNA integrity was assessed on a 1% agarose gel by electrophoresis. The RNA concentration was measured by a Nano Drop ND-1000 Spectrophotometer (PEQLAB).
DNA microarray analysis
Porcine Snowball Microarray (Affymetrix) containing 47,880 probe-sets was used to determine the expression profile of the LM 24 h ante mortem of Duroc and PiNN pigs. 500 ng total RNA isolated from each biopsy were used for cDNA synthesis and subsequent biotin labeling using the Affymetrix WT plus Expression kit and Genechip WT terminal labeling and hybridization kit according to the manufacturer's instructions. Each of the labeled cRNA samples was hybridized on the array (n=20). The hybridization, washing, and scanning of the arrays was performed in accordance with the manufacturer's recommendations. Affymetrix GCOC1.1.1 software was used for quality control. Expression Console software was used for robust multichip average (RMA) normalization and the detection of present genes by applying the DABG (detection above background) algorithm. Further filtering was done by excluding transcripts with low signals and probes that were present in less than 80% of the samples within each breed. 17,820 probes passed the quality filtering and were used for further analyses. Differential expression analysis was performed using the ANOVA procedure in JMP genomics 7 (SAS Institute). The breed was treated as a fixed effect. False discovery rate (FDR) was used to control an error rate of a multiple-hypothesis testing according to Benjamini & Hochberg [10]. The expression data are available in the Gene Expression Omnibus public repository with the GEO accession number GSE69840: GSM1709900 - GSM1709919.
Weighted gene co-expression network analysis (WGCNA)
Post-filter, 17,820 probes were utilized in the construction of weighted gene co-expression networks using the blockwise modules function in the WGCNA R package as described previously [9, 11, 12]. The analysis was applied separately for each breed. The WGCNA procedure calculated a Pearson correlation matrix for all genes then an adjacency matrix was calculated by raising all values to a power ß from the correlation matrix. The adjacency matrix was converted to a topological overlap matrix (TOM) and the TOM-based dissimilarity matrix for hierarchical clustering. The gene co-expression modules were identified from the hierarchical cluster tree using a dynamic tree cut procedure. The formula of topological overlap matrix (TOM) Ω = [ ] was as follows,
,

where xi and xj were the gene expression profile of the xi-th and xj-th gene and aij was the adjacency. By inspecting the scale-free topology model fit, the power ß was selected as the minimal ß value giving a coefficient of determination R2 higher than 90%. Modules were further merged based on the dissimilarity between their eigengenes, which were defined as the first principle component of each module. Genes that were not assigned to another module were assigned to module grey. Eigengenes act as the representative for each module. To identify gene co-expression modules highly correlated to the phenotype, module-trait relationships were estimated using the correlation between the module eigengene and the phenotype.
Gene functional annotation and pathway analysis
To identify pathways related to phenotypic differences of the muscle between Duroc and PiNN pigs, differentially expressed genes (DEGs) between these two breeds were analyzed using the IPA software (Ingenuity Systems, http://www.ingenuity.com). IPA categorizes genes based on annotated gene functions and statistically tests for over-representation of functional terms within the gene list using Fisher's Exact Test. Moreover, we used WGCNA to identify gene network modules based on their co-expression patterns and correlated them with phenotypic measurements or traits for both pig breeds separately. A gene list of each significant module-trait correlation was analyzed to obtain biologically meaningful represented pathways based on an enrichment score and p-value threshold using IPA and the DAVID online-tool (Database for Annotation, Visualization and Integrated Discovery; http://david.abcc.ncifcrf.gov/home.jsp).
Quantitative real time PCR (qPCR) for microarray validation
qPCR of each individual RNA sample (n=20) was performed using a fast gene expression analysis, EvaGreen, and the BioMark HD Real-time PCR System according to manufacturer's recommendation (Fluidigm). Briefly, cDNA was synthesized from 2 µg of total RNA using Superscript II reverse transcriptase and Oligo dT with a specific target amplification (STA) and Exonuclease I treatment. The qPCR reaction was performed using a 48X48 Dynamic Array and integrated fluidic circuit (IFC). For each sample inlet, 2.5 uL SsoFast EvaGreen supermix with low ROX (Biorad), 0.25 uL DNA binding dye sample loading reagent, and 2.25 uL STA and Exo-I treated sample were loaded. For each assay inlet, 2.5 uL assay loading reagent, 2.25 uL DNA suspension buffer, and 0.25 uL 100 uM mixed (forward and reverse) primers were loaded. All measurements were performed in duplicate. The thermal parameters were 95 oC for 60 s, followed by 30 cycles of 95 oC for 5 s and 60 oC for 20s. The primer sequence information is accessible in Supplemental Table S2. ATP6V1C1, ATP6V1E1, COX10, COX7A2, CYB5A, NDUFS1, NDUFS6 and PPA1 were selected for a qPCR validation based on their functions related to energy metabolism. Three reference genes, ACTB, RPL32, and RPS11 were used to normalize the expression value. Correlation coefficient analysis between the microarray and qPCR was calculated using SAS 9.3 (SAS Institute).
Results
Phenotypic traits
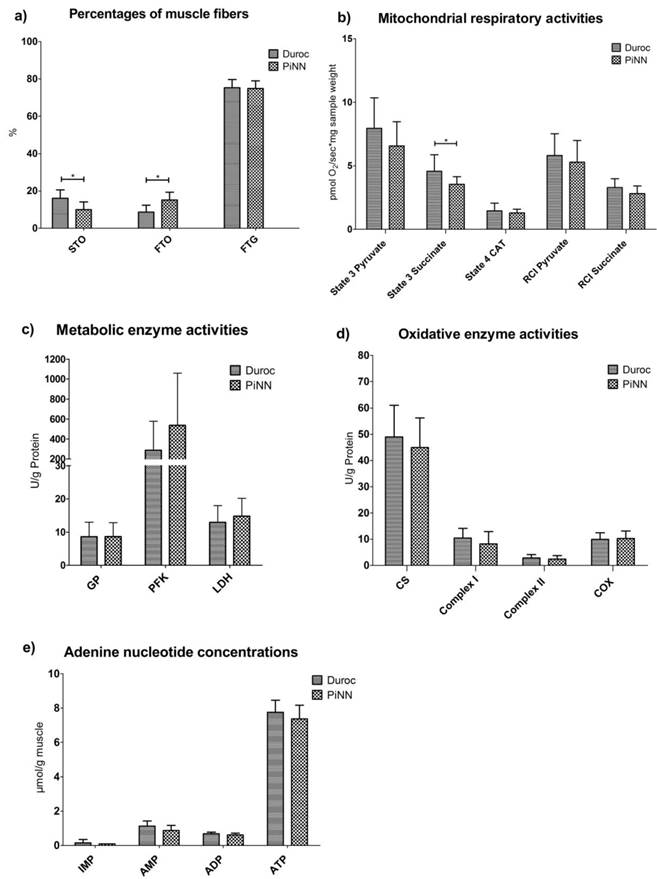
Definitions for all phenotype traits are listed in Supplemental Table S1 and the results are depicted in Figure 1. Muscle fiber composition analysis indicated that Duroc pigs had a higher percentage of slow-twitch-oxidative fiber (STO) (16.08 vs 9.99 %; p-value=0.032) and a smaller percentage of fast-twitch-oxidative fiber (FTO) (8.62 vs 15.13 %, p=0.019) compared to PiNN pigs. No difference between breeds was observed for the fast-twitch-glycolytic fiber (FTG). The succinate-dependent state 3 respiration rate, a measure of mitochondrial activity, was significantly higher in Duroc than PiNN pigs (p<0.05). Other mitochondrial respiratory activity (MRA) and respiratory control index (RCI) parameters such as pyruvate-dependent state 3 respiration and state 4 respiration tended to be higher in Duroc than PiNN but did not reach the significance threshold. Metabolic enzymes such as glycogen phosphorylase (GP), phosphofructokinase (PFK), and lactate dehydrogenase (LDH) had comparable enzyme activities between breeds, while Duroc pigs had slightly higher activities of citrate synthase (CS), complex I, and complex II. There were no differences for adenine nucleotide concentrations of inosine 5'-monophosphate (IMP), adenosine 5'-monophosphate (AMP), adenosine diphosphate (ADP), and adenosine triphosphate (ATP) between these two breeds.
Least squares means and SD of a) muscle fiber percentage b) mitochondrial respiration activities c) metabolic enzyme activities d) oxidative enzyme activities and e) adenine nucleotide concentrations depending on pig breeds Duroc and PiNN 24h antemortem.
Differentially expressed genes and pathway analysis
Out of 47,880 probe-sets on the snowball microarray, 17,820 quality-filtered probes were further analyzed for differential expression between Duroc and PiNN muscle samples using ANOVA on JMP Genomics 7. In total, 2,345 probes were differentially expressed (FDR<0.05) between Duroc and PiNN pigs. Among these, 1,402 probes were up-regulated in Duroc pigs, while 943 probes were up-regulated in PiNN pigs (Table S3). Differentially expressed genes were analyzed with IPA to identify prominent pathways and biological functions. The top three canonical pathways and related genes are shown in Table 1. Protein ubiquitination, embryonic stem cell pluripotency, and HIPPO signaling pathways were over-represented in Duroc, while amyloid processing, and 3-phosphoinositide biosynthesis and degradation were enriched in PiNN. Since our phenotypic data showed tendencies of differential muscle trait measurements in these pigs (Table S1 and Figure 1), we also looked into differentially expressed genes between Duroc and PiNN that are assigned to the functional categories related to skeletal and muscular system development and function as well as carbohydrate metabolism to obtain insight into candidate genes for meat quality, as shown in Table 2.
Differentially expressed genes (DEGs) in the top three canonical pathways derived from Ingenuity Pathway Analysis (IPA) for Duroc and Pietrain (PiNN) pigs
| DEGs | Ingenuity Canonical Pathways | p-value | No. of genes | Genes |
|---|---|---|---|---|
| Duroc-up | Protein Ubiquitination Pathway | 3.15E-08 | 33 | USP45, UBE2D2, FBXW7, DNAJC3, DNAJC13, DNAJC10, SKP1, USO1, USP8, USP7, DNAJC28, HSP90B1, USP13, BIRC3, USP28, USP15, USP38, BIRC6, DNAJC1, MDM2, USP1, UBE2D1, DNAJB14, UBE3A, XIAP, SKP2, UCHL3, DNAJC21, CUL2, UBR1, USP34, USP25, BIRC2 |
| Mouse Embryonic Stem Cell Pluripotency | 3.08E-06 | 16 | IL6ST, PIK3CA, TCF4, JAK1, PIK3C2A, PIK3R1, SOS2, BMPR2, XIAP, NANOG, PTPN11, BMPR1A, SOS1, MAP3K7, SMAD4, GSK3B | |
| HIPPO signaling | 4.62E-06 | 15 | DLG1, TJP2, PPP2R2A, PPP1R11, STK3, SKP1, PPP2R5A, SKP2, ITCH, PPP1CC, PPP1R12A, PPP2R3A, SMAD4, PPP2R5E, INADL | |
| PiNN-up | Amyloid Processing | 2.07E-04 | 8 | CSNK1E, CAPN6, AKT1, CDK5, APH1A, MAPT, PSENEN, CAPN3 |
| 3-phosphoinositide Biosynthesis | 2.91E-04 | 15 | PPFIA1, PPAPDC3, EPHX2, MDP1, PIP4K2B, PPP4C, MTMR6, CDC25B, PPP1R16B, DUSP1, CDIP, PPM1H, CILP, THTPA, PI4KB | |
| 3-phosphoinositide Degradation | 3.12E-04 | 14 | CDC25B, MTMR6, PPFIA1, INPP4A, PPAPDC3, DUSP1, PPP1R16B, EPHX2, PPM1H, MDP1, CILP, PPP4C, THTPA, MTMR3 |
Differentially expressed genes (DEGs) in interesting functional categories derived from Ingenuity Pathway Analysis (IPA) for Duroc and Pietrain (PiNN) pigs
| DEGs | Functions | p-value | No. of genes | Genes |
|---|---|---|---|---|
| Duroc-up | Skeletal and muscular system development and function | 1.48E-03 - 5.48E-03 | 26 | AR, NEB, PPARGC1A, CHSY1, CHUK, PBX1, PDS5B, RBL1, RBL2, BNIP2, HSP90B1, MSTN, RB1, SSPN, DMD, GABPA, UTRN, CMYA5, PPP3CA, FMN1, HIF1A, KIAA1715, LRP6, MECOM, NIPBL, RPGRIP1L |
| Carbohydrate metabolism | 5.48E-03 - 5.48E-03 | 23 | ABCC9, APPL1, CD36, DPP4, HIF1A, LNPEP, PIK3C2A, PIK3CA, PIK3R1, PPM1A, PREX2, PRKAA1, PRKAA2, PRKD3, PTEN, PTPN11, RHOQ, SEPT7, SKP2, SLC1A3, SSFA2, STEAP4, WWP1 | |
| PiNN-up | Skeletal and muscular system development and function | 1.77E-06 - 1.24E-02 | 80 | ACVR2B, AKT1, ANXA6, ASB2, ATP2A1, ATP6V0C, BECN1, CAND2, CAPN3, CAPN6, CAV3, CDK5, CDK9, CEBPB, CLCN1, COL6A1, COL6A3, CRYAB, CSF1, CXCL12, DDR1, DISP1, DNAJC5, DUSP1, ENG, ENO1, ERBB2, ERRFI1, ESR1, FADD, FLII, FZD4, GAA, GAB2, GSK3A, HEXIM1, HSPB2, HSPG2, ICMT, ILK, JMJD6, JSRP1, KCNJ11, KCNJ12, KREMEN1, LMNA, LTBP1, MEF2D, MMP2, MPRIP, MTOR, MYH14, NOL3, NPNT, NPRL3, P2RX6, PLOD1, PRKCA, RAB35, RRAGA, RXRA, SCARB2, SCN1B, SCN4B, SF3B4, SLC6A8, SMAD3, SPEG, SPRY2, SRF, SRL, SRPK3, STIM1, SUFU, SYPL2, THRA, TLR5, TNFRSF11B, USP19, VCAM1 |
| Carbohydrate metabolism | 4.66E-05 - 1.23E-02 | 50 | AKT1, ALG2, AP2M1, APOD, CDIPT, CEBPB, CLN6, CSF1, DPM3, ERBB2, FITM2, GAA, GAPDH, GSK3A, GYS1, HLAA, INPP4A, KCNJ11, LPIN1, MAN2B2, MDP1, MECP2, MMP2, MTMR3, MTOR, NF2, NISCH, NR1D1, PCYT2, PFKFB2, PI4KB, PIGB, PIGC, PIGL, PIGO, PIGQ, PIP4K2B, PLA2G15, PLCD1, RAB35, SCAP, SERINC2, SMAD3, SMARCB1, SPI1, TFEB, USP2, WDTC1, XYLT1, ZFYVE1 |
Weighted gene co-expression network analysis
Due to considerable differences in genetics and phenotypes between Duroc and PiNN, the weighted gene co-expression network analysis (WGCNA) was performed using post quality-filtered data of 17,820 probes separately for each breed. WGCNA grouped genes into 21 modules for Duroc and 20 modules for PiNN based on their co-expression patterns. The number of genes in each module is listed in Supplemental Tables S4 and S5 for Duroc and PiNN, respectively. Further, the representative of each module, an eigengene that is the 1st principle component, was tested for a significant correlation between each module with all 19 traits related to muscle fiber composition, mitochondrial respiration activity, enzyme activities, and adenine nucleotide concentration. The co-expression transcripts in each module and associated gene ontology (GO) terms were identified using DAVID functional annotation for Duroc (Table S4) and PiNN (Table S5) separately. In addition, modules that were associated with the function 'energy production' were also identified using IPA.
Muscle fiber composition-related gene co-expression modules
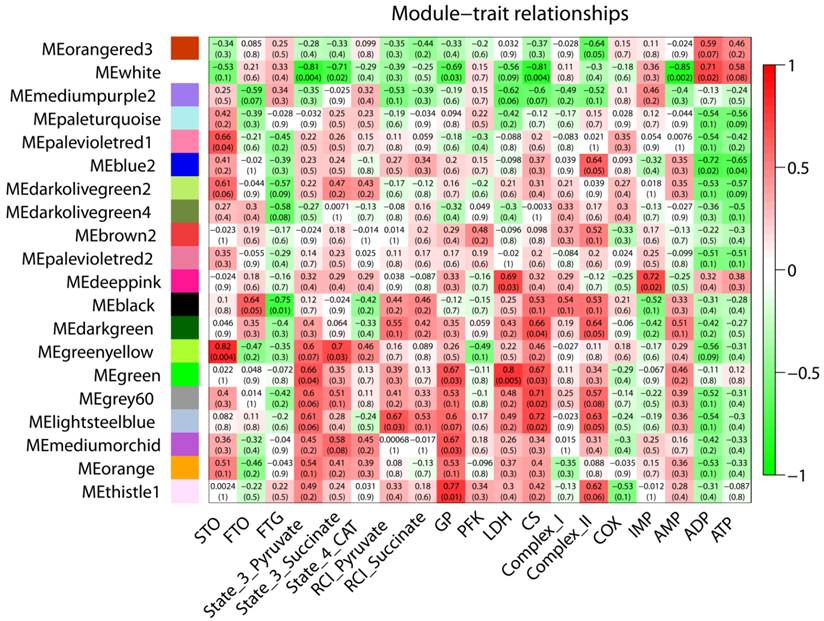
For Duroc pigs, a total of 21 modules were examined for their relationship with all measured traits. Of them, 13, 10, and 9 modules were correlated with the percentage of STO, FTO, and FTG muscle fibers, respectively (p<0.05). Among these, modules blue and green-yellow (each co-expression module was arbitrarily color-coded) were positively correlated with STO fibers (blue/STO, r=0.87, p=0.001; green-yellow/STO, r=0.78, p=0.008), while negatively correlated with FTG fibers (blue/FTG, r= -0.94, p=5E-05; green-yellow/FTG, r= -0.98 p=7E-07) as shown in Figure 2. Functional analysis showed that the blue and green-yellow modules were associated with GO terms 'mitochondrion' and 'mitochondrial part' (Table 3). Interestingly, modules dark-orange and cyan showed the inverse relationship to STO and FTG; they were negatively correlated with STO while positively correlated with FTG (dark-orange/STO, r= -0.72, p=0.02; cyan/STO, r= -0.82, p=0.004; dark-orange/FTG r=0.89 p=6E-04; cyan/FTG, r=0.73, p=0.02). Modules dark-orange and cyan were associated with 'intracellular organelle lumen' and 'regulation of phosphorylation', respectively. Furthermore, modules saddle-brown, black, and white were positively correlated with STO with correlation coefficients (r) ranging from 0.76 to 0.93 (p<0.01), while negatively correlated with FTO (r= -0.72 to -0.83, p<0.02). The related genes within the modules were associated with GO-terms 'protein kinase activity', 'phosphorus metabolic process', and 'cytoskeleton', respectively. In addition, module cyan was also highly correlated with MRA measurements including state 3 pyruvate (r= -0.92, p=2E-04), state 3 succinate (r= -0.8, p=0.005), and state 4 CAT (r= -0.65, p=0.04). Module green-yellow, dark-grey, and white were all positively correlated with oxidative enzyme Complex I and COX with the correlation coefficients ranging between 0.66 to 0.86 (p<0.04), also shown in Figure 2, and their gene members were enriched for GO terms 'mitochondrial part', 'cytoplasmic vesicle', and 'cytoskeleton', respectively.
Correlation matrix between each module and trait for Duroc pigs. Weighted gene co-expression network analysis (WGCNA) was used to group genes into 21 different modules based on their co-expression pattern. Each module is assigned arbitrarily to a color. The respective colors are shown on the left. The eigengene of each module, as a representative of the corresponding module, was tested for correlation with each trait. Shown are the correlation coefficients and the corresponding p-values in brackets. Cell color encodes correlation (red, positive correlation; green, negative correlation).

Gene ontology (GO) terms for significant trait-correlated modules in Duroc
| Module | Top Term | Count1 | Percent2 | P-value of Top Term |
|---|---|---|---|---|
| saddlebrown | GO:0004672~protein kinase activity | 18 | 7.76 | 4.78E-03 |
| black | GO:0006793~phosphorus metabolic process | 44 | 9.40 | 3.61E-04 |
| blue | GO:0005739~mitochondrion | 182 | 9.20 | 5.98E-10 |
| green-yellow | GO:0044429~mitochondrial part | 45 | 6.86 | 5.81E-06 |
| light cyan | GO:0044420~extracellular matrix part | 9 | 2.72 | 1.57E-03 |
| dark grey | GO:0031410~cytoplasmic vesicle | 17 | 6.77 | 2.10E-02 |
| white | GO:0005856~cytoskeleton | 31 | 11.92 | 6.49E-03 |
| dark orange | GO:0070013~intracellular organelle lumen | 33 | 13.41 | 7.40E-03 |
| cyan | GO:0042325~regulation of phosphorylation | 23 | 6.74 | 9.28E-05 |
1 No. of genes in term
2 (No. of genes in term/No. of genes in module)×100
Gene ontology (GO) terms for significant trait-correlated modules in Pietrain (PiNN)
| Module | Top Term | Count1 | Percent2 | P-value of Top Term |
|---|---|---|---|---|
| white | GO:0019899~enzyme binding | 8 | 7.14 | 3.96E-02 |
| blue 2 | GO:0009057~macromolecule catabolic process | 159 | 7.93 | 2.75E-15 |
| green-yellow | GO:0015629~actin cytoskeleton | 16 | 12.50 | 1.93E-10 |
| green | GO:0016563~transcription activator activity | 35 | 5.47 | 2.61E-06 |
1 No. of genes in term
2 (No. of genes in term/No. of genes in module)×100
A total of 20 gene co-expression modules were tested for a trait correlation in PiNN pigs. Overall, fewer significant module-trait relationships were observed in PiNN (Figure 3) compared to Duroc pigs (Figure 2). Modules pale-violet-red 1 and green-yellow were positively correlated with STO (r=0.66 to 0.82, p<0.04). Module black was negatively correlated with FTG (r= -0.75, p=0.01). Modules green-yellow and black were enriched for 'actin cytoskeleton' and 'cellular macromolecule catabolic process', respectively, while no significant enrichment term for module pale violet-red was identified. For glycolytic enzyme measurements, module green, enriched for 'transcription activator activity', was positively correlated with GP and LDH with (r ranged from 0.67 to 0.8 with p<0.03) as shown in Figure 3. Modules significantly correlated with mitochondrial activities included module white, which showed a negative correlation with state-3-pyruvate (r= -0.81, p=0.004), state-3-succinate (r= -0.71, p=0.02), and AMP (r= -0.85, p=0.002), but a positive correlation with ADP (r=0.71, p=0.02). Gene members of this module were over-represented in 'enzyme binding'. Module blue 2, associated with 'macromolecule catabolic process', was negatively correlated with ADP (r= -0.72, p=0.02) and ATP (r= -0.65, p=0.04).
Correlation matrix between each module and trait for PiNN pigs. Weighted gene co-expression network analysis (WGCNA) is used to group genes into 20 different modules based on their co-expression pattern. Each module is assigned arbitrarily to a color. The respective colors are shown on the left. The eigengene of each module, as a representative of the corresponding module, was tested for correlation with each trait. Shown are correlation coefficients (upper value) and the corresponding p-values (lower value). Cell color encodes correlation (red, positive correlation; green, negative correlation).
Several gene members of these significant trait-correlated modules were also differentially expressed between Duroc and PiNN as shown in Subplemental Table S4 and S5.
Energy production-related gene co-expression modules
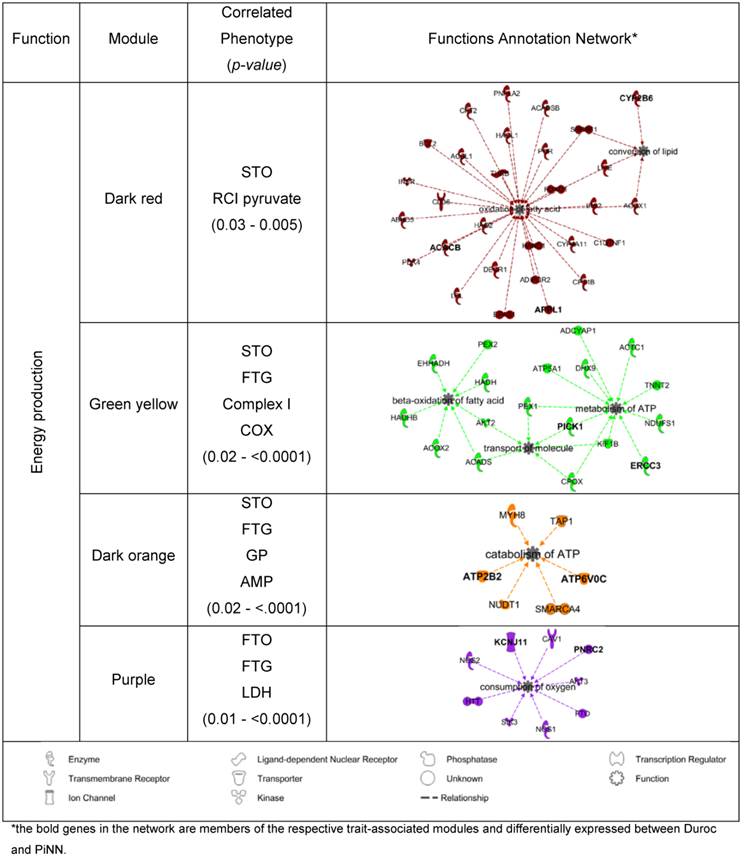
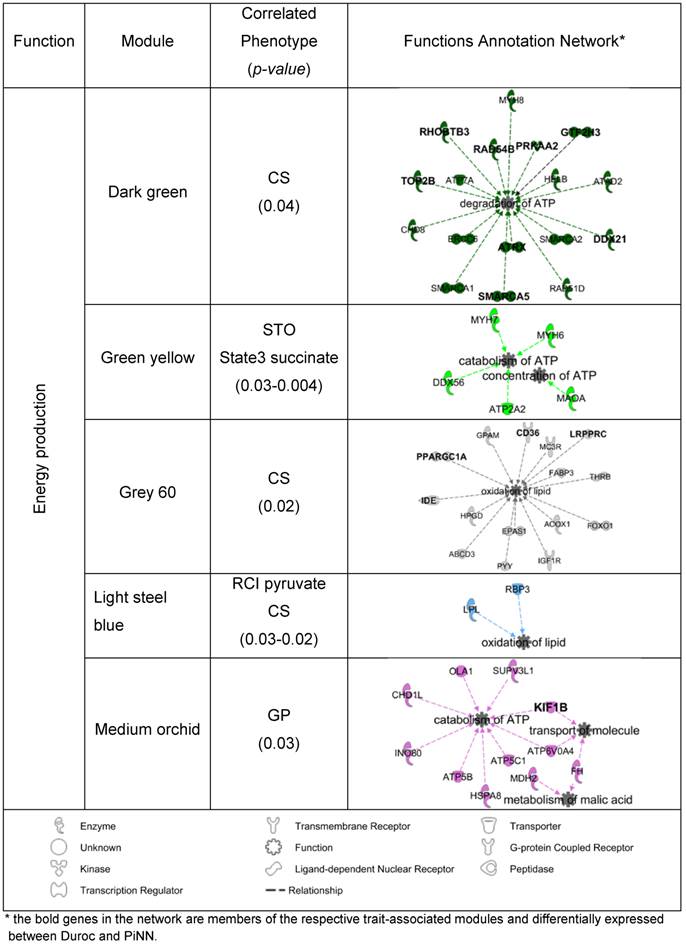
To identify potential candidate genes that may play important roles in energy metabolism in the muscle, the co-expression modules that were significantly correlated with the trait measurements of mitochondrial respiration activity, enzyme activities, and adenine nucleotide concentration (p<0.05) were associated to the functional category 'energy production' using the IPA enrichment. In Duroc pigs, 4 out of 11 modules were linked to 'energy production' together with its functions annotation network, as shown in Table 5. Of these, module dark-red was correlated with RCI pyruvate (r= -0.68, p=0.03); green-yellow with Complex I (r=0.72, p=0.02) and COX (r=0.86 p=0.002); dark-orange with GP (r= -0.68, p=0.03) and AMP (r= -0.66, p=0.04); and purple with LDH (r= -0.75, p=0.01). In PiNN pigs, 5 out of 11 modules were associated with 'energy production' together with its functions annotation network (Table 6). These were (module/trait) dark-green/CS (r=0.66, p=0.04), green-yellow/State 3 Succinate (r=0.7, p=0.03), grey 60/CS (r=0.71, p= 0.02), light-steel-blue/RCI pyruvate (r= 0.67, p=0.03), light-steel-blue/CS (r=0.72, p=0.02), and medium-orchid/GP (r=0.67, p=0.03). Several gene members of these significant trait-correlated modules were also differentially expressed between Duroc and PiNN: LRPPRC, PPARGC, (see also Tables 5 and 6).
Gene co-expression modules associated with energy production in Ingenuity Pathway Analysis (IPA) for Duroc
Gene co-expression modules associated with energy production in Ingenuity Pathway Analysis (IPA) for Pietrain (PiNN)
qRT-PCR validation
The expression of ATP6V1C1, ATP6V1E1, COX10, COX7A2, CYB5A, NDUFS1, NDUFS6, and PPA1 were validated by qPCR. The correlation coefficient between qPCR and microarray data ranged from 0.59 (p<0.006) to 0.81 (p<0.0001), suggesting a good concordance between microarray and qPCR results, as shown in Figure 4.
qPCR validation of microarray results for eight genes: ATP6V1C1, ATP6V1E1, COX10, COX7A2, CYB5A, NDUFS1, NDUFS6, and PPA1. Plot between qPCR (2^-∆Ct on the x-axis) and microarray (log2 signals on the y-axis) for each gene. The corresponding correlation coefficient (r) and p values are shown.

Discussion
Duroc and Pietrain breeds are divergent for muscle characteristics and meat quality. Pietrain pigs are more muscular and lean, whereas Duroc pigs are fattier and preferable for marbling. Mutations in the ryanodine receptor (RYR1), frequently carried in Pietrain pigs, have impacts on meat quality, stress resistance, and carcass composition. RYR1 is a calcium channel expressed primarily in skeletal muscle. The RYR1 mutation c.1840C>T (p.Arg614Cys) in pigs causes a dysregulation of the calcium-flux leading to early energy depletion, AMPK activation, accelerated glycolysis and an increased incidence of pale, soft, exudative (PSE) meat [13, 14]. In this study, MHS homozygous-negative pigs were used avoid an effect from the RYR1 locus. The muscle samples from Duroc pigs showed a higher percentage of STO and lower percentage of FTO fibers, with no difference for FTG fibers compared to PiNN pigs. This observation agrees well with previous reports with a bigger sample size, except for the percentage of FTG fibers, which was higher in PiNN pigs [6, 8, 15, 16]. Muscles containing more STO fibers are associated with higher oxidative enzyme activities and mitochondrial respiration activity [17]; muscles comprised of more FTG fibers are associated with higher glycolytic enzyme activities [6, 18]. Lipids are stored mainly in STO fibers [19], which can improve the tenderness and juiciness of the meat. Selection towards a high percentage of FTG fibers for meat production may therefore result in altered meat quality possibly due to lower capillarization and insufficient delivery of oxygen [20] or glycogen depletion, which ultimately influence meat toward dry, firm, and dark [21]. The understanding of the molecular basis of muscle fiber type and metabolic capacity is important and may have implications on meat production and meat quality.
DEGs revealed differences in the canonical pathways between Duroc and PiNN
Protein turnover is essential to gaining muscle mass. Three major proteolytic mechanisms in muscle are the ATP-dependent ubiquitin proteasome system (UPS), Ca2+-dependent-calpain system, and lysosomal proteasomes. In our present results, the protein ubiquitination pathway was among the top canonical pathways up-regulated in Duroc. The UPS is known as a principle regulator of muscle atrophy [22]. Protein ubiquitination is an ATP-dependent process mediated by ubiquitin-activating enzyme E1, specific ubiquitin-conjugating-enzyme E2, and ubiquitin protein ligase E3, which promote protein degradation via the 26s proteasome and has implications on meat quality [23-26]. Interestingly, amyloid processing was listed as a top canonical pathway in up-regulated DEGs of PiNN. Amyloid processing has been associated with glucose uptake, and oxidation in myotubes [27, 28]. DEGs in amyloid processing, like CSNK1E, CAPN6, AKT1, CDK5, APH1A, MAPT, PSENEN, and CAPN3 have implications in muscle biology of the pig. PSENEN encodes Presenilin, a component of the gamma-secretase protein complex that is required for the processing of the beta-amyloid precursor protein to generate amyloid beta (Abeta). Abeta inhibits the proteolytic activities of the 26S proteasome and the interplay of Abeta and UPS is associated with Alzheimer's disease [27]. Mutations in PSENEN disrupt cellular Ca2+ homeostasis via the regulation of ryanodine receptors (RYR), sarcoendoplasmic reticulum Ca2+ transport ATPase (SERCA), and/or inositol 1,4,5-trisphosphate channels, all of which are crucial regulators of Ca2+ release [29-32]. PSENEN has been identified as a potential candidate gene for meat quality [33, 34].
AKT1, a serine threonine protein kinase, is a critical mediator of cell growth and survival. AKT1 transgene activation promotes type IIb fiber hypertrophy and increases glycolysis while reducing fat accumulation [35, 36]. The up-regulation of AKT1 in PiNN may have a functional link to its leanness. The calpain system target proteins are involved in assembly and scaffolding of myofibrillar proteins such as titin [37]. Its activation promotes disassembly of myofilaments from intact myofibrillar proteins and permits the degradation of these sarcomeric proteins by UPS [38]; it is also involved in the regulation of muscle mass [39]. Calpain-3 (CAPN3) is a calcium-dependent cysteine protease expressed in muscle. Mutations in calpain-3 cause Limb-Girdle Muscular Dystrophy Type 2A (LGMD2A) [40]. Immature muscle observed in calpain-3 overexpressing transgenic mice suggests a role for this protein in muscle maturation [41]. Calpain-3 may play a role in sarcomere maintenance and organization by acting upstream of the UPS; its absence results in death of muscle fibers [42, 43]. Calpain-6 (CAPN6) is a suppressor of muscle cell differentiation, and its deficiency promotes skeletal muscle development and regeneration [44].
DEGs revealed differences in the functional categories of muscle metabolism between Duroc and PiNN
Peroxisome proliferator-activated receptor gamma coactivator 1 alpha (PPARGC1A) and protein phosphatase 3 catalytic subunit alpha isoform (PPP3CA) were up-regulated in Duroc compared to PiNN. PPARGC1A activation promotes the slow, oxidative myogenic program in mice [45] and drives the formation of slow-twitch muscle fibers in cultured muscle cells [46]. It also acts as a master coordinator to control mitochondrial biogenesis and oxidative phosphorylation [47]. Hence, PPARGC1A may provide a link between muscle fiber type and energy metabolism. PPP3CA is differentially expressed in muscles comprised of different proportions of fast and slow muscle fibers [48]. CD36 mediates uptake of long-chain fatty acid and thus plays a role in lipid accumulation and fatty acid homeostasis [49, 50]. Sarcalumenin (SRL) and fast twitch Ca2+ ATPase (ATP2A1) have been reported as fast-type muscle genes [51]. The up-regulation of these two genes support the high percentage of fast-twitch glycolytic muscle fibers in PiNN. Fructose 2, 6-bisphosphatase 2 (PEKFB2), up-regulated in PiNN, can promote glycolysis by controlling the level of Fructose 2, 6 - bisphosphate, which is an allosteric activator of phosphofructokinase (PFK-1) [52]. Glycogen synthase kinase 3 alpha (GSK3A) and glycogen synthase 1 (GYS1) are crucial for glycogen storage and can influence the muscle-to-meat process via glycolysis, reduced pH, and pale color [53, 54]. Moreover, a high level of glycogen has been associated with a higher percentage of fast-twitch glycolytic fibers [55].
Gene co-expression networks link to oxidative capacity of skeletal muscle
Transcriptional network analysis identified 13 co-expression modules correlated with STO muscle fibers in Duroc pigs (p<0.05). Among these, module light-cyan showed a strong correlation with STO (Figure 2) and its members (9 genes) were enriched for 'extracellular matrix part' (Table 3). Of these COL3A1, COL5A2, COL6A1, and COL12A1 encode for type III, V, VI, and XII collagen, respectively. Collagens are major components of the extracellular matrix (ECM). Collagen-VI deficient Col6a1-/- mice show myopathic disorder and, most important, mitochondrial dysfunction [56]. Modules blue and green-yellow were positively correlated with STO, while negatively with correlated with FTG. These modules were enriched for 'mitochondrion' and 'mitochondrial part' GO terms. Mitochondria play a prominent role in ATP production and oxidative phosphorylation. Oxidative capacity of the muscle cells has been associated with muscle fiber types via mitochondrial volume and density [57], which is typically higher in slow-twitch type I fibers than fast-twitch type II fibers [58]. 182 genes of module blue and 45 genes of module green-yellow were enriched for 'mitochondrion' and 'mitochondrial part', respectively (Table 3). These genes are not only involved in mitochondrial biogenesis and functional maintenance, but also in the mitochondrial oxidation of fatty acids. SLC25A4 or ANT1 is a muscle-specific isoform. Adenine nucleotide translocators (ANT) regulates the adenine nucleotide concentration by translocating ADP and ATP between mitochondrial matrix and cytoplasm. It provides ADP for oxidative phosphorylation and is essential for mitochondrial function [59]. GFM1 (mitochondrial translation elongation factor G1) is involved in oxidative phosphorylation disorder [60]. Many genes in modules blue and green-yellow are major components of the electron transport chain and important for oxidative phosphorylation to produce ATP [NDUFV2, NDUFV3, NDUFS1, NDUFS4, NDUFS6, NDUFS7, NDUFB2, NDUFB3, NDUFB4, NDUFB8, NDUFB11, NDUFA5, NDUFA10, and NDUFA11 (encode for Complex I); SDHA and SDHB (encode for Complex II); COX7A1 and COX4l1 (encode for COX); ATP5L, ATP5J, ATP5G2, ATP5G3, ATP5A1, and ATP5C1 (encode for ATP synthase)]. Moreover, many genes were associated with lipid metabolism and mitochondrial oxidation of fatty acids like acyl-CoA synthetase long-chain family member ACSL1, ACSL3, ACSL4, and ACSL5, which encode the long-chain fatty-acid-coenzyme A ligase family members. Particularly, ACSL1 interacts with carnitine palmitoyltransferase 1a (CPT1a) and voltage-dependent anion channel (VDAC) to transfer the activated fatty acids through the mitochondrial outer membrane and to catalyze fatty acid oxidation [61]. It contributes 80% of total ACSL activity and is important for mitochondrial beta-oxidation of long-chain fatty acids in adipose tissue, liver, and skeletal muscle [62-64]. HADH and HADHB are members of the 3-hydroxyacyl-CoA dehydrogenase gene family. The encoded proteins catalyze the oxidation of straight-chain 3-CoAs as part of the beta-oxidation pathway in the mitochondrial matrix. Beta-oxidation of FAs could be influenced by the interaction between estrogen receptor alpha and HADHB [65]. Altogether, genes in these modules are involved in various functions including nucleotide transport, mitochondrial (mt) translation, OXPHOS subunits formation, mt membrane biogenesis, and mt oxidation of fatty acids. Overall, these gene modules link mitochondrial functions to oxidative capacity of the skeletal muscle. It is of interest whether the up-regulation of these genes in Duroc pigs also implies a predominant role of oxidative capacity and respiration activity in Duroc over PiNN.
Gene co-expression networks link to mitochondrial respiration activity and ATP synthesis
In Duroc pigs, 4 modules were enriched for energy production. Genes belonging to these modules are potential factors that control mitochondrial respiration and ATP synthesis, components of the respiratory chain, hormones and transcription factors. NDUFS1 encodes NADH dehydrogenase involved in the mitochondrial respiration chain. ATP5A1 encodes alpha unit of ATP synthase F1 unit. Deficiency of these genes affects functional complex I and/or ATP synthase and results in decreased ATP production [66-68]. Insulin regulates stimulation of protein synthesis and lipid and glucose storage [69]. Insulin receptor (INSR) and insulin receptor substrate 2 (IRS2) are major molecules mediating insulin-signaling pathways. The effect of insulin on skeletal muscle mitochondrial function and oxidative capacity has been shown. Insulin increases ATP production as well as the mRNA level and enzyme activities of complex I and COX [70]. Thyroid hormone receptor beta (THRB) encodes one of the nuclear hormone receptors for thyroid hormone. The overexpression of thyroid hormone receptor in myoblast stimulates both cytochrome oxidase and citrate synthase activities [71]. Thyroid hormone has been shown to increase ATP production as well as citrate synthase and cytochrome c oxidase activities in muscle tissue [72] and influences both nuclear and mitochondrial genes in respiratory functions [73, 74].
In PiNN pigs, 5 modules were enriched for energy production. Some genes belonging to these modules are regarded as potentially regulating the respiratory chain, hormones, and transcription factors. ATP5B and ATP5C1 encode the beta and gamma units of ATP synthase F1. They are essential for the fully assembled and functional ATP synthase and, therefore, ATP production. PPARGC1A, as a transcriptional co-activator regulating genes in energy metabolism, activates the expression of nuclear respiratory factors (NRFs), promotes mitochondrial biogenesis, and stimulates coupled respiration [75]. In cultured myotubes, PGC-1 activates the expression of mitochondrial respiratory chain COXIV and ATP synthase as well as mtTFA through the induction of NRF-1 and NRF-2 expression [76, 77]. The activated mtTFA translocates into mitochondria and directly activates the transcription and replication of mtDNA [76, 77]. Leucine-rich pentatricopeptide repeat containing (LRPPRC) deficiency affects the stability of most mitochondrial mRNAs and leads to COX deficiency and ATP synthase deficiency associated with reduced ATP production in conditional knockout mouse heart [78].
Gene expression profiling by microarray is restricted on transcript level. Events such as post-transcriptional regulation and protein modification could contribute to molecular mechanisms. Proteome and metabolome analysis could provide insight on the molecular basis related to energy metabolism in muscle. To further validate whether any candidate gene plays a role in energy metabolism, an in vitro model system can be set up to perform enzymatic functional assay by mutation or silencing certain genes.
Conclusions
In the present study, a comparative transcriptome profiling of ante mortem skeletal muscle between Duroc and PiNN revealed clear differences in their muscle metabolic properties. Gene co-expression network analysis highlights the importance of mitochondria in the oxidative capacity of muscle. In particular, the Duroc breed showed more clear molecular function involved in oxidative capacity and respiration activity than PiNN. In contrast to PiNN, co-expression modules enriched in macromolecule catabolic process, actin cytoskeleton, and transcription activator activity were associated with fiber types, mitochondrial respiratory activity, and metabolic enzyme activities. Our results highlight the importance of mitochondria for the oxidative capacity of the porcine muscle, particularly in providing breed-specific processes for the molecular pathways in muscle cell fibers, and muscle biology.
Abbreviations
STO: slow-twitch oxidative; FTO: fast-twitch oxidative; FTG: fast-twitch glycolytic; ATP: adenosine triphosphate; WGCNA: weighted gene co-expression network analysis; PiNN: malignant hyperthermia syndrome (MHS)-negative Pietrain; LM: longissimus muscle; Th: thoracic vertebrae; RMA: robust multichip average; DABG: detection above background; FDR: false discovery rate; TOM: topological overlap matrix; qPCR: quantitative polymerase chain reaction; MRA: mitochondrial respiratory activity; RCI: respiratory control index; GO: gene ontology.
Supplementary Material
Tables S1-S5.
Acknowledgements
The authors thank A. Jugert and J. Bittner for excellent technical help.
Competing Interests
The authors have declared that no competing interest exists.
References
1. Hocquette JF, Ortigues-Marty I, Pethick D, Herpin P, Fernandez X. Nutritional and hormonal regulation of energy metabolism in skeletal muscles of meat-producing animals. Livest Pro Sci. 1998;56:115-43
2. Hocquette J, Ortigues-Marty I, Vermorel M. Manipulation of tissue energy metabolism in meat-producing ruminants. Asian Australas J AnimSci. 2001;14:720-32
3. Pearson A. Introduction to quality attributes and their measurement in meat, poultry and fish products. Quality attributes and their measurement in meat, poultry and fish products. Springer. 1994:1-33
4. Davoli R, Braglia S, Russo V, Varona L, te Pas MF. Expression profiling of functional genes in prenatal skeletal muscle tissue in Duroc and Pietrain pigs. J Anim Breed Genet. 2011;128:15-27 doi:10.1111/j.1439-0388.2010.00867.x
5. Murani E, Muraniova M, Ponsuksili S, Schellander K, Wimmers K. Identification of genes differentially expressed during prenatal development of skeletal muscle in two pig breeds differing in muscularity. BMC Dev Biol. 2007;7:109. doi:10.1186/1471-213x-7-109
6. Werner C, Natter R, Wicke M. Changes of the activities of glycolytic and oxidative enzymes before and after slaughter in the longissimus muscle of Pietrain and Duroc pigs and a Duroc-Pietrain crossbreed. J Anim Sci. 2010;88:4016-25
7. Krischek C, Natter R, Wigger R, Wicke M. Adenine nucleotide concentrations and glycolytic enzyme activities in longissimus muscle samples of different pig genotypes collected before and after slaughter. Meat Sci. 2011;89:217-20
8. Werner C, Natter R, Schellander K, Wicke M. Mitochondrial respiratory activity in porcine longissimus muscle fibers of different pig genetics in relation to their meat quality. Meat Sci. 2010;85:127-33
9. Langfelder P, Horvath S. WGCNA: an R package for weighted correlation network analysis. BMC Bioinformatics. 2008;9:559
10. Benjamini Y, Hochberg Y. Controlling the false discovery rate: a practical and powerful approach to multiple testing. J R Stat Soc Series B Stat Methodol. 1995;57:289-300
11. Ponsuksili S, Du Y, Hadlich F, Siengdee P, Murani E, Schwerin M. et al. Correlated mRNAs and miRNAs from co-expression and regulatory networks affect porcine muscle and finally meat properties. BMC Genomics. 2013;14:533
12. Zhang B, Horvath S. A general framework for weighted gene co-expression network analysis. Stat Appl Genet Mol Biol. 2005;4:Article17
13. Yue G, Stratil A, Kopecny M, Schröffelova D, Schröffel J, Hojny J. et al. Linkage and QTL mapping for Sus scrofa chromosome 6. J Anim Breed Genet. 2003;120:45-55
14. Shen Q, Underwood K, Means W, McCormick R, Du M. The halothane gene, energy metabolism, adenosine monophosphate-activated protein kinase, and glycolysis in postmortem pig longissimus dorsi muscle. J Anim Sci. 2007;85:1054-61
15. Chang KC, da Costa N, Blackley R, Southwood O, Evans G, Plastow G. et al. Relationships of myosin heavy chain fibre types to meat quality traits in traditional and modern pigs. Meat Sci. 2003;64:93-103
16. Wimmers K, Ngu NT, Jennen DG, Tesfaye D, Murani E, Schellander K. et al. Relationship between myosin heavy chain isoform expression and muscling in several diverse pig breeds. J Anim Sci. 2008;86:795-803
17. Gueguen N, Lefaucheur L, Fillaut M, Vincent A, Herpin P. Control of skeletal muscle mitochondria respiration by adenine nucleotides: differential effect of ADP and ATP according to muscle contractile type in pigs. Comp Biochem Physiol B Biochem Mol Biol. 2005;140:287-97
18. Huber K, Petzold J, Rehfeldt C, Ender K, Fiedler I. Muscle energy metabolism: structural and functional features in different types of porcine striated muscles. J Muscle Res Cell Motil. 2007;28:249-58
19. Essen-Gustavsson B, Karlsson A, Lundstrom K, Enfalt AC. Intramuscular fat and muscle fibre lipid contents in halothane-gene-free pigs fed high or low protein diets and its relation to meat quality. Meat Sci. 1994;38:269-77
20. Karlsson AH, Klont RE, Fernandez X. Skeletal muscle fibres as factors for pork quality. Livest Prod Sci. 1999;60:255-69
21. Karlsson A, Essen-Gustavsson B, Lundstrom K. Muscle glycogen depletion pattern in halothane-gene-free pigs at slaughter and its relation to meat quality. Meat Sci. 1994;38:91-101
22. Lecker SH, Solomon V, Mitch WE, Goldberg AL. Muscle protein breakdown and the critical role of the ubiquitin-proteasome pathway in normal and disease states. J Nutr. 1999;129:227S-37S
23. Murton AJ, Constantin D, Greenhaff PL. The involvement of the ubiquitin proteasome system in human skeletal muscle remodelling and atrophy. Biochim Biophys Acta. 2008;1782:730-43
24. Huynh TP, Murani E, Maak S, Ponsuksili S, Wimmers K. UBE3B and ZRANB1 polymorphisms and transcript abundance are associated with water holding capacity of porcine M. longissimus dorsi. Meat Sci. 2013;95:166-72
25. Loan H, Murani E, Maak S, Ponsuksili S, Wimmers K. Novel SNPs of the porcine TRIP12 are associated with water holding capacity of meat. Czech Journal of Animal Science. 2013;58:525-33
26. Loan HT, Murani E, Maak S, Ponsuksili S, Wimmers K. UBXN1 polymorphism and its expression in porcine M. longissimus dorsi are associated with water holding capacity. Mol Biol Rep. 2014;41:1411-8
27. Hong L, Huang HC, Jiang ZF. Relationship between amyloid-beta and the ubiquitin-proteasome system in Alzheimer's disease. Neurol Res. 2014;36:276-82
28. Hamilton DL, Findlay JA, Montagut G, Meakin PJ, Bestow D, Jalicy SM. et al. Altered amyloid precursor protein processing regulates glucose uptake and oxidation in cultured rodent myotubes. Diabetologia. 2014;57:1684-92
29. Chan SL, Mayne M, Holden CP, Geiger JD, Mattson MP. Presenilin-1 mutations increase levels of ryanodine receptors and calcium release in PC12 cells and cortical neurons. J Biol Chem. 2000;275:18195-200
30. Green KN, Demuro A, Akbari Y, Hitt BD, Smith IF, Parker I. et al. SERCA pump activity is physiologically regulated by presenilin and regulates amyloid beta production. J Cell Biol. 2008;181:1107-16
31. Landman N, Jeong SY, Shin SY, Voronov SV, Serban G, Kang MS. et al. Presenilin mutations linked to familial Alzheimer's disease cause an imbalance in phosphatidylinositol 4,5-bisphosphate metabolism. Proc Natl Acad Sci U S A. 2006;103:19524-9
32. Ferreira IL, Bajouco LM, Mota SI, Auberson YP, Oliveira CR, Rego AC. Amyloid beta peptide 1-42 disturbs intracellular calcium homeostasis through activation of GluN2B-containing N-methyl-d-aspartate receptors in cortical cultures. Cell Calcium. 2012;51:95-106
33. MacLennan DH, Phillips MS. Malignant hyperthermia. Science. 1992;256:789-94
34. Ponsuksili S, Murani E, Trakooljul N, Schwerin M, Wimmers K. Discovery of candidate genes for muscle traits based on GWAS supported by eQTL-analysis. Int J Biol Sci. 2014;10:327-37
35. Cheng KK, Akasaki Y, Lecommandeur E, Lindsay RT, Murfitt S, Walsh K. et al. Metabolomic analysis of akt1-mediated muscle hypertrophy in models of diet-induced obesity and age-related fat accumulation. J Proteome Res. 2015;14:342-52
36. Izumiya Y, Hopkins T, Morris C, Sato K, Zeng L, Viereck J. et al. Fast/Glycolytic muscle fiber growth reduces fat mass and improves metabolic parameters in obese mice. Cell Metab. 2008;7:159-72
37. Huang J, Forsberg NE. Role of calpain in skeletal-muscle protein degradation. Proc Natl Acad Sci U S A. 1998;95:12100-5
38. Powers SK, Kavazis AN, DeRuisseau KC. Mechanisms of disuse muscle atrophy: role of oxidative stress. Am J Physiol Regul Integr Comp Physiol. 2005;288:R337-44
39. Otani K, Han DH, Ford EL, Garcia-Roves PM, Ye H, Horikawa Y. et al. Calpain system regulates muscle mass and glucose transporter GLUT4 turnover. J Biol Chem. 2004;279:20915-20
40. Richard I, Broux O, Allamand V, Fougerousse F, Chiannilkulchai N, Bourg N. et al. Mutations in the proteolytic enzyme calpain 3 cause limb-girdle muscular dystrophy type 2A. Cell. 1995;81:27-40
41. Spencer MJ, Guyon JR, Sorimachi H, Potts A, Richard I, Herasse M. et al. Stable expression of calpain 3 from a muscle transgene in vivo: immature muscle in transgenic mice suggests a role for calpain 3 in muscle maturation. Proc Natl Acad Sci U S A. 2002;99:8874-9
42. Duguez S, Bartoli M, Richard I. Calpain 3: a key regulator of the sarcomere? FEBS J. 2006;273:3427-36
43. Kramerova I, Kudryashova E, Venkatraman G, Spencer MJ. Calpain 3 participates in sarcomere remodeling by acting upstream of the ubiquitin-proteasome pathway. Hum Mol Genet. 2005;14:2125-34
44. Tonami K, Hata S, Ojima K, Ono Y, Kurihara Y, Amano T. et al. Calpain-6 deficiency promotes skeletal muscle development and regeneration. PLoS Genet. 2013;9:e1003668
45. Ljubicic V, Burt M, Lunde JA, Jasmin BJ. Resveratrol induces expression of the slow, oxidative phenotype in mdx mouse muscle together with enhanced activity of the SIRT1-PGC-1alpha axis. Am J Physiol Cell Physiol. 2014;307:C66-82
46. Lin J, Wu H, Tarr PT, Zhang CY, Wu Z, Boss O. et al. Transcriptional co-activator PGC-1 alpha drives the formation of slow-twitch muscle fibres. Nature. 2002;418:797-801
47. LeBleu VS, O'Connell JT, Gonzalez Herrera KN, Wikman H, Pantel K, Haigis MC. et al. PGC-1alpha mediates mitochondrial biogenesis and oxidative phosphorylation in cancer cells to promote metastasis. Nat Cell Biol. 2014;16:992-1003 1-15
48. Wan L, Ma J, Xu G, Wang D, Wang N. Molecular cloning, structural analysis and tissue expression of protein phosphatase 3 catalytic subunit alpha isoform (PPP3CA) gene in Tianfu goat muscle. Int J Mol Sci. 2014;15:2346-58
49. Angin Y, Steinbusch LK, Simons PJ, Greulich S, Hoebers NT, Douma K. et al. CD36 inhibition prevents lipid accumulation and contractile dysfunction in rat cardiomyocytes. Biochem J. 2012;448:43-53
50. Samovski D, Sun J, Pietka T, Gross RW, Eckel RH, Su X. et al. Regulation of AMPK activation by CD36 links fatty acid uptake to beta-oxidation. Diabetes. 2015;64:353-9
51. Wu W, Ren Z, Zhang L, Liu Y, Li H, Xiong Y. Overexpression of Six1 gene suppresses proliferation and enhances expression of fast-type muscle genes in C2C12 myoblasts. Mol Cell Biochem. 2013;380:23-32
52. Ros S, Schulze A. Balancing glycolytic flux: the role of 6-phosphofructo-2-kinase/fructose 2,6-bisphosphatases in cancer metabolism. Cancer Metab. 2013;1:8
53. Monin G, Sellier P. Pork of low technological quality with a normal rate of muscle pH fall in the immediate post-mortem period: The case of the Hampshire breed. Meat Sci. 1985;13:49-63
54. Bowker B, Grant A, Forrest J, Gerrard D. Muscle metabolism and PSE pork. J Anim Sci. 2000;79:1-8
55. Fernandez X, Lefaucheur L, Candek M. Comparative study of two classifications of muscle fibres: Consequences for the photometric determination of glycogen according to fibre type in red and white muscle of the pig. Meat Sci. 1995;41:225-35
56. Irwin WA, Bergamin N, Sabatelli P, Reggiani C, Megighian A, Merlini L. et al. Mitochondrial dysfunction and apoptosis in myopathic mice with collagen VI deficiency. Nat Genet. 2003;35:367-71
57. Schwerzmann K, Hoppeler H, Kayar SR, Weibel ER. Oxidative capacity of muscle and mitochondria: correlation of physiological, biochemical, and morphometric characteristics. Proc Natl Acad Sci U S A. 1989;86:1583-7
58. Picard M, Hepple RT, Burelle Y. Mitochondrial functional specialization in glycolytic and oxidative muscle fibers: tailoring the organelle for optimal function. Am J Physiol Cell Physiol. 2012;302:C629-41
59. Kawamata H, Tiranti V, Magrane J, Chinopoulos C, Manfredi G. adPEO mutations in ANT1 impair ADP-ATP translocation in muscle mitochondria. Hum Mol Genet. 2011;20:2964-74
60. Coenen MJ, Antonicka H, Ugalde C, Sasarman F, Rossi R, Heister JG. et al. Mutant mitochondrial elongation factor G1 and combined oxidative phosphorylation deficiency. N Engl J Med. 2004;351:2080-6
61. Lee K, Kerner J, Hoppel CL. Mitochondrial carnitine palmitoyltransferase 1a (CPT1a) is part of an outer membrane fatty acid transfer complex. J Biol Chem. 2011;286:25655-62
62. Ellis JM, Li LO, Wu PC, Koves TR, Ilkayeva O, Stevens RD. et al. Adipose acyl-CoA synthetase-1 directs fatty acids toward beta-oxidation and is required for cold thermogenesis. Cell Metab. 2010;12:53-64
63. Li LO, Ellis JM, Paich HA, Wang S, Gong N, Altshuller G. et al. Liver-specific loss of long chain acyl-CoA synthetase-1 decreases triacylglycerol synthesis and beta-oxidation and alters phospholipid fatty acid composition. J Biol Chem. 2009;284:27816-26
64. Li LO, Grevengoed TJ, Paul DS, Ilkayeva O, Koves TR, Pascual F. et al. Compartmentalized acyl-CoA metabolism in skeletal muscle regulates systemic glucose homeostasis. Diabetes. 2015;64:23-35
65. Zhou Z, Zhou J, Du Y. Estrogen receptor alpha interacts with mitochondrial protein HADHB and affects beta-oxidation activity. Mol Cell Proteomics. 2012;11:M111 011056
66. Martin MA, Blazquez A, Gutierrez-Solana LG, Fernandez-Moreira D, Briones P, Andreu AL. et al. Leigh syndrome associated with mitochondrial complex I deficiency due to a novel mutation in the NDUFS1 gene. Arch Neurol. 2005;62:659-61
67. Rybalka E, Timpani CA, Cooke MB, Williams AD, Hayes A. Defects in mitochondrial ATP synthesis in dystrophin-deficient mdx skeletal muscles may be caused by complex I insufficiency. PLoS One. 2014;9:e115763
68. Hejzlarova K, Mracek T, Vrbacky M, Kaplanova V, Karbanova V, Nuskova H. et al. Nuclear genetic defects of mitochondrial ATP synthase. Physiol Res. 2014;63(Suppl 1):S57-71
69. Cheng Z, Tseng Y, White MF. Insulin signaling meets mitochondria in metabolism. Trends Endocrinol Metab. 2010;21:589-98
70. Stump CS, Short KR, Bigelow ML, Schimke JM, Nair KS. Effect of insulin on human skeletal muscle mitochondrial ATP production, protein synthesis, and mRNA transcripts. Proc Natl Acad Sci U S A. 2003;100:7996-8001
71. Rochard P, Rodier A, Casas F, Cassar-Malek I, Marchal-Victorion S, Daury L. et al. Mitochondrial activity is involved in the regulation of myoblast differentiation through myogenin expression and activity of myogenic factors. J Biol Chem. 2000;275:2733-44
72. Short KR, Nygren J, Barazzoni R, Levine J, Nair KS. T(3) increases mitochondrial ATP production in oxidative muscle despite increased expression of UCP2 and -3. Am J Physiol Endocrinol Metab. 2001;280:E761-9
73. Pillar TM, Seitz HJ. Thyroid hormone and gene expression in the regulation of mitochondrial respiratory function. Eur J Endocrinol. 1997;136:231-9
74. Garesse R, Vallejo CG. Animal mitochondrial biogenesis and function: a regulatory cross-talk between two genomes. Gene. 2001;263:1-16
75. Lehman JJ, Barger PM, Kovacs A, Saffitz JE, Medeiros DM, Kelly DP. Peroxisome proliferator-activated receptor gamma coactivator-1 promotes cardiac mitochondrial biogenesis. J Clin Invest. 2000;106:847-56
76. Kang C, Li Ji L. Role of PGC-1alpha signaling in skeletal muscle health and disease. Ann N Y Acad Sci. 2012;1271:110-7
77. Wu Z, Puigserver P, Andersson U, Zhang C, Adelmant G, Mootha V. et al. Mechanisms controlling mitochondrial biogenesis and respiration through the thermogenic coactivator PGC-1. Cell. 1999;98:115-24
78. Mourier A, Ruzzenente B, Brandt T, Kuhlbrandt W, Larsson NG. Loss of LRPPRC causes ATP synthase deficiency. Hum Mol Genet. 2014;23:2580-92
Author contact
![]() Corresponding author: Siriluck Ponsuksili, Leibniz Institute for Farm Animal Biology Wilhelm-Stahl-Allee 2, 18196 Dummerstorf, Germany. Phone: +49 38208 68700; Fax: +49 38208 68702; Email: s.wimmersde
Corresponding author: Siriluck Ponsuksili, Leibniz Institute for Farm Animal Biology Wilhelm-Stahl-Allee 2, 18196 Dummerstorf, Germany. Phone: +49 38208 68700; Fax: +49 38208 68702; Email: s.wimmersde