Impact Factor ISSN: 1449-2288
- Issue 12; 2026
- Issue 11; 2026
- Issue 10; 2026
- Issue 9; 2026
- Issue 8; 2026
- Volume 22; 2026
- Past Issues
- Advance Articles
- Editorial Board
- Cover Images
- Index & Coverage
- Cover Suggestion
- Special Issues
Introduction
Materials and Methods
Results
Discussion
Supplementary Material
Acknowledgements
References

 Global reach, higher impact
Int J Biol Sci 2017; 13(12):1560-1569. doi:10.7150/ijbs.18830 This issue Cite
Research Paper
Metformin Sensitizes Non-small Cell Lung Cancer Cells to an Epigallocatechin-3-Gallate (EGCG) Treatment by Suppressing the Nrf2/HO-1 Signaling Pathway
Chenxiao Yu1,2,#, Yang Jiao1,2,#, Jiao Xue1,2,#, Qi Zhang1,2, Hongying Yang1,2, Ligang Xing3, Guangxia Chen4, Jinchang Wu5, Shuyu Zhang1,2,6, Wei Zhu1,2, ![]() , Jianping Cao1,2,
, Jianping Cao1,2, ![]()
1. School of Radiation Medicine and Protection, Medical College of Soochow University, Suzhou 215123, China
2. Collaborative Innovation Center of Radiation Medicine of Jiangsu Higher Education Institutions, Soochow University, Suzhou 215123, China
3. Department of Radiation Oncology, Shandong Cancer Hospital and Institute, Shandong University, Jinan, 250117, China
4. Department of Gastroenterology, First People's Hospital of Xuzhou, Xuzhou, 221002, China
5. Suzhou Cancer Center Core Laboratory, Nanjing Medical University Affiliated Suzhou Hospital, Suzhou 215001, China
6. Zhejiang Key Laboratory of Radiation Oncology, Zhejiang Cancer Hospital, Hangzhou 310022, China
# These authors contributed equally to this work.
Received 2016-12-19; Accepted 2017-10-8; Published 2017-11-27
Abstract

Non-small cell lung cancer (NSCLC) is the most common type of lung cancer. (-)-Epigallocatechin-3-gallate (EGCG), a major polyphenol in green tea, is widely studied as a cancer chemopreventive agent with potential anti-cancer effects. The NF-E2-related factor 2 (Nrf2)/heme oxygenase-1 (HO-1) signaling pathway is considered to mediate cellular resistance to EGCG. Metformin, a classical antidiabetic drug, has been shown to prevent cancer progression. Researchers have not reported whether metformin potentiates the anti-cancer efficacy of EGCG. In this study, metformin inhibited HO-1 expression and augmented the anti-tumor effect of EGCG. Metformin also enhanced ROS (reactive oxygen species) generation induced by EGCG (100 μM), subsequently resulting in apoptosis. Based on the results of the in vivo study, size of xenografts treated with the combination of metformin and EGCG was smaller than other groups. Mechanistically, metformin modulated the EGCG-activated Nrf2/HO-1 pathway through Sirtuin 1 (SIRT1)-dependent deacetylation of Nrf2. Moreover, metformin upregulated SIRT1 expression partially through the NF-kB pathway. Comparatively, the combination of EGCG and metformin showed little impact on normal lung epithelial BEAS-2B cells. Based on our findings, metformin sensitized NSCLC cells to the EGCG treatment by suppressing the Nrf2/HO-1 signaling pathway.
Keywords: non-small cell lung cancer (NSCLC), epigallocatechin-3-gallate (EGCG), 1-(diaminomethylidene)-3, 3-dimethylguanidine (metformin), NF-E2-related factor 2 (Nrf2), heme oxygenase-1 (HO-1)
Introduction
Lung cancer is the leading cause of cancer-related death worldwide [1, 2]. Non-small cell lung cancer (NSCLC) accounts for approximately 80-85 % of all cases of lung cancer and has a dismal 5-year survival rate, even with the development of chemotherapy and radiotherapy [1, 3].
According to epidemiological data, green tea consumption decreases the risk of human cancers [4-6]. Catechins are particularly concentrated in green tea (Camellia sinensis), comprising 30-40 % of its dry weight [7]. The major catechins contained in green tea are (-)-epigallocatechin-3-gallate (EGCG), (-)-epigallocatechin (EGC), (-)-epicatechin gallate (ECG), (-)-epicatechin (EC) and catechin. EGCG has been widely studied as a chemopreventive agent with potential anti-cancer effects [8, 9]. However, different tumor cells have different sensitivities to treatment with EGCG [9].
Heme oxygenase-1 (HO-1), also known as heat shock protein 32 (HSP32), is a cytoprotective protein. HO-1 catalyzes the degradation of the heme ring into carbon monoxide (CO), free iron, and biliverdin. HO-1 exerts cellular defense functions against various oxidative stresses through its antioxidant effects [9, 10]. In human cancers, HO-1 may increase the cellular resistance to EGCG and a wide variety of chemotherapeutic drugs [9, 11]. Among the green tea constituents, EGCG is reported to be the most potent inducer of HO-1 expression in an NF-E2-related factor-2 (Nrf2)-dependent manner [12]. Nrf2 is sequestered in the cytoplasm by Keap1 and subjected to constant degradation. The redox signal sensed by Keap1 results in the release of Nrf2 from Keap1 and activation of the Nrf2 signaling pathway by binding to the antioxidant-reactive element (ARE) of target genes [12, 13]. Post-translational modifications, including phosphorylation and acetylation, have been also reported to influence the transcriptional activity of Nrf2 [14-16]. Phosphorylation of the Serine-40 (S40) residue of Nrf2 is reported to facilitate Keap1/Nrf2 dissociation and Nrf2 nuclear translocation [14, 16]. The promoter region of the HO-1 gene harbors an ARE motif, which provides a binding site for Nrf2 [12, 17, 18]. The Nrf2/HO-1 signaling pathway has been reported to contribute to cellular resistance to EGCG [9].
Metformin (1-(diaminomethylidene)-3, 3-dimethylguanidine) is an oral antidiabetic drug in the biguanide class. It is the first-line drug of choice for the treatment of type 2 diabetes and is used by over 120 million patients worldwide [19-21]. According to retrospective studies, metformin may decrease the risk of cancer in patients with type 2 diabetes [22]. Based on the results from in vitro studies, metformin also inhibits the proliferation of prostate [23], ovarian [24] and breast cancer cells [25]. However, the anti-cancer mechanism of metformin is not completely understood. A well-accepted theory is that metformin inhibits complex I in the mitochondrial respiratory chain [26] and reduces ATP levels [27], thus activating AMP-activated protein kinase (AMPK) and inhibiting mammalian target of rapamycin (mTOR) [28], which leads to the inhibition of cancer cell proliferation [29, 30].
In this study, metformin sensitized NSCLC cells, but not normal cells, to EGCG by elevating ROS levels and apoptosis. Moreover, metformin inhibited Nrf2 acetylation and nuclear translocation and reduced HO-1 expression induced by EGCG. Mechanistically, metformin modulated the EGCG-activated Nrf2/HO-1 pathway through Sirtuin 1 (SIRT1)-dependent deacetylation of Nrf2.
Materials and Methods
Drugs, reagents and adenovirus
EGCG, ECG and EGC were purchased from Aladdin Chemical (Shanghai, China). Bovine serum albumin (BSA) and methylthiazolyldiphenyl-tetrazolium bromide (MTT) were purchased from Sigma Chemical Co. (St. Louis, MO). Metformin was purchased from Sangon Biotech (Shanghai, China). Antibodies against Nrf2, Ki-67, PARP-1 (poly(ADP-ribose) polymerase 1), PCNA (proliferating cell nuclear antigen) and β-actin were obtained from Santa Cruz Biotechnology (Santa Cruz, CA). Antibodies against HO-1, NF-kB p65 (phospho S536) and Caspase-3 (p-17) were purchased from Abcam Inc. (Cambridge, MA). Antibodies against SIRT1 and NF-kB p65 (RELA) were purchased from Proteintech (Rosemont, IL). The pan-acetyllysine antibody was purchased from PTM Biolabs Inc. (Hangzhou, China).
The Nrf2-overexpressing adenovirus (Ad-Nrf2), HO-1-overexpressing adenovirus (Ad-HO-1) and control adenovirus (Ad-NC) were designed and constructed by GeneChem (Shanghai, China). The SIRT1 siRNA (siSIRT1) and control siRNA (siNC) were purchased from GenePharma Co., Ltd. (Shanghai, China).
Cell Culture
The A549, H1299 and H460 human NSCLC cell lines, and BEAS-2B human bronchial epithelial cell line were used in this study. NSCLC cell lines were cultured in RPMI-1640 supplemented with 10 % fetal bovine serum (FBS), 1 % penicillin streptomycin and 1 mM sodium pyruvate. BEAS-2B cells were cultured in DMEM supplemented with 10% fetal bovine serum (FBS), 1 % penicillin streptomycin and 1 mM sodium pyruvate. These cells were grown at 37 °C in a humidified atmosphere with 5 % CO2.
Cell Viability Assay
Cells were seeded in 96-well plates (3 × 10³ cells/well) overnight, and then treated with various concentrations of EGCG, ECG, EGC or metformin. Then, 20 μL of MTT solution (2 mg/mL in PBS) were added to each well and incubated for 4 h at 37 °C. The supernatant was aspirated and the MTT-formazan crystals formed by metabolically viable cells were dissolved in 200 μL of DMSO. Finally, the absorbance was monitored at a wavelength of 490 nm using a microplate reader (Biotek, Winooski, VT).
LDH (Lactate dehydrogenase) Release Assay
LDH release was determined using an LDH cytotoxicity assay kit (Beyotime, Nantong, China), according to the manufacturer's instructions. The absorbance was measured at 490 nm using a microplate reader (Biotek, Winooski, VT).
Preparation of Cytosolic and Nuclear Extracts
Nucleic and cytosolic fractions were prepared using a Nuclear and Cytoplasmic Protein Extraction kit (Beyotime, Nantong, China). The collected cells were suspended in ice-cold hypotonic buffer and incubated on ice for 50 min. Extracts were centrifuged at 12,000 g for 5 min, and the supernatant was collected (cytosolic fraction). Pellets were washed with ice-cold hypotonic buffer and resuspended in lysis buffer, followed by sonication. Extracts were centrifuged at 12,000 g for 15 min, and the supernatant was collected (nuclear fraction).
Western Blot and Immunoprecipitation
After treatment, cells were placed on ice, washed twice with cold PBS (pH 7.4), and lysed in RIPA lysis buffer (Beyotime, Nantong, China). Cell lysates were centrifuged at 12,000 g for 15 min. For the immunoprecipitation assay, an antibody against Nrf2 was incubated with cell lysates overnight at 4 °C. Protein A+G Agarose (Beyotime, Nantong, China) was added for 1 h at 4 °C. Agarose was centrifuged and washed three times with RIPA lysis buffer. Lysates were centrifuged at 12,000 × g and then loaded onto an SDS-PAGE gel. Samples were electrophoresed for 2 h and transferred to PVDF membranes (Millipore, Bedford, MA). Membranes were blocked with a blocking buffer containing 3 % bovine serum albumin (BSA) in PBS at room temperature for 1 h. Membranes were incubated with the primary antibody overnight at 4 °C, followed by washes with PBST (PBS, 0.1 % Tween-20). Membranes were then incubated with a 1:2,000 dilution of the appropriate HRP-conjugated secondary antibody (Beyotime, Nantong, China) for 1 h at room temperature. After washes with PBST, blots were incubated with ECL-plus (Beyotime, Nantong, China) and detected using a FluorChem™ M System (Protein Simple, San Jose, CA).
Immunohistochemistry (IHC)
A549 xenograft tumor tissues were fixed with 10 % neutral-buffered formalin and embedded in paraffin. Three-micrometer paraffin sections were deparaffinized and heated in citrate buffer (pH 6.0) for 7 min using an epitope retrieval protocol. Tissues were incubated with rabbit anti-Nrf2 (1:200 dilution), anti-HO-1 (1:300 dilution), anti-Ki67 (1:200 dilution) or anti-PCNA (1:200 dilution) antibodies overnight at 4 °C, followed by an incubation with an anti-rabbit biotinylated secondary antibody (ZSGB-Bio, Beijing, China), a diaminobenzidine substrate for detection, washes, hematoxylin staining, dehydration and mounting.
Semi-quantitative determination of Nrf2, HO-1, PCNA and KI67 levels was performed according to the method described by Allred et al [31]. Briefly, the proportion of positively stained cells was rated as 0 = no cells were stained positive, 1 = between 0 % and 1 % positive, 2 = between 1 % and 10 %, 3 = between 10 % and 33 %, 4 = between 33 % and 66 %, and 5 = between 66 % and 100 %. In addition to the proportion score, an intensity score was generated based on the average intensity of staining: 0 = negative, 1 = weak, 2 = intermediate and 3 = strong. The intensity score and the proportion score were added to obtain the total score.
Immunofluorescence Assay
Cells were washed with PBS, fixed with 4 % formaldehyde and blocked with 1 % BSA/PBS for 1 h at room temperature. Then, cells were incubated with a primary antibody against Nrf2 (Abcam; ab62352) overnight at 4 °C and incubated with Cy3-conjugated secondary antibodies (Beyotime, Nantong, China) for 1 h at room temperature. DAPI (Sigma) was used to stain the nuclei and images were captured using an UltraViewVoX confocal microscope (PerkinElmer, Waltham, MA).
Cell Apoptosis Analysis
A549 cells (1 × 10⁶) were cultured in 6 cm dishes. Apoptosis was measured using the 7-AAD/Annexin-V double staining apoptosis kit (BD Biosciences, Franklin Lakes, NJ) and flow cytometry (BD Biosciences, CA). The Annexin-V+/7-AAD- cells were in the early phase of the apoptotic process; the Annexin-V+/7-AAD+ cells indicated late apoptosis. The percentage of apoptotic cells in each group was computed. Each group was assessed in triplicate.
In Vivo Studies
Female BALB/C nude mice (6-8 weeks of age) were purchased from the Shanghai SLAC Laboratory Animal Co., Ltd. (Shanghai, China). Mice were maintained in a pressurized ventilated cage according to institutional regulations. Nude mice were grafted with A549 cells (5 × 10⁵) in 100 μL of PBS via a subcutaneous injection. Mice were randomly divided into 4 groups (n = 3) and received one of the following treatments: (1) intraperitoneal injection of normal saline (negative control, every 2 days throughout the experiment starting on day 22); (2) metformin (200 μg/mL, diluted in drinking water and administered throughout the experiment starting on day 22); (3) intraperitoneal injection of EGCG (50 mg/kg, every 2 days throughout the experiment starting on day 22); (4) the combination of EGCG and metformin. Tumor volumes (means ± SEM; mm3) were measured at various times after the injection of cancer cells. Protocols for experiments involving animals were approved by the Animal Experimentation Ethics Committee at Soochow University.
Cell Transfection and Luciferase Assay
A luciferase vector containing the wild-type HO-1 promoter (~-5000 to -1, relative to the transcription start site) was constructed by Shanghai Biobuy Biotech Co., Ltd. (Shanghai, China). The plasmid was verified by sequencing. Cells were transfected with vectors using ExFectTM Transfection Reagent (Vazyme Biotech, Nanjing, China). Promoter activity was expressed as the ratio of firefly luciferase activity to Renilla luciferase activity (Promega, Madison, WI).
Statistical Analysis
Data are expressed as the means ± standard errors of the means (SEM) of at least three independent experiments. Data were then analyzed using Student's t-test when only two groups were compared or using one-way analysis of variance (ANOVA) when more than two groups were compared. Statistical analyses were performed using Prism 6 software (GraphPad, La Jolla, CA). Differences were considered significant at P < 0.01(*) and P < 0.001 (**).
Results
Metformin augmented the cytotoxicity of EGCG in NSCLC cells
Firstly, we compared the in vitro cytotoxicity of EGCG in three human NSCLC cell lines. Cells treated with EGCG (0-100 μM; 24 h) exhibited different dose-dependent degrees of cytotoxicity. With the exception of A549 cells, the treatment of all cells with EGCG (> 40 μM) for 24 h produced toxicity. However, A549 cells were still resistant to treatment with up to 100 μM EGCG for 24 h (Figs. 1A and S1C).
Metformin enhances the anti-proliferative effect of EGCG on NSCLC cells. (A) NSCLC cells (A549, H1299 and H460) were treated with different concentrations (0, 20, 40, 60, 80 and 100 μM) of EGCG for 24 h. Cell viability was measured using an MTT assay, as described in the Materials and Methods. The number of viable cells after treatment is expressed as a percentage of the control. (B) The level of the HO-1 protein in NSCLC cells (A549, H1299 and H460) was measured by Western blotting. (C) A549 cells were treated with indicated concentrations of metformin for 48 h, and cell viability was measured using an MTT assay. (D) A549 cells were treated with the indicated concentrations of metformin for 48 h, and the level of the HO-1 protein was detected by Western blotting. (E) A549 and (F) H460 cells were treated with the indicated concentrations of EGCG for 24 h after pre-treatment with 0.4 mM metformin for 48 h. Cell viability was measured using an MTT assay. (G) A549 cells were treated with EGCG and metformin, and the cell death rate was evaluated using an LDH release assay. (H) A549 cells were infected with a control adenovirus (Ad-NC) or HO-1-overexpressing adenovirus (Ad-HO-1) and then treated with EGCG and metformin. Cell viability was measured using an MTT assay. (I) A549 cells were infected with a control adenovirus (Ad-NC) or Nrf2-overexpressing adenovirus (Ad-Nrf2) and then treated with EGCG and metformin. Cell viability was measured using an MTT assay. *P < 0.01, ** P < 0.001 and N.S. (non-significant) compared with the control cells.
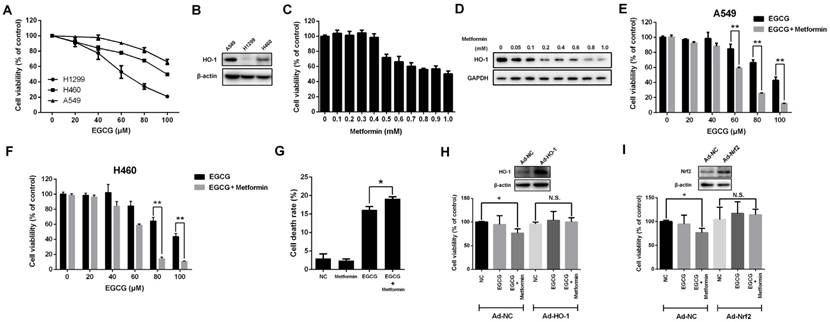
Since HO-1 overexpression is strongly associated with resistance to EGCG [9], we next investigated HO-1 expression in three human NSCLC cell lines. Compared with the other two NSCLC cell lines, HO-1 was expressed at the highest levels in A549 cells (Fig. 1B).
Next, we determined whether metformin influenced the viability of A549 cells. Metformin suppressed cell proliferation at concentrations greater than 0.4 mM (48 h) or 0.3 mM (72 h) (Figs. 1C and S1A and B). Since HO-1 is responsible for the resistance to EGCG, we investigated whether metformin affected the level of the HO-1 protein. Strikingly, HO-1 levels decreased significantly in metformin-treated cells in a dose-dependent manner (Fig. 1D). At a dose of 0.05 mM, metformin inhibited HO-1 expression. Moreover, when cells were treated with metformin at concentrations of 0.4 mM for 48 h, the level of the HO-1 protein was significantly reduced, without inhibiting the proliferation of A549 cells (Fig. 1C and D). Next, A549 cells were pre-treated with 0.4 mM metformin for 48 h and then treated with indicated concentration of EGCG (0-100 μM) for 24 h. Metformin enhanced the cytotoxicity of EGCG. After pre-treatment with 0.4 mM metformin, 60, 80 and 100 μM EGCG treatments induced significant cytotoxicity compared with treatment with EGCG alone (Fig. 1E). Moreover, similar results were also obtained in H460 cells (Fig. 1F). The LDH release assay also revealed that EGCG induced the death of A549 cells, and metformin enhanced this effect (Fig. 1G). Based on these results, treatment with 0.4 mM metformin for 48 h inhibited HO-1 expression and augmented the cytotoxicity of EGCG in NSCLC cells.
We overexpressed HO-1 using an adenovirus to confirm whether metformin enhanced the cytotoxic effect of EGCG by inhibiting HO-1 expression (Fig. 1H). HO-1 overexpression abrogated the synergistic effects of EGCG and metformin on A549 cells (Fig. 1H). Moreover, overexpression of Nrf2, a well-known transcriptional factor responsible for inducing HO-1 expression, also abolished the effects of EGCG and metformin on A549 cells (Fig. 1I). Thus, metformin enhanced the cytotoxicity of EGCG in NSCLC cells by inhibiting HO-1 expression.
Metformin increased intracellular ROS production and enhanced EGCG-induced apoptosis
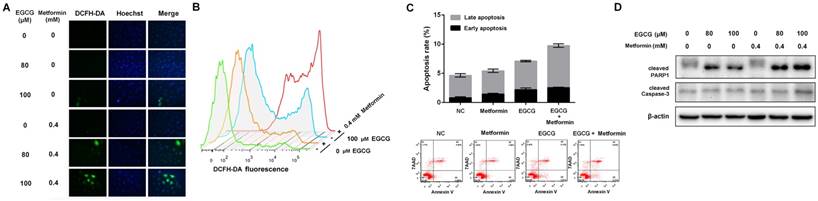
Based on accumulating evidence, EGCG (>50 μM) induces intracellular ROS production [32]. EGCG increased ROS levels, whereas metformin alone did not affect intracellular ROS levels. However, the combination of EGCG and metformin significantly increased the intracellular ROS levels compared with EGCG alone (Fig. 2A and 2B). Since EGCG is known to induce oxidative stress-mediated apoptosis [9], the apoptosis rate in A549 cells was evaluated after treatment with EGCG alone and the combination of EGCG plus metformin. Metformin did not induce apoptosis, and EGCG alone induced apoptosis in a small proportion of cells. However, the combination of EGCG with metformin slightly but significantly increased the apoptosis rate compared with EGCG alone (Fig. 2C). As further confirmation of these results, a Western blot assay was used to detect the changes in apoptosis-related proteins. Metformin alone did not influence the levels of these apoptosis-related proteins and EGCG slightly increased the levels of cleaved Caspase-3 and PARP1. Treatment with EGCG plus metformin further increased the levels of the apoptosis-related proteins cleaved Caspase-3 (p17) and PARP1 (Fig. 2D). Based on these data, metformin increased EGCG-induced intracellular ROS production and apoptosis.
Effects of EGCG and metformin on ROS production and apoptosis in NSCLC cells. A549 cells were treated with the indicated concentrations of EGCG and/or metformin. ROS were stained with DCFH-DA and measured using (A) a fluorescence microscope and (B) flow cytometry. (C) A549 cells were treated with EGCG and/or metformin. Cell apoptosis was analyzed by flow cytometry. (D) A549 cells were treated with the indicated concentrations of EGCG and/or metformin, and total cell lysates were subjected to a Western blot analysis of PARP1, cleaved PARP1 and cleaved Caspase-3.
The combination of metformin and EGCG inhibited tumor growth in vivo
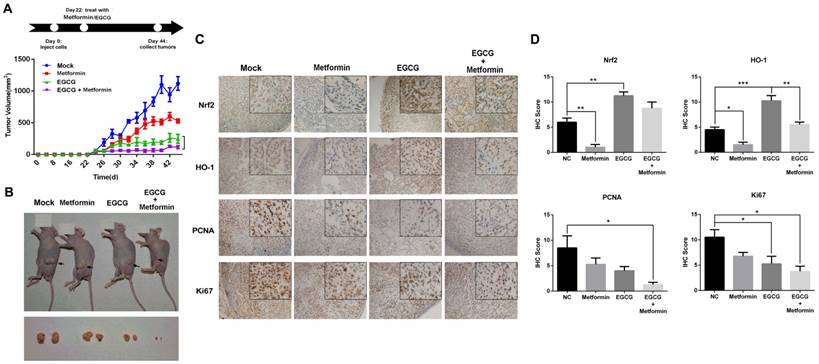
A549 xenografts were generated in nude mice to confirm the role of metformin in potentiating the effects of EGCG on NSCLC cell growth in vivo. As shown in Fig. 3A, nude mice were treated with normal saline (Mock, i.p.), EGCG (50 mg/kg, i.p.), metformin (200 μg/mL, dissolved in drinking water) or EGCG plus metformin beginning on day 22. Throughout the experiment, animals tolerated tumor grafting and drug treatment with no noticeable changes in behavior, eating habits or weight. Four days after the treatment was initiated, A549 xenografts treated with metformin, EGCG and the combination of the two began to show a significant inhibition of tumor growth rate compared with the untreated counterparts (Fig. 3A). On day 44, xenografts treated with metformin or EGCG alone were 44.07 ± 3.19 % and 19.62 ± 9.72 % the size of the control. The tumor volume in the nude mice subjected to the combined treatment (metformin plus EGCG) was 9.19 ± 3.14 % of the control (Fig. 3A and 3B). Consistent with these results, the combined treatment (metformin plus EGCG) showed weaker expression of Nrf2, HO-1, KI-67 and PCNA than the control (Mock), metformin or EGCG groups (Fig. 4C and 4D). Thus, metformin enhanced the anti-cancer effect of EGCG on NSCLC xenografts.
Effects of EGCG and metformin on the growth of A549 xenografts. (A) Balb/c nude mice were subcutaneously grafted with 1 × 10⁶ A549 cells. Treatment with metformin, EGCG or the combination was initiated on day 22. Tumor volumes were measured every 2 days for 44 days, as described in the Materials and Methods. (B) Representative images of xenograft-bearing nude mice (upper panel) and tumors (lower panel) on day 44. (C) Immunohistochemical staining for Nrf2, HO-1, PCNA and KI67 in tumors from the four groups. (D) Semi-quantitative determination of Nrf2, HO-1, PCNA and Ki67 expression. Briefly, the proportion of positively stained cells was rated as 0 = no cells were stained positive, 1 = between 0 % and 1 % positive, 2 = between 1 % and 10 %, 3 = between 10 % and 33 %, 4 = between 33 % and 66 %, and 5 = between 66 % and 100 %. In addition to the proportion score, an intensity score was calculated based on the average intensity of staining: 0 = negative, 1 = weak, 2 = intermediate and 3 = strong. The intensity score and the proportion score were added to obtain the total score.* P < 0.01 and ** P < 0.001.
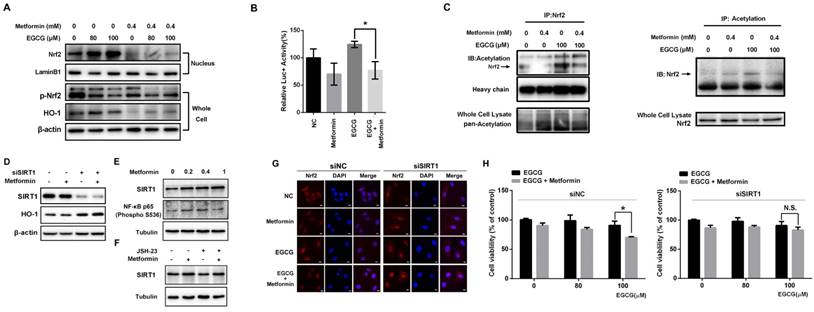
Metformin modulates the Nrf2/HO-1 signaling pathway. (A) EGCG promoted Nrf2 translocation from the cytosol to the nucleus in A549 cells. A549 cells were treated with the indicated concentrations (80 and 100 μM) of EGCG for 24 h after pre-treatment with 0.4 mM metformin for 48 h. Nuclear extracts were prepared and Western blots were performed using anti-Nrf2 and anti-HO-1 antibodies. β-actin and lamin B1 were used as internal controls. (B) A549 cells were transfected with a firefly luciferase reporter plasmid harboring the HO-1 promoter and then exposed to PBS (NC), EGCG (100 μM), metformin (0.4 mM) or the combination of EGCG plus metformin. Luciferase activity was assayed 24 h after transfection. The firefly luciferase activity of each sample was normalized to the Renilla luciferase activity. The normalized luciferase activity in the control group was set to 100 %. (C) Nrf2 acetylation was detected by an IP analysis after treatment with EGCG (100 μM), metformin (0.4 mM), or the combination of EGCG plus metformin. (D) A549 cells were treated with the indicated concentrations of metformin or transfected with the indicated siRNA, and levels of the SIRT1 and HO-1 proteins were evaluated by Western blotting. (E) Metformin upregulated SIRT1 levels and NF-κB (p65) phosphorylation. (F) NF-κB inhibition partially abrogated the effect of metformin on SIRT1 expression. (G) A549 cells were transfected with the SIRT1 siRNA (siSIRT1) or scrambled control (siNC) and treated with EGCG for 24 h after pre-treatment with 0.4 mM metformin for 48 h. The subcellular distribution of Nrf2 was detected by immunofluorescence staining. (H) A549 cells were transfected with the siRNA targeting SIRT1 (si SIRT1, right panel) or scrambled control (siNC, left panel) and treated with EGCG for 24 h after pre-treatment with 0.4 mM metformin for 48 h. Cell viability was measured using an MTT assay. The number of viable cells after treatment is expressed as a percentage of the control. P < 0.01 and ** P < 0.001.
Metformin suppressed the EGCG-activated Nrf2/HO-1 signaling pathway via deacetylation of Nrf2
Nrf2 is a key transcription factor that initiates the antioxidant response and expression of HO-1, which confers EGCG resistance [9]. Therefore, we explored whether metformin weakened the activity of the Nrf2/HO-1 pathway in NSCLC cells. The level of the Nrf2 protein in the nucleus was increased in cells treated with EGCG in a dose-dependent manner (Fig. 4A). Consistent with these findings, EGCG also increased the level of the HO-1 protein. Pre-treatment with metformin markedly decreased the nuclear distribution of Nrf2 as well as the level of the HO-1 protein (Fig. 4A). Immunofluorescence staining was performed to further confirm these results. In untreated cells, Nrf2 was mainly observed in the cytoplasm, but translocated to the nucleus in cells treated with EGCG alone. However, metformin inhibited the EGCG-induced translocation of Nrf2 (Fig. 4G). A luciferase reporter plasmid harboring the HO-1 promoter was constructed to further illustrate the effect of metformin on the transcriptional activity of Nrf2. Based on the results of the reporter assay, EGCG increased the luciferase activity, whereas metformin significantly decreased its activity (Fig. 4B), indicating that metformin impaired the transcriptional function of Nrf2. In A549 xenografts, EGCG increased the level of the HO-1 protein, which was reversed by metformin (Fig. 3C and 3D). Thus, EGCG induced the translocation of Nrf2 into the nucleus, resulting in the transcription of HO-1, whereas metformin opposed this effect and inhibited EGCG-induced HO-1 expression.
After translation, the Nrf2 protein is subjected to various post-transcriptional modifications, such as ubiquitination, phosphorylation and acetylation [14-16]. Both EGCG and metformin decreased the phosphorylation (S40) of Nrf2 (Fig. 4A), which has been reported to increase the transcriptional activity of Nrf2 [14]. We therefore investigated the acetylation of Nrf2, which is also involved in the transcriptional activity of Nrf2 [16]. As shown in the results from the IP assay, EGCG increased the acetylation of Nrf2, which was decreased by metformin (Fig. 4C). The changes in Nrf2 acetylation induced by metformin and EGCG are consistent with a previous report [16]. Sirtuin 1 (SIRT1) is a member of the sirtuin family of proteins. SIRT1 has been shown to deacetylate and affect the activity of several transcription factors, including p53 [33] and peroxisome proliferator-activated receptor gamma coactivator 1-alpha (Pgc-1α) [34]. Moreover, the level of SIRT1, which was reported to deacetylate Nrf2 and promote its cytoplasmic localization [35], was elevated in metformin-treated cells in a dose-dependent manner (Fig. 4E). SIRT1 expression was knocked down by an siRNA (siSIRT1; Fig. 4E) to investigate the involvement of SIRT1 protein in Nrf2 function. Levels of the HO-1 protein, the direct downstream target of Nrf2, were significantly elevated after SIRT1 knock-down, and metformin did not decrease the level of the HO-1 protein (Fig. 4D). Consistent with these results, immunofluorescence staining showed increased translocation of Nrf2 into the nucleus in the presence of siSIRT1, even after treatment with metformin. SIRT1 knock-down abrogated the effect of metformin and maintained the nuclear localization of Nrf2 (Fig. 4G). Moreover, compared with siNC-transfected cells, metformin did not sensitize cells to the EGCG treatment when SIRT1 expression was silenced (Fig. 4H). Based on these results, metformin modulates the EGCG-activated Nrf2/HO-1 pathway through the deacetylation of Nrf2.
By investigating the promoters and enhancers of SIRT1, NF-κB (p65), also known as RELA, was one of the transcription factors that bound to both enhancers and promoters. As predicted by genecards (http://www.genecards.org/), RELA binds to 5 enhancers and the promoter of SIRT1. Based on a search of the TCGA database, RELA expression correlated with SIRT1 expression in LUSC (lung squamous cell carcinoma) and LUAD (lung adenocarcinoma) samples (Fig. S3). Next, Western blotting was used to determine whether metformin upregulated SIRT1 expression by influencing RELA. As shown in Fig. 4D, metformin increased the levels of NF-kB p65 (phospho S536), the active form of NF-kB p65. JSH-23 is a NF-κB inhibitor that inhibits the nuclear translocation of NF-κB p65 without affecting IκBα degradation. As shown in Fig. 4E, the level of the SIRT1 protein was decreased after NF-κB was inhibited with JSH-23. Metformin still upregulated SIRT1 expression after NF-κB inhibition. However, the level of the SIRT1 protein was decreased compared with cells treated with metformin alone. These results clearly showed that the metformin-induced upregulation of SIRT1 expression is mediated by the NF-κB pathway. However, the NF-κB pathway may be not the only pathway activated by the metformin treatment.
The impact of metformin and green tea extracts on cancerous and non-cancerous cells
We next sought to ascertain whether EGCG and metformin were cytotoxic to normal lung epithelial cells. Normal lung/bronchus BEAS-2B cells were treated with the indicated concentrations of metformin, EGCG or EGCG plus metformin. EGCG and/or metformin exerted a much smaller impact on BEAS-2B cells than on A549 cells (Fig. 5A, 5B and 5C).
Effects of metformin and green tea extracts on cancerous and non-cancerous cells. BEAS-2B normal lung epithelial cells and A549 NSCLC cells were treated with the indicated concentrations of (A) metformin, (B) EGCG and (C) EGCG plus metformin. Cell viability was measured using an MTT assay. (D) A549 cells were treated with the indicated concentration of EGC, ECG or EGCG for 24 h. Cell viability was measured using an MTT assay. (E) and (F) A549 cells were treated with the indicated concentrations of EGC or ECG for 24 h following the pre-treatment with 0.4 mM metformin for 48 h. Cell viability was measured using an MTT assay. *P < 0.01 and **P<0.001.
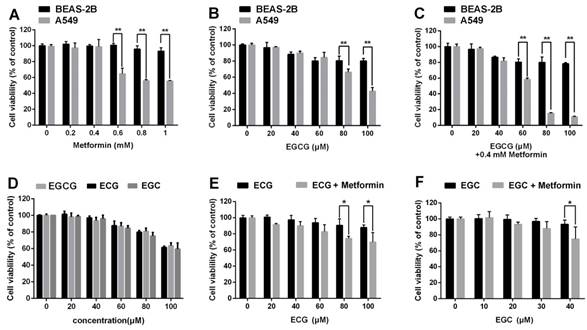
In addition to EGCG, the major catechins in green tea include EGC, ECG and EC [7]. We then investigated whether metformin also sensitized NSCLC cells to other green tea components. A549 cells were treated with 0.4 mM metformin for 48 h and the indicated concentrations of ECG and EGC for 24 h. Metformin could enhanced the cytotoxic effects of ECG and EGC (Fig. 5D, 5E and 5F). In conclusion, metformin enhanced the cytotoxic effects of several green tea components.
Discussion
Lung cancer remains a lethal disease with dismal 5-year survival rate. Since a large proportion of patients with lung cancer is diagnosed with advanced stage disease, orthodox methods for treating cancer only provide a limited improvement in the prognosis. EGCG, the major catechin in green tea, has been shown to inhibit multiple types of cancer cells in vitro and in vivo [36, 37]. However, different tumor cells have different sensitivities to treatment with EGCG [9, 38]. HO-1 is one of the most important cellular defense and anti-oxidant proteins. HO-1 expression dictates the resistance to apoptosis induced by EGCG [9]. As shown in the present study, metformin, a first-line drug for type 2 diabetes, sensitized NSCLC cells to EGCG. Metformin enhanced the cytotoxic effect of EGCG, increased EGCG-induced intracellular ROS production, and enhanced the EGCG-induced apoptosis rate. Moreover, A549 cells treated with EGCG showed increased expression of HO-1, which was decreased upon treatment with metformin.
Nrf2, a critical antioxidant transcription factor, activates multiple antioxidant enzymes by binding to the AREs in their promoters. The Nrf2 signaling pathway was reported to induce HO-1 expression and play an important role in resistance to EGCG [9]. Therefore, in this study we focused on the effects of EGCG and metformin on the Nrf2 signaling pathway. EGCG promoted the translocation of Nrf2 from the cytoplasm to the nucleus, resulting in increased HO-1 expression. However, metformin suppressed Nrf2 translocation, therefore resulting in decreased HO-1 expression. Nrf2 heterodimerizes with Keap1, the cytosolic repressor of Nrf2, and is sequestered in the cytoplasm and subjected to constant degradation. Keap1 is an important redox sensor. The redox signal sensed by Keap1 is subsequently transmitted to Nrf2 in a key process that induces Nrf2 release from Keap1, resulting in the activation of the Nrf2 signaling pathway. In the present study, EGCG induced ROS production. ROS may trigger the dissociation of the Nrf2/Keap1 heterodimer, mediate the translocation of Nrf2 to the nucleus and activate Nrf2/HO-1 signaling pathway. ROS generated by EGCG may activate Nrf2 and its downstream ROS-eliminating enzymes, particularly HO-1, which forms a feedback loop and induces resistance to EGCG. According to our data, metformin, a widely used antidiabetes drug, inhibited the transcriptional activity of Nrf2, decreased the level of HO-1, and enhanced the anti-tumor effect of EGCG. Based on accumulating evidence, many dietary compounds induce Nrf2 signaling by activating diverse phosphorylation pathways, including MAPK [39, 40], PKC [13, 14], and PI3K [41] pathways. Moreover, post-translational modifications, including phosphorylation and acetylation, were reported to influence the transcriptional activity of Nrf2 [14-16]. In our study, both EGCG and metformin decreased Nrf2 phosphorylation (S40). Acetylated Nrf2 also displays augmented promoter-specific DNA binding affinity [16]. EGCG increased the acetylation of Nrf2, which is associated with its increased transcriptional activity, whereas metformin decreased Nrf2 acetylation and suppressed its transcriptional activity, consistent with published results. Based on our findings, Nrf2 acetylation may play a critical role in the response to EGCG and metformin treatments. SIRT1 was reported to deacetylate Nrf2 and promote its cytoplasmic localization [35]. Metformin upregulated SIRT1 expression partially through the NF-κB pathway in our study, resulting in the deacetylation of Nrf2 and downregulation of its transcriptional activity.
Moreover, BEAS-2B normal lung epithelial cells were not susceptible to EGCG and metformin. According the results of a search of TCGA (The Cancer Genome Atlas) datasets, HO-1 is expressed at significantly higher levels in normal lung tissues than in lung cancer tissues, which may provide an explanation for the phenomenon that lung cancer cells are more susceptible to EGCG and metformin (Fig. S2). EGCG and metformin may represent a new strategy to treat NSCLC. Furthermore, HO-1 is responsible for the resistance to not only EGCG but also a wide variety of chemotherapeutic drugs, including cisplatin [42], gemcitabine [43] and paclitaxel [44]. Thus, this study sheds light on a novel strategy to use metformin as a neoadjuvant drug during chemotherapy.
In conclusion, metformin inhibited HO-1 expression and augmented the cytotoxic effects of EGCG in vitro and in vivo. Metformin increased the EGCG-induced intracellular ROS production and apoptosis. Metformin and EGCG inhibited tumor growth in vivo. Mechanistically, metformin modulated the EGCG-activated Nrf2/HO-1 pathway through SIRT1-dependent deacetylation of Nrf2. Moreover, metformin upregulated SIRT1 expression partially through the NF-kB pathway. (Fig. 6). Thus, metformin sensitized NSCLC cells to the EGCG treatment by suppressing the Nrf2/HO-1 signaling pathway.
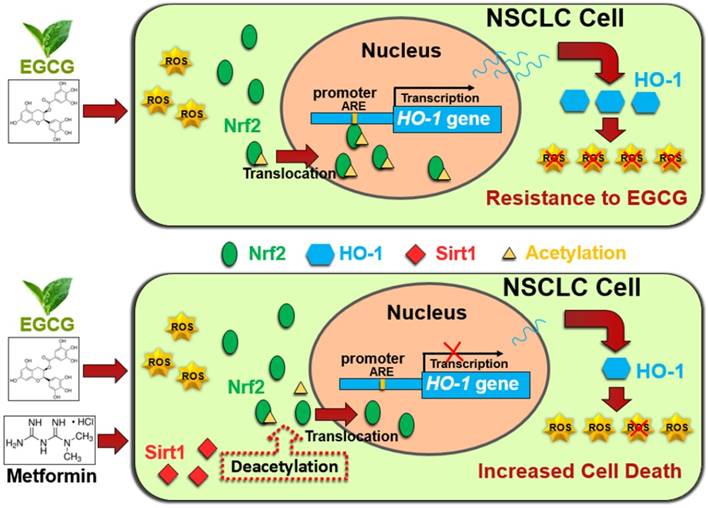
Schematic representation of metformin-induced sensitization of NSCLC cells to EGCG. Upper panel: EGCG generates ROS and promotes Nrf2 acetylation, resulting in the translocation of Nrf2 into the nucleus. Nuclear Nrf2 activates HO-1 transcription and thus mediates EGCG resistance. Lower panel: Metformin upregulates SIRT1, which decreases the acetylation of Nrf2 and reduces the nuclear distribution of Nrf2. Inhibition of Nrf2 activation abolishes the expression of the antioxidant HO-1 and sensitizes NSCLC cells to EGCG.
Supplementary Material
Supplementary figures.
Acknowledgements
This work was supported by grants from the National Natural Science Foundation of China (81673100, 81573080 and 81602101), Key Scientific Development Program of China (2016YFC0904700 and 2016YFC0904702), Suzhou Administration of Science & Technology (SYS201416) and Social Development Program of Jiangsu Province (BE2017634 and BE2017652).
Competing Interests
The authors have declared that no competing interest exists.
References
1. Siegel RL, Miller KD, Jemal A. Cancer statistics, 2015. CA Cancer J Clin. 2015Jan;65(1):5-29
2. Chen W, Zheng R, Baade PD, Zhang S, Zeng H, Bray F. et al. Cancer statistics in China, 2015. CA Cancer J Clin. 2016Jan;66(2):115-32
3. Carney DN. Lung cancer-time to move on from chemotherapy. The New England journal of medicine. 2002;346:126-8
4. Hwang J T, Ha J, Park I J. et al. Apoptotic effect of EGCG in HT-29 colon cancer cells via AMPK signal pathway. Cancer Lett. 2007Mar;247(1):115-121
5. Nakachi K, Matsuyama S, Miyake S, Suganuma M, Imai K. Preventive effects of drinking green tea on cancer and cardiovascular disease: epidemiological evidence for multiple targeting prevention. Biofactors. 2000;13(1-4):49-54
6. Shankar S, Ganapathy S, Hingorani S R. et al. EGCG inhibits growth, invasion, angiogenesis and metastasis of pancreatic cancer. Front Biosci. 2008Jan;13:440-452
7. Tachibana H, Koga K, Fujimura Y. et al. A receptor for green tea polyphenol EGCG. Nat Struct Mol Biol. 2004May;11(4):380
8. Zaveri NT. Green tea and its polyphenolic catechins: medicinal uses in cancer and noncancer applications. Life Sci. 2006Mar;78(18):2073-80
9. Kweon M-H, Adhami VM, Lee J-S, Mukhtar H. Constitutive overexpression of Nrf2-dependent heme oxygenase-1 in A549 cells contributes to resistance to apoptosis induced by epigallocatechin 3-gallate. J Biol Chem. 2006Nov;281(44):33761-72
10. Ryter SW, Choi AMK. Heme oxygenase-1: redox regulation of a stress protein in lung and cell culture models. Antioxid Redox Signal. 2005Dec;7(1-2):80-91
11. Fang J, Akaike T, Maeda H. Antiapoptotic role of heme oxygenase (HO) and the potential of HO as a target in anticancer treatment. Apoptosis. 2004Jan;9(1):27-35
12. Kobayashi M, Yamamoto M. Molecular mechanisms activating the Nrf2-Keap1 pathway of antioxidant gene regulation. Antioxid Redox Signal. 2005Feb;7(3-4):385-94
13. I Nguyen T, Nioi P, Pickett C B. The Nrf2-antioxidant response element signaling pathway and its activation by oxidative stress. J Biol Chem. 2009Jan;284(20):13291-13295
14. Niture SK, Jain AK, Jaiswal AK. Antioxidant-induced modification of INrf2 cysteine 151 and PKC-delta-mediated phosphorylation of Nrf2 serine 40 are both required for stabilization and nuclear translocation of Nrf2 and increased drug resistance. J Cell Sci. 2009Dec;122(Pt 24):4452-64
15. Huang H-C, Nguyen T, Pickett CB. Phosphorylation of Nrf2 at Ser-40 by protein kinase C regulates antioxidant response element-mediated transcription. J Biol Chem. 2002Nov;277(45):42769-74
16. Sun Z, Chin YE, Zhang DD. Acetylation of Nrf2 by p300/CBP augments promoter-specific DNA binding of Nrf2 during the antioxidant response. Mol Cell Biol. 2009May;29(10):2658-72
17. Lee J-S, Surh Y-J. Nrf2 as a novel molecular target for chemoprevention. Cancer Lett. 2005Jun;224(2):171-84
18. Sahin K, Tuzcu M, Gencoglu H, Dogukan A, Timurkan M, Sahin N. et al. Epigallocatechin-3-gallate activates Nrf2/HO-1 signaling pathway in cisplatin-induced nephrotoxicity in rats. Life Sci. 2010Aug;87(7-8):240-5
19. Lord JM, Flight IHK, Norman RJ. Metformin in polycystic ovary syndrome: systematic review and meta-analysis. BMJ. 2003Oct;327(7421):951-3
20. Type 2 Diabetes. National Clinical Guideline for Management in Primary and Secondary Care (Update), Royal College of Physicians of London. London: 2008. London. 2008
21. American Diabetes Association. Standards of medical care in diabetes-2014. Diabetes Care. 2014;37(Suppl 1):S14-80
22. Evans JMM, Donnelly LA, Emslie-Smith AM, Alessi DR, Morris AD. Metformin and reduced risk of cancer in diabetic patients. BMJ. 2005Jun;330(7503):1304-5
23. Akinyeke T, Matsumura S, Wang X, Wu Y, Schalfer ED, Saxena A. et al. Metformin targets c-MYC oncogene to prevent prostate cancer. Carcinogenesis. 2013Dec;34(12):2823-32
24. Gotlieb WH, Saumet J, Beauchamp M-C, Gu J, Lau S, Pollak MN. et al. In vitro metformin anti-neoplastic activity in epithelial ovarian cancer. Gynecol Oncol. 2008Aug;110(2):246-50
25. Zakikhani M, Dowling R, Fantus IG, Sonenberg N, Pollak M. Metformin is an AMP kinase-dependent growth inhibitor for breast cancer cells. Cancer Res. 2006Nov;66(21):10269-73
26. Owen MR, Doran E, Halestrap AP. Evidence that metformin exerts its anti-diabetic effects through inhibition of complex 1 of the mitochondrial respiratory chain. Biochem J. 2000;348(Pt 3):607-14
27. Goldstein BH, Sandelin AM, Golbus JR, Warnke N, Gooding L, King KK. et al. Impact of vitamin C on endothelial function and exercise capacity in patients with a Fontan circulation. Congenit Heart Dis. 2012;7(3):226-34
28. Kalender A, Selvaraj A, Kim SY, Gulati P, Brule S, Viollet B. et al. Metformin, independent of AMPK, inhibits mTORC1 in a rag GTPase-dependent manner. Cell Metab. 2010May;11(5):390-401
29. Cantrell LA, Zhou C, Mendivil A, Malloy KM, Gehrig PA, Bae-Jump VL. Metformin is a potent inhibitor of endometrial cancer cell proliferation-implications for a novel treatment strategy. Gynecol Oncol. 2010Jan;116(1):92-8
30. Kato K, Gong J, Iwama H, Kitanaka A, Tani J, Miyoshi H. et al. The antidiabetic drug metformin inhibits gastric cancer cell proliferation in vitro and in vivo. Mol Cancer Ther. 2012Mar;11(3):549-60
31. Allred DC, Harvey JM, Berardo M, Clark GM. Prognostic and predictive factors in breast cancer by immunohistochemical analysis. Mod Pathol an Off J United States Can Acad Pathol Inc. 1998Feb;11(2):155-68
32. Elbling L, Weiss R-M, Teufelhofer O, Uhl M, Knasmueller S, Schulte-Hermann R. et al. Green tea extract and (-)-epigallocatechin-3-gallate, the major tea catechin, exert oxidant but lack antioxidant activities. FASEB J Off Publ Fed Am Soc Exp Biol. 2005May;19(7):807-9
33. Cheng H-L, Mostoslavsky R, Saito S, Manis JP, Gu Y, Patel P. et al. Developmental defects and p53 hyperacetylation in Sir2 homolog (SIRT1)-deficient mice. Proc Natl Acad Sci U S A. 2003Sep;100(19):10794-9
34. Rodgers JT, Lerin C, Haas W, Gygi SP, Spiegelman BM, Puigserver P. Nutrient control of glucose homeostasis through a complex of PGC-1alpha and SIRT1. Nature. 2005Mar;434(7029):113-8
35. Kawai Y, Garduno L, Theodore M, Yang J, Arinze IJ. Acetylation-deacetylation of the transcription factor Nrf2 (nuclear factor erythroid 2-related factor 2) regulates its transcriptional activity and nucleocytoplasmic localization. J Biol Chem. 2011Mar;286(9):7629-40
36. Khan N, Afaq F, Saleem M, Ahmad N, Mukhtar H. Targeting multiple signaling pathways by green tea polyphenol (-)-epigallocatechin-3-gallate. Cancer Res. 2006Mar;66(5):2500-5
37. Yang GY, Liao J, Kim K, Yurkow EJ, Yang CS. Inhibition of growth and induction of apoptosis in human cancer cell lines by tea polyphenols. Carcinogenesis. 1998Apr;19(4):611-6
38. Yamamoto T, Hsu S, Lewis J, Wataha J, Dickinson D, Singh B. et al. Green tea polyphenol causes differential oxidative environments in tumor versus normal epithelial cells. J Pharmacol Exp Ther. 2003Oct;307(1):230-6
39. Naidu S, Vijayan V, Santoso S, Kietzmann T, Immenschuh S. Inhibition and genetic deficiency of p38 MAPK up-regulates heme oxygenase-1 gene expression via Nrf2. J Immunol. 2009Jun;182(11):7048-57
40. Yao P, Nussler A, Liu L, Hao L, Song F, Schirmeier A. et al. Quercetin protects human hepatocytes from ethanol-derived oxidative stress by inducing heme oxygenase-1 via the MAPK/Nrf2 pathways. J Hepatol. 2007Aug;47(2):253-61
41. Nakaso K, Yano H, Fukuhara Y, Takeshima T, Wada-Isoe K, Nakashima K. PI3K is a key molecule in the Nrf2-mediated regulation of antioxidative proteins by hemin in human neuroblastoma cells. FEBS Lett. 2003Jul;546(2-3):181-4
42. Sahin K, Tuzcu M, Sahin N, Ali S, Kucuk O. Nrf2/HO-1 signaling pathway may be the prime target for chemoprevention of cisplatin-induced nephrotoxicity by lycopene. Food Chem Toxicol. 2010Oct;48(10):2670-4
43. Berberat PO, Dambrauskas Z, Gulbinas A, Giese T, Giese N, Kunzli B. et al. Inhibition of heme oxygenase-1 increases responsiveness of pancreatic cancer cells to anticancer treatment. Clin Cancer Res. 2005May;11(10):3790-8
44. Choi B-M, Kim Y-M, Jeong Y-R, Pae H-O, Song C-E, Park J-E. et al. Induction of heme oxygenase-1 is involved in anti-proliferative effects of paclitaxel on rat vascular smooth muscle cells. Biochem Biophys Res Commun. 2004Aug;321(1):132-7
Author contact
![]() Corresponding authors: Jianping Cao, Tel: +86-512-65880037; Fax: +86-512-65880037; E-mail: jpcaoedu.cn; Wei Zhu, Tel: +86-512-65883941; Fax: +86-512-65883941; E-mail: zwhh1838com.
Corresponding authors: Jianping Cao, Tel: +86-512-65880037; Fax: +86-512-65880037; E-mail: jpcaoedu.cn; Wei Zhu, Tel: +86-512-65883941; Fax: +86-512-65883941; E-mail: zwhh1838com.