Impact Factor ISSN: 1449-2288

 Global reach, higher impact
Int J Biol Sci 2018; 14(7):717-725. doi:10.7150/ijbs.24063 This issue Cite
Research Paper
The prevalence of autism spectrum disorders in China: a comprehensive meta-analysis
Fei Wang1,2#, Li Lu1#, Shi-Bin Wang2#, Ling Zhang3#, Chee H. Ng4, Gabor S. Ungvari5, Xiao-Lan Cao6, Jian-Ping Lu6, Cai-Lan Hou2, Fu-Jun Jia2 ![]() , Yu-Tao Xiang1
, Yu-Tao Xiang1 ![]()
1. Unit of Psychiatry, Faculty of Health Sciences, University of Macau, Macao SAR.
2. Guangdong Mental Health Center, Guangdong General Hospital & Guangdong Academy of Medical Sciences, Guangzhou, Guangdong, China.
3. The National Clinical Research Center for Mental Disorders, China &Center of Depression, Beijing Institute for Brain Disorders & Mood Disorders Center, Beijing Anding Hospital, Capital Medical University, Beijing, China.
4. Department of Psychiatry, University of Melbourne, Melbourne, Victoria, Australia;
5. The University of Notre Dame Australia / Graylands Hospital, Perth, Australia.
6. Shenzhen Key Laboratory for Psychological Healthcare & Shenzhen Institute of Mental Health, Shenzhen Kangning Hospital & Shenzhen Mental Health Center, Shenzhen, China.
#These authors equally contributed to the work.
Received 2017-11-28; Accepted 2018-2-16; Published 2018-5-12
Abstract

There are conflicting prevalence estimates of autism spectrum disorders (ASDs) in mainland China (China thereafter). This study is a comprehensive meta-analysis of the pooled prevalence of ASDs in the general population in China. Study investigators independently conducted a systematic literature search of the following databases: PubMed, EMBASE, PsycINFO, China National Knowledge Infrastructure, Chinese biomedical literature service system, and Wan Fang. Studies reporting prevalence of ASDs and autism in Chinese population were identified and analysed using the Comprehensive Meta-Analysis program with the random effects model. Forty-four studies were included in the meta-analysis comprising 2,337,321 subjects of whom 46.66 % were females. The mean age of subjects ranged from 1.6 to 8 years. Based on diagnostic criteria the pooled prevalence of ASDs was 39.23 per 10,000 (95% CI: 28.44-50.03 per 10,000, I2=89.2%); specifically, the prevalence of autism was 10.18 per 10,000 (95% CI: 8.46-11.89 per 10,000, I2=92.5%). Subgroup analyses revealed significant difference in the prevalence of ASDs between genders (72.77 per 10,000 in males vs. 16.45 per 10,000 in females). In conclusion, the prevalence of ASDs and autism in China was found generally lower than those reported in other countries. Further studies are needed to clarify the variation in prevalence.
Keywords: Autism spectrum disorder, prevalence, meta-analysis, China
Introduction
Autism spectrum disorders (ASDs) refer to a group of pervasive developmental disorders caused by a combination of genetic and environmental factors. They are often associated with pronounced personal suffering and heavy burden of care to families and society [1]. ASDs consist of several subtypes, with autism being the core and the most common one. ASDs usually occur in infancy [2] and present with complex symptoms. Children with ASDs usually have difficulties in understanding language and social behaviors; parental concern is often centered around their children presenting abnormal behaviors, such as mutism, echolalia and lack of expressive emotion [3].
Accurate estimation of the prevalence of ASDs is important for the health sectors to understand its impact on the general population and provide appropriate resource allocations. A number of epidemiological studies have found an increasing trend in prevalence of ASDs, for example, in the 1990s the prevalence rate of ASDs were 4-5 per 10,000 in the USA, as compared to 113 per 10,000 in 2008 [4]. The apparent growing trend could be partly explained by the discrepancy in age of subjects, diagnostic criteria and sampling methods [5]. In addition, there is wide variation in the prevalence of ASDs between countries. For instance, the prevalence of autism was 34 per 10,000 in USA [6] versus 99 per 10,000 in the UK [7]. A review of 23 studies found that the estimated prevalence of ASDs across Asia countries/ territories (China, Japan, Israel, Iran, Taiwan and Indonesia) varied from 1.1 to 21.8 per 10,000 [8].
In China, prevalence studies of ASDs have shown conflicting findings. Moreover, most studies were published in Chinese-language journals that are not accessible to international readership. A review of 24 studies [9] found that the pooled prevalence of ASDs in Chinese children was 24.5 per 10,000. Another meta-analysis of 18 studies in China [10] found that a pooled prevalence of autism of 11.8 per 10,000. More than 20 ASDs prevalence studies have been recently published in Chinese, which have enhanced the epidemiological dataset, but are generally not accessible to the international readership. Therefore, we set out to conduct this comprehensive meta-analysis of the pooled prevalence of ASDs in China and also to examine its mediating factors (e.g., gender, region, study period, and diagnostic tools used).
Methods
Search strategy and selection criteria
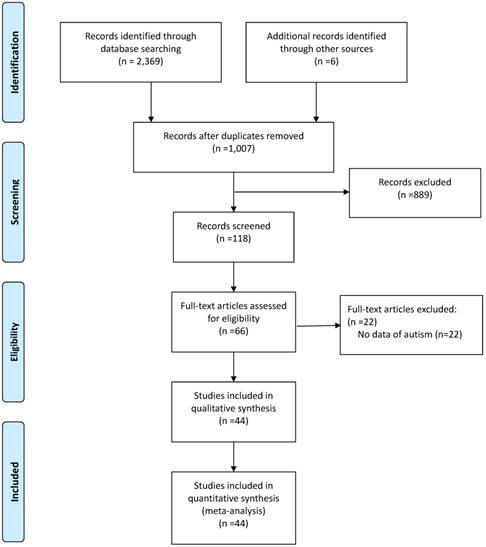
The literature search process is shown in Figure 1. Two investigators (WF and LL) independently searched the literature using PubMed, EMBASE, PsycINFO, China National Knowledge Infrastructure, Chinese biomedical literature service system (SinoMed) and Wan Fang, from their inception to February 1st 2017. Search terms included ('autism' or 'autistic disorder' or 'autism spectrum conditions' or 'pervasive developmental disorders' or 'Asperger') and ('epidemiology' or 'cross-sectional study' or 'prevalence' or 'rate') and ('China' or 'Chinese'). In order to avoid missing any studies, the reference lists of relevant review or meta-analyses were searched manually. If more than one publication was reported based on the same dataset, only the paper with complete data was included.
Flow chart of the study
Inclusion criteria were as follows: 1) cross-sectional or cohort studies conducted in mainland China (China thereafter) (only baseline data were extracted in the latter); 2) participants aged ≤18 years; 3) the diagnosis of ASD was established by either clinical diagnostic criteria [such as the Diagnostic and Statistical Manual of Mental Disorder (DSM), Chinese Classification of Mental Disorder (CCMD) or International Classification of Disease (ICD) systems], or screening tools [such as the Clancy Autism Behavior Scale (CABS), Children Autism Spectrum Test (CAST) and Checklist for Autism in Toddlers (CHAT)]. Both clinical diagnostic criteria and screening tools on ASDs and autism were involved because they have been widely used in epidemiology and clinical practice in China.
Studies selection and data extraction
After removing the duplicates, two investigators (WF and LL) independently screened the titles and abstracts of all records, and then selected the articles that fulfilled the inclusion criteria. Any uncertainties were resolved by consensus or with a third reviewer (WSB).
The same two investigators independently performed the data extraction using a standard data extraction form. Information extracted included the study characteristics (e.g., title, the first author, publication year, study site, survey time, sample method, sample size, response rate), ASD subtype, age, gender proportion, residence (urban/ rural area), screening and diagnostic tools, and data on the prevalence of ASDs and subtypes.
Quality assessment
Two investigators (WF and LL) independently assessed the quality of included studies using a methodological quality assessment tool with 8 items [11, 12]. Each study was scored from 0 to 8. The score of 7-8 indicated 'high quality', 4-6 indicated 'moderated quality' and 0-3 indicated 'low quality' [12]. Any disagreement in the assessment process was discussed and resolved with a third investigator (WSB).
Statistical analysis
The Comprehensive Meta-Analysis software version 2 was used to synthesize the data. Due to the heterogeneity in sampling methods, assessment instruments and sample size across studies, random-effects model was used to estimate the pooled prevalence of ASD [13]. The I2 statistic was used to assess the degree of heterogeneity across included studies. Sensitivity and subgroup analysis were used to examine the sources of heterogeneity if present. Publication bias was evaluated with the funnel plots and Egger's test and the significance level was set at 0.05 (two-sided).
Results
Search results and characteristics of studies
Of 2,375 eligible papers identified in literature search, 44 fulfilled the inclusion criteria after screening the titles, abstracts and full texts, and removing the duplicates (Figure 1). Five of these studies were published in English and thirty-nine in Chinese. Their sample size ranged from 259 to 1,348,030 subjects and 42 studies had a sample size greater than 1000. The 44 included studies had a total of 2,337,321 subjects of which 46.66% were females. Sixteen studies reported on the prevalence of ASDs, while 28 focused on the prevalence of autism.
The characteristics of the included studies are shown in Table 1. These studies were conducted between 2000 and 2016 in 30 provinces/ municipalities/ autonomous regions in China. Mean age of the subjects ranged from 1.6 to 8 years, with the median age of 4 years. Twenty-seven studies were conducted in urban areas (61.4%) and the others were in both urban and rural areas (urban/rural were defined by the studies included in the meta-analysis). Twenty-seven studies were conducted in eastern China, nine in central China, seven studies in western China, and one study was a national survey. The CABS was the most commonly used screening tool (22/44).
Evaluation quality of the studies
The quality assessment scores ranged from 4 to 8. Based on the assessment criteria, 7 studies were rated as 'high quality', and 37 was as 'moderate quality' (Table 4).
Characteristic of the included studies
| Study year | First Author | Ref | Region | Sample Size | Area* (urban/ rural) | Age (years) | Sample | Sampling methods | Screening/ diagnostic tools | Diagnostic criteria | Autism events according to diagnostic criteria | ASD events according to diagnostic criteria |
|---|---|---|---|---|---|---|---|---|---|---|---|---|
| 1996 | Luo | [30] | Fujian | 10802 | Mixed | 0 to 14 | G | CL | ABC | CCMD-2-R; DSM 3 | 3 | —— |
| 1999 | Jiang | [31] | Luoyang | 10140 | Mixed | NA to NA | PS,K | R | —— | DSM 3 | 3 | —— |
| 2000 | Ren | [32] | Tongling | 3559 | Urban | 3 to 5 | K | CL | CABS | —— | —— | —— |
| 2001 | Zhang | [33] | Guiyang | 4999 | Urban | 0 to 6 | G | S; CL | CABS; CARS | CCMD | 5 | —— |
| 2001 | Guo | [34] | Tianjin | 5000 | Urban | 0 to 6 | G | R | CABS; CARS; PEP | CCMD | 5 | —— |
| 2001 | Wang | [35] | Changzhou | 7344 | Mixed | NA to NA | G | S; CL | CABS | CCMD | 9 | —— |
| 2003 | Yang | [36] | Zunyi | 10412 | Urban | NA to NA | PS | R | ABC | DSM 4 | 6 | —— |
| 2003 | Liu | [37] | Beijing | 21866 | Mixed | 2 to 6 | G | S; CL | CABS; CARS | DSM 4 | 14 | —— |
| 2003 | Guo | [38] | Dingxi | 3770 | Mixed | 2 to 6 | G | R | CABS; CARS | DSM 4 | 3 | —— |
| 2004 | Zhang | [39] | Tianjin | 7345 | Urban | 2 to 6 | G | R | CABS | DSM 4 | 8 | —— |
| 2006 | Ji | [40] | Nationwide | 585679 | Both | 2 to 17 | G | R | Disability screening questionnaire | ICD10 | 124 | —— |
| 2007 | Su | [41] | Tianjin | 7904 | Urban | 1.5 to 3 | REG | S; CL | CHAT; CARS | DSM 4 | 22 | —— |
| 2007 | Zhang | [42] | Wuxi | 25521 | Urban | 1 to 6 | C | CL | CHAT;CABS; CARS | DSM 4 | 25 | —— |
| 2008 | Wang | [43] | Meizhou | 4156 | Urban | 2 to 6 | K | CL | CABS | —— | —— | —— |
| 2009 | Pu | [44] | Guizhou | 3211 | Urban | 2 to 6 | K | CL | CABS | DSM 4 | 7 | —— |
| 2009 | Huang | [45] | Tianjin | 8000 | Urban | 1.5 to 3 | G | M | CHAT | DSM 4 | —— | 22 |
| 2009 | Zhou | [46] | Shenzhen | 2960 | Urban | 1 to 2 | G | R | CHAT | —— | 9 | —— |
| 2009 | Wu | [47] | Lianyungang | 8532 | Urban | 0 to 3 | C | R | CHAT; CARS | DSM 4 | 9 | —— |
| 2009 | Chen | [48] | Daqing | 7034 | Mixed | 2 to 6 | K, G | S; CL | CABS; ABC | DSM4 | —— | 17 |
| 2009 | Liang | [49] | Maoming | 2485 | Urban | 3 to 6 | K | CL | CABS | ICD10; DSM 4 | 35 | —— |
| 2009 | Liu | [50] | Shanghai | 259 | Urban | 1.5 to 2 | K | CL | CHAT | DSM 4 | 1 | 2 |
| 2009 | Wang | [51] | Guizhou | 6111 | Urban | 2 to 6 | K | M | CABS; CARS | DSM 4 | —— | 46 |
| 2009 | Yu | [52] | Haerbin | 7059 | Mixed | 2 to 6 | K | S; CL | CABS;ABC | DSM 4 | 15 | 16 |
| 2009 | Li | [53] | Tianjin | 8274 | Urban | 1.5 to 3 | REG | S; CL | CHAT; CARS | DSM4 | 22 | —— |
| 2011 | Li | [54] | Guiyang | 1550 | Urban | 1.5 to 3 | C | CL | M-CHAT; ABC | DSM 4 | 48 | —— |
| 2011 | Wei | [55] | Shenzhen | 3624 | Urban | 1.5 to 2 | C | CL | CHAT; CARS | DSM4 | 7 | 10 |
| 2012 | Wang | [56] | Lianyungang | 2090 | Both | 1.5 to 3 | C | S; CL | CABS | DSM-V | —— | 24 |
| 2012 | Li | [57] | Changchun | 9714 | Urban | 0 to 6 | G | R | ABC; CARS | CCMD3 | 15 | —— |
| 2012 | Chen | [58] | Zhuhai | 4754 | Both | 1.5 to 3 | REG | R | CHAT; CARS | DSM4 | —— | 14 |
| 2012 | Yang | [59] | Wuhan | 8695 | Urban | 3 to 7 | K | CL | CABS | —— | —— | —— |
| 2012 | Duan | [60] | Zhengzhou | 1000 | NA | 1.5 to 3 | C | CL | CHAT; CARS; ABC | DSM 4 | —— | 9 |
| 2012 | Wu | [61] | Ningxia | 1348030 | NA | 0 to 14 | REG | CL | ABC; CARS | ICD-10 | 419 | —— |
| 2013 | Li | [62] | Shenzhen | 1845 | Urban | 1.5 to 2 | C | CL | CABS | DSM-IV | 4 | —— |
| 2013 | Wang | [63] | Shantou | 51968 | Urban | 3 to 6 | REG | R | CABS | ICD 10 | 139 | —— |
| 2013 | Gao | [64] | Zhongshan | 12804 | Both | 3 to 6 | K | S; CL | CABS | —— | —— | —— |
| 2013 | Deng | [65] | Hengyang | 7041 | Both | 2 to 6 | K | CL | CABS; CARS | DSM 4 | 16 | 42 |
| 2014 | Wang | [66] | Jiangmen | 65651 | Both | 2 to 7 | K | CL | CABS; ABC | ABC | 97 | —— |
| 2014 | Wang | [67] | Zaozhuang | 6634 | NA | 2 to 6 | K | S; CL | CABS | DSM-5 | —— | 44 |
| 2014 | Yang | [68] | Shenzhen | 15188 | Urban | 3.83 to 4.83 | K | CL | ABC | —— | —— | —— |
| 2014 | Jiang | [69] | Shanghai | 9665 | Urban | 4 to 6 | K | CL | CABS;ASSQ | ADI-R;DSM-5 | 9 | 9 |
| 2014 | Sun | [70] | Beijing | 701 | Urban | 6 to 11 | PS | CL | CAST | ADOS;ADIR | —— | —— |
| 2014 | Lu | [71] | Shanghai | 5704 | Urban | 2 to 6 | K | CL | CABS | DSM-5 | —— | 6 |
| 2014 | Cheng | [72] | Ningbo | 12123 | Both | 1 to 6 | C | S; CL | CHAT; ABC | DSM-IV-TR | —— | 14 |
| 2015 | Tian | [73] | Jilin | 6118 | Urban | 6 to 11 | PS | CL | CAST | CCMD | —— | 39 |
* Rural/urban areas were defined by included studies. Sample screen: C, clinical service; G, general population; K, kindergarten; PS, population sample; REG, registration data; Sample method: CL, cluster; M, multiphase; R, random; S, stratified Screen tools: ABC, Autism Behavior Checklist; CABS, Clancy Autism Behavior Scale; CARS, Childhood Autism Rating Scale; CHAT, Checklist for Autism in Toddlers; M-CHAT, Modified Checklist for Autism in Toddlers; CAST, Children Autism Spectrum Test; ASSQ, high function Autism Spectrum screening questionnaire; PEP, Childhood Autism And Developmental Disabilities Psychological Assessment Scale (Psycho-educational Profile, PEP); Diagnostic criteria: ADI-R, Autism Diagnostic Interview-Revised; CCMD-2-R, Chinese Classification of Mental Disorders, 2nd edition, revised; DSM-III-R, Diagnostic and Statistical Manual of Mental Disorders, 3rd edition, revised; DSM-IV, Diagnostic and Statistical Manual of Mental Disorders, 4th edition; DSM-V, Diagnostic and Statistical Manual of Mental Disorders, 5th edition; ICD-10, International Classification of Diseases, 10th revision; ASC, autism spectrum conditions;
Quality assessment of the included studies
| Items | Yes, n (%) | No, n (%) | Unclear, n (%) |
|---|---|---|---|
| 1. Is the target population clearly defined? | 43 (97.7) | 1 (2.27) | 0 |
| 2. Was either of the following ascertainment methods used [must be one or the other]? (1) probability sampling, or (2) entire population surveyed | 41 (93.2) | 3 (6.82) | 0 |
| 3. Is the response rate >70% | 26 (59.1) | 18 (40.9) | 0 |
| 4. Are nonresponders clearly described? | 2 (4.5) | 42 (95.5) | 0 |
| 5. Is the sample representative of the target population? | 42 (95.5) | 2 (4.5) | 0 |
| 6. Were data collection methods standardized? | 44 (100) | 0 | 0 |
| 7. Were validated criteria used to assess for the presence/absence of disease? | 44 (100) | 0 | 0 |
| 8. Are the estimates of prevalence given with confidence intervals and in detail by subgroup (if applicable)? | 9 (20.5) | 35 (79.5) | 0 |
Prevalence of ASDs
Prevalence of ASDs based on clinical diagnostic criteria
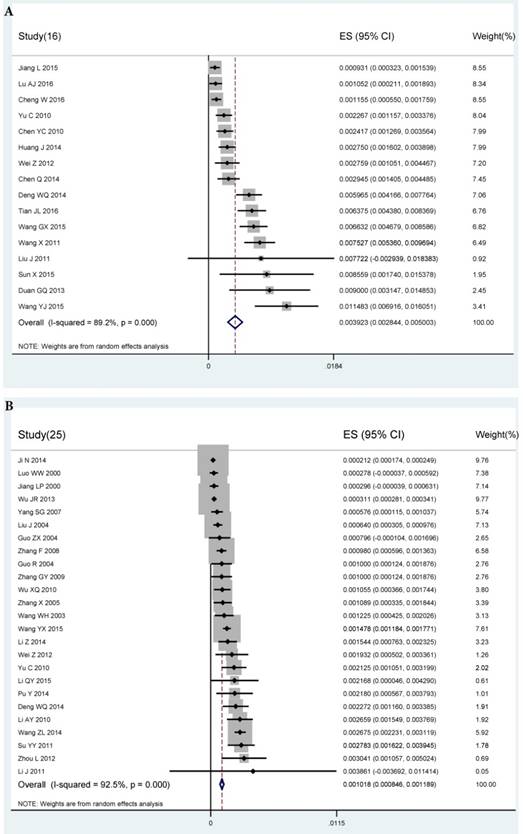
The pooled prevalence of ASDs from 16 studies with available data was 39.23 per 10,000 (95% CI: 28.44 to 50.03 per 10,000, I2=89.2%) (Figure 2A). The prevalence of ASDs in males (72.77 per 10,000) was higher than in females (16.45 per 10,000). The prevalence of ASDs in rural areas was higher than in urban areas (62.26 per 10,000 vs. 32.73 per 10,000). The pooled prevalence of ASDs from studies conducted in or before 2012 was slightly higher than that those after 2012 (38.72 per 10,000 vs. 36.36 per 10,000) after study years were dichotomized using median splitting method. The prevalence of ASDs in eastern and central China was 45.81 per 10,000 and 50.85 per 10,000, respectively. Meta-regression analysis did not find any association between age and prevalence of ASDs (p=0.784). Subgroup analyses of diagnostic instruments used revealed no difference between prevalence of ASDs established by CCMD (63.75 per 10,000), DSM-4 (41.87 per 10,000) or DSM-5 (48.96 per 10,000). However, one prevalence study using the Autism Diagnostic Observation Schedule (ADOS) (85.59 per 10,000) showed a higher figure than others (Table 2).
A) Forest plot of prevalence of autism spectrum disorders based on clinical diagnostic criteria. B) Forest plot of prevalence of autism based on clinical diagnostic criteria
Subgroup analyses of prevalence of ASD and autism based on clinical diagnostic criteria
| Number of studies | N | Event | I2 (%) | P | Prevalence (per 10000) | 95% CI (per 10000) Lower | 95% CI (per 10000) Upper | u-value | P | ||
|---|---|---|---|---|---|---|---|---|---|---|---|
| ASDs | 16 | 87917 | 320 | 89.29 | <0.001 | 39.23 | 28.44 | 50.03 | 1457.90 | ||
| Gender | Male | 13 | 41155 | 253 | 98.77 | <0.001 | 72.77 | 54.16 | 91.39 | 30.343 | <0.001 |
| Female | 13 | 36137 | 50 | 93.98 | <0.001 | 16.45 | 11.85 | 21.06 | |||
| Area | Urban | 6 | 35744 | 88 | 91.27 | <0.001 | 32.73 | 20.52 | 44.95 | 0.216 | 0.642 |
| Rural | 2 | 8384 | 26 | 96.5 | <0.001 | 62.26 | 37.29 | 161.80 | |||
| Study time | 2009-2012 | 9 | 44882 | 178 | 98.55 | <0.001 | 38.72 | 26.49 | 50.94 | 0.689 | 0.406 |
| >2012 | 7 | 43035 | 136 | 99.24 | <0.001 | 36.36 | 19.75 | 52.98 | |||
| Study site | East of China | 11 | 59665 | 191 | 99.16 | <0.001 | 45.81 | 34.05 | 57.58 | 0.392 | 0.531 |
| West of China | --- | --- | --- | --- | --- | --- | --- | --- | |||
| Central China | 5 | 28252 | 123 | 98.51 | <0.001 | 50.85 | 31.69 | 70.02 | |||
| Diagnostic criteria | ADOS | 1 | 701 | 6 | - | - | 85.59 | 64.88 | 106.30 | 1.924 | 0.588 |
| CCMD | 1 | 6118 | 39 | - | - | 63.75 | 57.63 | 69.87 | |||
| DSM-4 | 10 | 57005 | 192 | 98.74 | <0.001 | 41.87 | 30.26 | 53.47 | |||
| DSM-5 | 4 | 24093 | 83 | 99.52 | <0.001 | 48.96 | 24.99 | 72.93 | |||
| Autism | 25 | 2218950 | 987 | 99.975 | <0.001 | 10.18 | 8.46 | 11.89 | 97232.57 | ||
| Gender | Male | 14 | 423777 | 360 | 99.69 | <0.001 | 20.50 | 12.98 | 28.02 | 8.679 | 0.003 |
| Female | 14 | 370495 | 119 | 98.80 | <0.001 | 6.12 | 3.08 | 9.16 | |||
| Area | Urban | 20 | 304580 | 434 | 96.36 | <0.001 | 14.80 | 9.87 | 19.72 | 4.105 | 0.043 |
| Rural | 5 | 506027 | 147 | 95.45 | <0.001 | 6.06 | 1.13 | 11.00 | |||
| Study time | 1996-2008 | 8 | 657661 | 199 | 99.60 | <0.001 | 8.18 | 4.36 | 12.00 | 5.113 | 0.024 |
| 2009-2013 | 8 | 85530 | 200 | 94.05 | <0.001 | 20.40 | 14.05 | 26.74 | |||
| Study site | East of China | 14 | 227497 | 401 | 99.38 | <0.001 | 14.62 | 9.86 | 19.38 | 0.556 | 0.757 |
| West of China | 6 | 1371972 | 488 | 99.94 | <0.001 | 6.41 | 2.41 | 10.40 | |||
| Central China | 2 | 19854 | 18 | 98.55 | <0.001 | 8.68 | 3.51 | 20.87 | |||
| Diagnostic criteria | ABC | 1 | 65651 | 97 | - | - | 14.78 | 13.85 | 15.70 | 4.149 | 0.386 |
| CCMD | 5 | 37859 | 37 | 94.77 | <0.001 | 10.05 | 4.52 | 15.57 | |||
| DSM-III | 1 | 10140 | 3 | - | - | 2.96 | 1.90 | 4.02 | |||
| DSM-IV | 13 | 108131 | 150 | 97.33 | <0.001 | 17.03 | 13.09 | 20.97 | |||
| ICD-10 | 4 | 1994209 | 691 | 99.95 | <0.001 | 10.14 | 8.10 | 12.19 | |||
| Age (years) | ≤2.08 | 5 | 15552 | 82 | 96.92 | <0.001 | 40 | 10 | 140 | 0.976 | 0.323 |
| >2.08 | 4 | 40208 | 128 | 8.861 | <0.001 | 20 | 10 | 70 | |||
Diagnosis tools: ABC, Autism Behavior Checklist; ADOS: Autism Diagnostic Observation Schedule; CCMD, Chinese Classification of Mental Disorders; DSM-III, Diagnostic and Statistical Manual of Mental Disorders, 3rd edition, revised; DSM-IV, Diagnostic and Statistical Manual of Mental Disorders, 4th edition; DSM-V, Diagnostic and Statistical Manual of Mental Disorders, 5th edition; ICD-10, International Classification of Diseases, 10th revision
Prevalence of ASDs based on screening tools
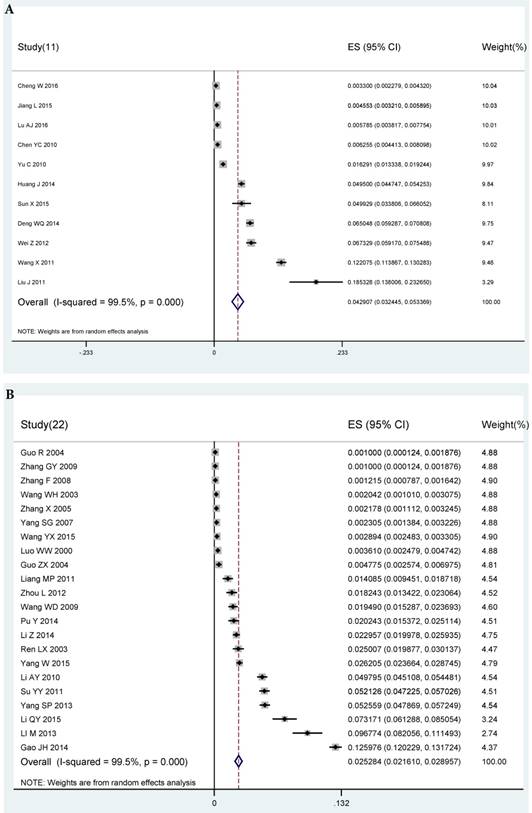
The pooled prevalence of ASDs from 11 studies with available data was 429.07 per 10,000 (95% CI: 324.45 to 533.69 per 10,000, I2=99.5%) (Figure 3A). The prevalence of ASDs in males (503.53 per 10,000) was slightly higher than in females (294.22 per 10,000). Prevalence of ASDs in rural and urban was 50.03 per 10,000 and 141.74 per 10,000, respectively. Median splitting method was used to dichotomize continuous variables in subgroup analysis. Prevalence of ASDs from studies conducted in and before 2012 was 1149.51 per 10,000, while those done after 2012 was 188.30 per 10000. The prevalence of ASDs in eastern China (494.32 per 10,000) was higher than central China (290.11 per 10,000), while no data was available in western China. Age was collapsed into two groups (≤4 years; >4 years) using median splitting method. The prevalence of ASDs in children aged ≤4 years were higher than in children > 4 years (530 per 10,000 vs. 80 per 10,000). Eleven studies using the CABS, CAST, and CHAT, respectively provided different screening rates (422.06 per 10,000 vs. 499.29 per 10,000 vs. 431.86 per 10,000) (Table 3).
Subgroup analyses of prevalence of ASD and autism based on screening tools
| Number of studies | N | Event | I2(%) | P | Prevalence (per 10000) | 95% CI (per 10000); Lower | 95% CI (per 10000); Upper | u-value | p | ||
|---|---|---|---|---|---|---|---|---|---|---|---|
| ASD | 11 | 67321 | 2203 | 99.43 | <0.001 | 429.07 | 324.45 | 533.69 | 1765.58 | ||
| Gender | Males | 4 | 12223 | 287 | 99.09 | <0.001 | 503.53 | 247.72 | 759.35 | 0.258 | 0.612 |
| Females | 4 | 10842 | 160 | 98.49 | <0.001 | 294.22 | 123.97 | 464.48 | |||
| Area | Urban | 4 | 29124 | 479 | 99.25 | <0.001 | 141.74 | 50.67 | 232.81 | 0.023 | 0.88 |
| Rural | 1 | 6796 | 34 | - | - | 50.03 | 33.26 | 66.80 | |||
| Study time | 2009-2012 | 3 | 14370 | 1190 | 99.22 | <0.001 | 1149.51 | 532.33 | 1766.69 | 8.651 | 0.003 |
| 2013-2014 | 4 | 34533 | 575 | 99.58 | <0.001 | 188.30 | 87.97 | 288.63 | |||
| Study site | East of China | 8 | 46187 | 1586 | 99.46 | <0.001 | 494.32 | 362.42 | 626.23 | 0.286 | 0.593 |
| Central China | 3 | 21134 | 617 | 99.45 | <0.001 | 290.11 | 47.37 | 532.84 | |||
| Screening tools | CABS | 5 | 35580 | 1396 | 99.63 | <0.001 | 422.06 | 219.60 | 624.51 | 0.524 | 0.769 |
| CAST | 1 | 701 | 35 | - | 0.012 | 499.29 | 338.06 | 660.52 | |||
| CHAT | 5 | 31040 | 772 | 99.33 | <0.001 | 431.86 | 268.90 | 594.83 | |||
| Age (years) | <=4 | 5 | 29158 | 1536 | 99.37 | <0.001 | 530 | 260 | 1040 | 10.653 | 0.001 |
| >4 | 3 | 22428 | 192 | 96.93 | <0.001 | 80 | 30 | 190 | |||
| Autism | 22 | 223189 | 4467 | 99.60 | <0.001 | 252.84 | 216.10 | 289.57 | 5245.70 | ||
| Gender | Males | 12 | 53265 | 2156 | 99.28 | <0.001 | 377.25 | 264.79 | 354.82 | 0.924 | 0.336 |
| Females | 12 | 46841 | 1120 | 98.53 | <0.001 | 247.89 | 188.23 | 307.54 | |||
| Study time | 1996-2006 | 6 | 42116 | 177 | 99.81 | <0.001 | 39.17 | 11 | 71 | 19.013 | <0.001 |
| 2007-2014 | 9 | 70378 | 1503 | 99.91 | <0.001 | 349.82 | 216.66 | 482.98 | |||
| Study site | East of China | 14 | 177279 | 3436 | 99.73 | <0.001 | 260.11 | 213.92 | 306.29 | 2.241 | 0.524 |
| West of China | 4 | 23942 | 262 | 97.49 | <0.001 | 149.78 | 92.40 | 207.16 | |||
| Central China | 3 | 21968 | 769 | 98.4 | <0.001 | 334.73 | 151.68 | 517.78 | |||
| Screening tools | ABC | 4 | 46116 | 684 | 98.86 | <0.001 | 136.67 | 44.47 | 228.87 | 0.791 | 0.673 |
| CABS | 14 | 138768 | 3136 | 99.65 | <0.001 | 268.94 | 213.49 | 324.39 | |||
| CHAT | 4 | 38305 | 647 | 99.46 | <0.001 | 406.73 | 115.76 | 697.70 | |||
| Age (years) | ≤3.58 | 5 | 23170 | 794 | 98.77 | <0.001 | 290 | 140 | 590 | 0.567 | 0.451 |
| >3.58 | 4 | 51439 | 3018 | 99.54 | <0.001 | 440 | 200 | 950 | |||
Screen tools: ABC, Autism Behavior Checklist; CABS, Clancy Autism Behavior Scale; CARS, Childhood Autism Rating Scale; CHAT, Checklist for Autism in Toddlers; CAST, Children Autism Spectrum Test
A) Forest plot of prevalence of autism spectrum disorders based on screening tools B) Forest plot of prevalence of autism based on screening tools
Prevalence of autism
Prevalence of autism based on clinical diagnostic criteria
The pooled prevalence of autism from 25 studies with available data was 10.18 per 10,000 (95% CI: 8.46-11.89 per 10,000, I2=92.5%) (Figure 2b). The prevalence of autism in males (20.50 per 10,000) was higher than in females (6.12 per 10,000). The prevalence of autism in urban areas was around 2 folds higher than in rural areas (14.80 per 10,000 vs. 6.06 per 10,000). The prevalence of autism from studies conducted after 2008 was higher than those in or before 2008 (20.40 per 10,000 vs. 8.18 per 10,000). The prevalence of autism between the eastern, western and central China showed some variation (14.62 per 10,000 vs. 6.41 per 10,000 vs. 8.68 per 10,000). The prevalence of autism in the group of children aged ≤2.08 years (40 per 10,000) was significantly higher than those aged >2.08 years (20 per 10,000). With the exception of one study reporting a low prevalence (2.96 per 10,000) using the DSM-3, there was no difference in prevalence of autism between other diagnostic criteria (14.78 per 10,000 using ABC, 10.05 per 10,000 using CCMD, 17.03 per 10,000 using DSM-4, and 10.14 per 10,000 using ICD-10) (Table 2).
Prevalence of autism based on screening tools
The pooled prevalence of autism from 22 studies with available data was 252.84 per 10,000 (95% CI: 216.1-289.57 per 10,000, I2=99.5%) (Figure 3B). The prevalence of autism in males (377.25 per 10,000) was higher than in females (247.89 per 10,000). The prevalence of autism from studies conducted in and before 2006 was 39.17 per 10,000, while those done after 2006 had increased to 349.82 per 1000. The prevalence of autism in central China (334.73 per 10,000) was higher than eastern China (260.11 per 10,000) and western China (149.78 per 10,000). The prevalence of autism was different between the two age groups (290 per 10,000 in those aged ≤3.58 years; 440 per 10,000 aged > 3.58 years). Significant difference in the prevalence of autism between different screening tools was observed (136.67 per 10,000 using ABC; 268.94 per 10,000 using CABS; 406.73 per 10,000 using CHAT) (Table 3).
Sensitivity analysis and publication bias
The sensitivity analyses did not find any individual studies that significantly influence the overall results in each diagnostic group. Egger's test revealed publication bias for ASDs (ASDs: t=2.33, P=0.036), but not for autism (t=1.506, P=0.143).
Discussion
This comprehensive meta-analysis of the pooled prevalence of ASDs and autism included 44 studies with 2,337,321 subjects in China covering 30 of the 34 provinces/ municipalities/ autonomous regions of the country. The large variation in prevalence between studies is probably due to methodological differences in sampling methods and screening tools or diagnosis criteria used. This meta-analysis found that the pooled prevalence of ASD based on clinical diagnostic criteria was 39.23 per 10,000, which is lower than in other countries worldwide. For example, Duchan et al. [14] found that the prevalence of ASDs was 60 per 10,000 in North America. In Europe, the median rate of ASD was 61.9 per 10,000 [15], while in the USA the prevalence of ASD was 110 per 10,000 [16]. Further, in Asia the figure was 264 per 10,000 in South Korea [17] and 181 per 10,000 in Japan [18].
On the other hand, the pooled prevalence of autism of 10.18 per 10,000 established by clinical diagnostic criteria was similar to the systemic review of 24 studies in China (12.8 per 10,000) [9] and another meta-analysis of 18 studies (11.8 per 10,000) [10]. Although significant heterogeneity between studies (I2=92.5%) was noted, sensitivity analyses did not find any outlying studies that significantly affect the overall results in each diagnostic group.
Screening tools on ASDs and autism have been widely used in epidemiological surveys globally. Based on such screening tools, in this study the prevalence of ASDs ranged from 33 per 10,000 to 1853.3 per 10,000 with the pooled figure of 429.07 per 10,000, while the prevalence of autism ranged from 10 per 10,000 to 1259.8 per 10,000 with the pooled figure of 252.84 per 10,000. The CABS was the most commonly used screening tool for autism in China [19], but rarely used in Western studies. In contrast, the ADOS and Autism Diagnostic Interview- Revised (ADI-R) were widely used in Western studies. In addition, the ADOS and ADI-R included more information than the CABS. Thus, the discrepancy in screening tools used for ASDs and autism could partly explain the different findings between Chinese and Western studies [10].
Previous studies found that the prevalence of ASD and autism established by clinical diagnostic criteria in males was 3-4 times higher than in females [20, 21], which is consistent with the results of our study. We also found that the pooled prevalence of autism in urban areas was significantly higher than in rural areas, which is concordant with the urban/rural rates in other developed countries, such as in the USA [22]. Various environmental stressors [23], such as prenatal exposure to environmental stress [24] and lower parental education [16] may partly lead to the urban/ rural difference. However, the urban /rural difference was not found in the prevalence of ASDs in this study.
Children aged 2-6 years had the highest prevalence of ASDs in previous surveys. This study found that the age group ≤4 years had a higher prevalence (530 per 10,000) than the group > 4 years (80 per 10,000), which is not consistent with the findings (the highest risk in children aged 4-6 years) in a national survey in China [25]. In China children with ASDs are usually sent to special schools, which may result in an underestimated prevalence of ASDs in school age children in epidemiological surveys. Further, screening tools that have been widely used in China, such as the CABS, were originally designed to be completed by parents [26]. Parents may wish to avoid the diagnosis of autism or hoped that the symptoms would be reversed in their children, which may lead to an underestimation in self-reported surveys [7]. All these factors could contribute to the relatively lower prevalence of ASDs in school age groups [27].
The prevalence of autism based on clinical diagnostic criteria in studies done before the year 2008 (8.18 per 10,000) was significantly lower than that after 2008 (20.4 per 10,000), which was consistent with previous findings [14]. However, the trend appeared to be the opposite in the prevalence of ASDs (38.72 per 10,000 in and before 2012, and 36.36 per 10,000 after 2012). The discrepancy in findings across study period may be related to differences in diagnostic criteria and qualification of interviewers. In addition, children with ASDs usually present with complex symptoms, which could lead to inaccurate diagnosis [28]. The improvement of standardized interview and diagnostic instruments could partly explain the increased prevalence of autism over time.
The results need to be interpreted with caution due to several limitations. First, heterogeneity was present even in subgroup analyses although such heterogeneity is difficult to avoid in epidemiological studies [29]. Second, different screening instruments and diagnostic criteria were used across studies. In order to reduce the relevant heterogeneity, subgroup analyses between different screening instruments and diagnostic criteria were conducted. Third, the 44 studies in this meta-analysis covered 30, but not all the 34 provinces/municipalities/autonomous regions in China. Finally, relevant factors on the prevalence of ASDs, such as socioeconomic and environmental variables, were not recorded in the majority of papers, therefore their impact could not be examined.
In conclusion, the prevalence estimates of ASDs and autism are generally lower in China than in other countries worldwide. Further epidemiological studies with stringent methodology are needed to clarify the variation in prevalence.
Acknowledgements
The study was supported by the University of Macau (MYRG2015-00230-FHS; MYRG2016-00005-FHS) and the Shenzhen Science and technology Innovation Committee (JCYJ 20160429185235132).
Competing Interests
The authors have declared that no competing interest exists.
References
1. Howlin P, Goode S, Hutton J, Rutter M. Adult outcome for children with autism. J Child Psychol Psychiatry. 2004;45:212-29
2. Lord C, Risi S, Lambrecht L, Cook EH Jr, Leventhal BL, DiLavore PC. et al. The autism diagnostic observation schedule-generic: a standard measure of social and communication deficits associated with the spectrum of autism. J Autism Dev Disord. 2000;30:205-23
3. Rapin I, Dunn M. Update on the language disorders of individuals on the autistic spectrum. Brain Dev. 2003;25:166-72
4. Wingate M, Mulvihill B, Kirby RS, Pettygrove S, Cunniff C, Meaney F. et al. Prevalence of autism spectrum disorders-Autism and Developmental Disabilities Monitoring Network, 14 sites, United States, 2008. MMWR Surveill Summ. 2012;61:1-19
5. Fombonne E. Epidemiological surveys of autism and other pervasive developmental disorders: an update. J Autism Dev Disord. 2003;33:365-82
6. Yeargin-Allsopp M, Rice C, Karapurkar T, Doernberg N, Boyle C, Murphy C. Prevalence of autism in a US metropolitan area. JAMA. 2003;289:49-55
7. Baron-Cohen S, Scott FJ, Allison C, Williams J, Bolton P, Matthews FE. et al. Prevalence of autism-spectrum conditions: UK school-based population study. Br J Psychiatry. 2009;194:500-9
8. Sun X, Allison C. A review of the prevalence of Autism Spectrum Disorder in Asia. Research in Autism Spectrum Disorders. 2010;4:156-67
9. Wan Y, Hu Q, Li T, Jiang L, Du Y, Feng L. et al. Prevalence of autism spectrum disorders among children in China: a systematic review. Shanghai Arch Psychiatry. 2013;25:70-80
10. Sun X, Allison C, Auyeung B, Matthews FE, Zhang Z, Baron-Cohen S. et al. Comparison between a Mandarin Chinese version of the Childhood Autism Spectrum Test and the Clancy Autism Behaviour Scale in mainland China. Res Dev Disabil. 2014;35:1599-608
11. Boyle MH. Guidelines for evaluating prevalence studies. Evidence-based mental health. 1998;1:37-40
12. Yang C, Zhang L, Zhu P, Zhu C, Guo Q. The prevalence of tic disorders for children in China: A systematic review and meta-analysis. Medicine (Baltimore). 2016;95:e4354
13. Higgins JP, Thompson SG, Deeks JJ, Altman DG. Measuring inconsistency in meta-analyses. BMJ. 2003;327:557-60
14. Duchan E, Patel DR. Epidemiology of autism spectrum disorders. Pediatr Clin North Am. 2012;59:27-43
15. Elsabbagh M, Divan G, Koh YJ, Kim YS, Kauchali S, Marcin C. et al. Global prevalence of autism and other pervasive developmental disorders. Autism research. 2012;5:160-79
16. Kogan MD, Blumberg SJ, Schieve LA, Boyle CA, Perrin JM, Ghandour RM. et al. Prevalence of parent-reported diagnosis of autism spectrum disorder among children in the US, 2007. Pediatrics. 2009;124:1395-403
17. Kim YS, Leventhal BL, Koh YJ, Fombonne E, Laska E, Lim EC. et al. Prevalence of autism spectrum disorders in a total population sample. Am J Psychiatry. 2011;168:904-12
18. Kawamura Y, Takahashi O, Ishii T. Reevaluating the incidence of pervasive developmental disorders: impact of elevated rates of detection through implementation of an integrated system of screening in Toyota, Japan. Psychiatry Clin Neurosci. 2008;62:152-9
19. Sun X, Allison C, Auyeung B, Matthews FE, Baron-Cohen S, Brayne C. What is available for case identification in autism research in mainland China? Res Autism Spectr Disord. 2013;7:579-90
20. Manning SE, Davin CA, Barfield WD, Kotelchuck M, Clements K, Diop H. et al. Early diagnoses of autism spectrum disorders in Massachusetts birth cohorts, 2001-2005. Pediatrics. 2011;127:1043-51
21. Van Wijngaarden-Cremers PJ, van Eeten E, Groen WB, Van Deurzen PA, Oosterling IJ, Van der Gaag RJ. Gender and age differences in the core triad of impairments in autism spectrum disorders: a systematic review and meta-analysis. J Autism Dev Disord. 2014;44:627-35
22. Williams JG, Higgins JP, Brayne CE. Systematic review of prevalence studies of autism spectrum disorders. Arch Dis Child. 2006;91:8-15
23. Newschaffer CJ, Croen LA, Daniels J, Giarelli E, Grether JK, Levy SE. et al. The epidemiology of autism spectrum disorders. Annu Rev Public Health. 2007;28:235-58
24. Kinney DK, Munir KM, Crowley DJ, Miller AM. Prenatal stress and risk for autism. Neurosci Biobehav Rev. 2008;32:1519-32
25. Li N, Chen G, Song X, Du W, Zheng X. Prevalence of autism-caused disability among Chinese children: a national population-based survey. Epilepsy Behav. 2011;22:786-9
26. Sun X, Allison C, Matthews FE. Prevalence of autism in mainland China, Hong Kong and Taiwan: a systematic review and meta-analysis. Mol Autism. 2013;4:13
27. Lu AJ, Wang YF, Jiang LX. Epidemiological characteristics of autism spectrum disorder in Songjiang district, Shanghai (in Chinese). Journal of Neuroscience and Mental Health. 2016;16:2
28. Baird G, Simonoff E, Pickles A, Chandler S, Loucas T, Meldrum D. et al. Prevalence of disorders of the autism spectrum in a population cohort of children in South Thames: the Special Needs and Autism Project (SNAP). Lancet. 2006;368:210-5
29. Patsopoulos NA, Evangelou E, Ioannidis JP. Sensitivity of between-study heterogeneity in meta-analysis: proposed metrics and empirical evaluation. Int J Epidemiol. 2008;37:1148-57
30. Luo WW, Lin L, Chen Y, Cheng WT. Epidemiological investigation on autistic disorder in Fujian province. Shanghai Archives of Psychiatry 2013. 2000;12:3-5
31. Jiang LP, Li R. Mental Health survey for children in Luoyang Pref ecture of Henan Province (in Chinese). China Journal of Health Psychology. 2000
32. Ren LZ. An epidemiology study on autism behavior of preschool children in Tongling [thesis] (in Chinese): Anhui Medical University. 2001.
33. Zhang GY, Xu YR. Epidemiological survey of autistic children in Yunyan District of Guiyang (in Chinese). Journal of Guiyang Medical College. 2009;34:463
34. Guo R. Epidemilogical investigation analysis of 5000 children between 0-6 years old with children autism in Tianjing City (in Chinese). Chinese Journal of Clinical Rehabilitation. 2004;8:1122-3
35. Wang WH, Zhai LW, Zheng L. An epidemiological investigation on autistic disorder in Changzhou (in Chinese). Journal of Clinical Psychiatry. 2002;12:148-9
36. Yang SG. Prevalence Investigation of Autismin Children (in Chinese). Journal of Applied Clinical Pediatrics. 2007;22:1872-3
37. Liu J, Yang XL, Jiang MX. Survey on pervasive developmental disorder in 2-6 years children in Beijing (in Chinese). Chinese Mental Health Journal. 2010;26:2
38. Guo ZX. Epidemiological survey of 2 to 6-year-old mentally disabled children in Dingxi County (in Chinese). Chinese Journal of Rehabilitation Theory and Practice. 2004;10:118-19
39. Zhang X, Ji YC. The investigation of autism in children aged 2 to 6 years old in Tianjin (in Chinese). Chinese Journal of Reproductive Health. 2004;15:206-8
40. Ji N, Huang YQ, Li H, Liu ZR. A cross-sectional study of disability prevalence attributable to autism spectrum disorders and its distribution in children and adolescents in China. Chinese Mental Health Journal. 2014;28:813-16
41. Su YY, Zhang X. Prevalence and risk factors of infantile autism in Tianjin (in Chinese). Maternal and Child Health Care of China. 2011;26:5004-7
42. Zhang F. The latest investigation of autism epidemic of children aged from 1 to 6 years old in Wuxi city (in Chinese). Maternal and Child Health Care of China. 2008;23:3878-80
43. Wang WD, Xiao WG. Autism Survey f or 2 to 6- year-old Child in Meizhou (in Chinese). China Journal of Health Psychology. 2009;17:2
44. Pu.Y Zhang J. Prevalence of autism among young children aged 2 to 6 years in Yunyan district of Guiyang city (in Chinese). Chinese Journal of Public Health. 2014;30:3
45. Huang JP, Cui SS, Han Y, Hertz-Picciotto I, Li Hong QI, Zhang X. Prevalence and early signs of autism spectrum disorder (ASD) among 18-36-Month-old children in Tianjin of China. Biomed Environ Sci. 2014;27:453-61
46. Zhou L, Shi JX. Clinical diagnosis of infantile autism. China Modern Doctor. 2012;50:50-1
47. Wu XQ, Lu Y. Investigation of childhood autism status in Lianyungang city (in Chinese). Modern Medicine & Health. 2010;26:3724-6
48. Chen YC, Huang HT, Zhao YR. Epidemiological study of autism spectrum disorders children in 2 to 6 years old in Ranghu dictrict in Daqing City (in Chinese). Chinese Journal of Child Health Care. 2010;18:331-3
49. Liang MP, Chen QL, Liu CH. Analysis of screening for autism in preschool children in Maoming (in Chinese). Maternal and Child Health Care of China. 2011;26:1164-5
50. Li J. Research on early screening of autism spectrum disorders and case analysis on the clinical data of autistic children [master thesis] (in Chinese): Fudan University. 2011.
51. Wang X, Yang W-H, Jin Y, Jing J, Huang X, Li X-H. et al. Prevalence of autism spectrum disorders in preschool children of Guangzhou kindergartens. Chinese Mental Health Journal. 2011;25:401-8
52. YU C. Survey on autistic spectrum disorders in 2 to 6 years old children in Harbin city (in Chinese). Chinese Journal of Child Health Care. 2010;18:750-3
53. Li AY, Zhang X. Analysis of behavioral characteristic of children with autism aged 1.5 to 3 years old (in Chinese). Chinese Mental Health Journal. 2010;24:215-8
54. Li M. Study on the Chinese version of the modified autism scale for infants [master thesis] (in Chinese): GuiYang Medical University. 2013.
55. Wei Z, Ren LZ. Early screening on autism spectrum disorder in 18 to 24-month-old children in Shenzhen: 3 years follow up study (in Chinese). Chinese Journal of Child Health Care. 2012;20:354-7
56. Wang YJ. Analysis on application of DSM-V in early screening of autism spectrum disorder children. Maternal and Child Health Care of China. 2015;30:2011-4
57. Li Z, Zhao LL. Epidemiological investigation on 10,000 children of 0 to 6 years with autism in Chuangchun City (in Chinese). Journal of Community Medicine. 2014;12:11-3
58. Chen Q, Huang LX, Xu WJ. Research on the prevalence and their risk factors of autism spectrum disorder from 1.5 to 3 years old in Zhuhai city (in Chinese). Chinese Journal of Child Health Care. 2014;22:649-51
59. Zhuo K, Lu Y, Yang Z, Fan X, Song Z, Liao L. et al. Prospective memory performance in patients with drug-naïve. first-episode psychosis. 2013;28:1613-6
60. Duan GQ, Yao HL. Early Detection of Autism Spectrum Disorders in Infants and Young Children (in Chinese). Henan Journal of Preventive Medicine. 2013;24:255-60
61. Wu JR. Study of prevalence and relative factors to the children's autism in Ningxia [master thesis] (in Chinese). NingXia Medical University. 2013
62. Li QY. Early screening of autism for 18-24 months old children in communities and case studies [master thesis] (in Chinese). Guangzhou Medical University. 2015
63. Wang ZL, Li HT. Prevalence of autism and dysfunctions in autistic children aged 3 to 6 years in Shantou City (in Chinese). Chinese Journal of Reproductive Health. 2014;25:491-4
64. Gao JH. Investigation on the hyperactive behavior and the effect factors among the preschool children in Zhongshan city. Maternal and Child Health Care of China. 2012;20:1365-69
65. Deng WQ. The research of prevalence and correlative factors of autism disorders among preschool in Hengyang [master thesis] (in Chinese). Nanhua Unversity. 2014
66. Wang YX. Prevalence of autism among children aged 2-6 years in Jiangmen. Chinese Journal of Birth Health and Heredity. 2015;23:133
67. Wang GX, Li X. Correlation analysis and investigation of autism spectrum disorder in 2 to 6 years old children of Zaozhuang (in Chinese). Chinese Journal of Child Health Care. 2015;23:1322-5
68. Yang W, Xia H, Wen G, Liu L, Fu X, Lu J. et al. Epidemiological investigation of suspected autism in children and implications for healthcare system: a mainstream kindergarten-based population study in Longhua District, Shenzhen. BMC pediatrics. 2015;15:207
69. Jiang LX, Li GZ, Hao LL. Epidemiological investigation on autism spectrum disorders among preschool children in Shanghai (in Chinese). Chinese Journal of Epidemiology. 2015;36:1365-8
70. Sun X, Allison C, Matthews FE, Zhang Z, Auyeung B, Baron-Cohen S. et al. Exploring the Underdiagnosis and Prevalence of Autism Spectrum Conditions in Beijing. Autism Res. 2015;8:250-60
71. Lu AJ. Epidemiological characteristics of autism spectrum disorder in Songjiang district, Shanghai (in Chinese). Nervous Diseases and Mental Health. 2016;16:24-6
72. Cheng W. Investigation of autism spectrum disorders in 1 to 6-year-old children in Ningbo (in Chinese). Preventive Medicine. 2016;28:1168-71
73. Tian JL. Prevalence and Influencing Factors of Autism Spectrum Disorders in Public Primary School (in Chinese). Chinese Journal of Clinical Psychology. 2016;24:277-81
Author contact
![]() Corresponding authors: Dr. Yu-Tao Xiang, 3/F, Building E12, Faculty of Health Sciences, University of Macau, Avenida da Universidade, Taipa, Macau SAR, China. Fax: +853-2288-2314; Phone: +853-8822-4223; E-mail: xyutlycom; or Dr. Fu-Jun Jia, Guang Dong Mental Health Centre, Guangdong province, China. E-mail: jiafujuncom
Corresponding authors: Dr. Yu-Tao Xiang, 3/F, Building E12, Faculty of Health Sciences, University of Macau, Avenida da Universidade, Taipa, Macau SAR, China. Fax: +853-2288-2314; Phone: +853-8822-4223; E-mail: xyutlycom; or Dr. Fu-Jun Jia, Guang Dong Mental Health Centre, Guangdong province, China. E-mail: jiafujuncom