Impact Factor ISSN: 1449-2288

 Global reach, higher impact
Int J Biol Sci 2018; 14(8):883-891. doi:10.7150/ijbs.24616 This issue Cite
Research Paper
iRSpot-Pse6NC: Identifying recombination spots in Saccharomyces cerevisiae by incorporating hexamer composition into general PseKNC
Hui Yang1, Wang-Ren Qiu1,2, Guoqing Liu3, Feng-Biao Guo1, Wei Chen1,4,5 ![]() , Kuo-Chen Chou1,5
, Kuo-Chen Chou1,5 ![]() , Hao Lin1,5
, Hao Lin1,5 ![]()
1. Key Laboratory for Neuro-Information of Ministry of Education, School of Life Science and Technology, Center for Informational Biology, University of Electronic Science and Technology of China, Chengdu 610054, China;
2. Computer Department, Jingdezhen Ceramic Institute, Jingdezhen, 333403, China;
3. School of Life Science and Technology, Inner Mongolia University of Science and Technology, Baotou, 014010, China.
4. Department of Physics, School of Sciences, and Center for Genomics and Computational Biology, North China University of Science and Technology, Tangshan 063000, China
5. Gordon Life Science Institute, Boston, MA 02478, USA
Received 2017-12-28; Accepted 2018-2-4; Published 2018-5-22
Abstract

Meiotic recombination caused by meiotic double-strand DNA breaks. In some regions the frequency of DNA recombination is relatively higher, while in other regions the frequency is lower: the former is usually called “recombination hotspot”, while the latter the “recombination coldspot”. Information of the hot and cold spots may provide important clues for understanding the mechanism of genome revolution. Therefore, it is important to accurately predict these spots. In this study, we rebuilt the benchmark dataset by unifying its samples with a same length (131 bp). Based on such a foundation and using SVM (Support Vector Machine) classifier, a new predictor called “iRSpot-Pse6NC” was developed by incorporating the key hexamer features into the general PseKNC (Pseudo K-tuple Nucleotide Composition) via the binomial distribution approach. It has been observed via rigorous cross-validations that the proposed predictor is superior to its counterparts in overall accuracy, stability, sensitivity and specificity. For the convenience of most experimental scientists, the web-server for iRSpot-Pse6NC has been established at
Keywords: Recombination spot, 5-step rules, Key hexamers, PseKNC, SVM, Webserver
Introduction
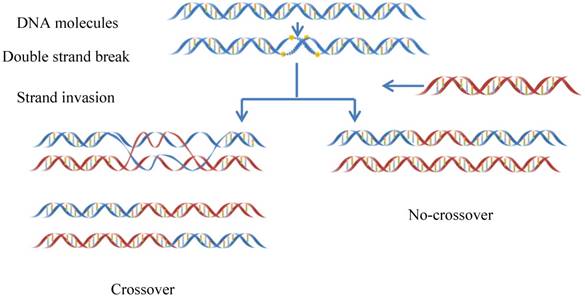
Meiotic recombination occurs at each generation in diploid organisms, which is caused by meiotic double-strand DNA breaks (DSBs)[1](Figure 1). Meiosis can guarantee not only the stability of the chromosome number of species but also a species evolving mechanism to adapt to the environment changes [2]. Recombination can lead to a change in genetic information between homologous chromosomes. Thus, it is one of main driving forces in genome evolution. The frequency of DNA recombination in some regions is relatively higher as referred to recombination hotspots, while in other regions the frequency is lower referred to the recombination coldspots [3-5].
The schematic drawing to show the meiotic recombination pathways in a DNA system.
There have been many in-depth studies of recombination sites [3; 6-9]. Gerton et al. [3] mapped double-strand break sites on chromosomes in the Saccharomyces cerevisiae (S. cerevisiae), and found that hotspots were non-randomly associated with regions of high GC base composition, while coldspots were non-randomly associated with the centromeres and telomeres. Some hotspots that require transcription factor binding are called α hotspots, and others are called β hotspots [3]. Recently, there have been new developments on the research of recombination sites. ChIP experiments showed that substantial Spo11 persists at Rec8 binding sites during DSB formation [10]; PRDM9, as a catalytic H3K4 trimethylated histone trimethylase, is involved in the initiation of recombination and recombination with recombination hot spots [11], found that the regions with high nucleosome occupancy have high recombination rate in the yeast genome [12].
The correct identification of recombination spots can provide important clues for understanding the evolution mechanism. Generally, biochemical experiments can produce accurate information for determine recombination spots. However, with the development of high-throughput sequencing technique, more and more genome data were generated, thus, determining recombination spots with these wet-experiments requires more and more expensive experimental materials and long experimental period. Machine learning-based methods are a good choice for timely and accurately identifying the recombination spots. Up to now, some methods have been developed to identify recombination spot. Jiang et al. firstly developed a new model based on gapped dinucleotide composition and random forest (RF) to predict meiotic recombination hotspots and coldspots in S. cerevisiae [13]. In the meantime, Zhou et al. established an SVM-based model to discriminate hotspots from coldspots in S. cerevisiae by using codon composition [14]. Subsequently, Liu et al. proposed to use the increment of diversity combined with quadratic discriminant for predicting the recombination spots [15]. Chen et al. developed a new DNA sample descriptor called pseudo dinucleotide composition (PseDNC) to improve prediction accuracy for the recombination hotspots and coldspots [16]. According to the concept of PseDNC, Li et al. [17] and Qiu et al. [18] also developed different prediction models to address this problem. Liu et al. incorporated the weight of features into recombination hotspots prediction model [19]. A predictor called iRSpot-DACC was also presented to predict recombination hotspots and coldspots [20]. Recently, the same problem was further investigated by including the Z curve approach [21], and the ensemble learning approach [22].
Although the aforementioned methods could achieve quite encouraging results, further studies are needed due to the following reasons. (i) The DNA samples used to train the models are with different length, which prevents them from establishing a widely useful model because users do not know how long the working length should be used for a query DNA sequence. For example, in using the aforementioned methods to scan a chromosome, we do not know the optimal width of the scan window [23] for the biological sequence concerned. In fact, for the published webserver based on those methods, only a prediction will be given even for a chromosome with a length of thousands base pairs. However, there are many recombination points in the genome. Therefore, most of those models are quite limited for practical applications. (ii) Some works [13; 14; 21; 24] used codon composition or coding region information to formulate DNA samples. However, recombination spots are not always located in coding regions. Some non-coding regions may also contain recombination spots. Thus, these methods could not identify recombination spots in the intergenic regions. (iii) The prediction results are still far from satisfactory yet; the accuracy should be further improved. (iv) Only three webservers were published. For the convenience of most experimental scientists, more user-friendly webservers in this regard are needed.
The present study was devoted to develop a more powerful predictor in this area by considering the aforementioned four issues. To make the new predictor more clear in logical development and more useful in practical application, the Chou's 5-step rules [25] were followed as reported in a series of recent studies (see, e.g., [26-35]).
Materials and Methods
Benchmark dataset: hot/cold spots DNA sequences
According to the Chou's 5-step rules, the first prerequisite to establish an effective predictor for a biological system is to construct or select a high quality benchmark dataset. In this study, the raw data was derived from Gerton et al. [3], who used DNA microarray as the single-gene resolution method to estimate the DSBs formation adjacent to each ORF for the S. cerevisiae loci. They measured the ratio of DSB-rich probes hybridized to total genomic probes. Based on the experimental data, Jiang et al. [13] constructed a benchmark dataset including 490 recombination hotspots and 591 coldspots.
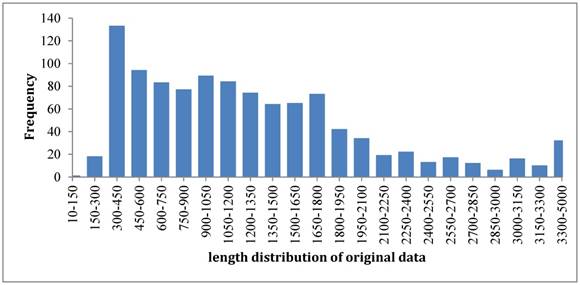
So far most of the existing models [13-20] were built up based on such benchmark dataset. The length distribution of original samples was shown in Figure 2. It was noticed that the length distributed in a wide range from the shortest one of 131 bp to the longest one of thousands bp. To overcome such a shortcoming, we rebuilt the benchmark dataset according to the strategy that recombination hotspots were correlated with peaks of G+C base composition [3]. By doing so, we unified the length of each sample to 131 bp because the length of shortest sequence is 131 bp. For those sequences with >131 bp, we chose their subsequences with 131 bp that have the maximum GC content. As a result, the new dataset also has 490 samples for recombination hotspots and 591 samples for recombination coldspots, but all the sequences are 131 bp long now. The new benchmark dataset can be downloaded from the link at http://lin-group.cn/server/iRSpot-Pse6NC.
The length distribution of benchmark dataset samples.
Hexamer composition and its PseKNC vector
How to translate a DNA sequence D with L bases into a vector is the second important step to develop a predictor for discriminating recombination hotspots from recombination coldspots. This is because all the existing machine-learning algorithms can only handle vectors but not sequences as elaborated in [36]. But a vector in a discrete framework might totally lose all the sequence-order or pattern information. To deal with this problem, the PseAAC (Pseudo Amino Acid Composition) was introduced [37]. Ever since the concept of PseAAC was proposed, it has been swiftly penetrated into many biomedicine and drug development areas [38; 39] as well as nearly all the areas of computational proteomics (see, e.g., [40-48] and a long list of references cited in a recent review paper [49]). Encouraged by the successes of using PseAAC to deal with protein/peptide sequences, its idea has been extended to deal with DNA/RNA sequences [16; 22; 24; 32; 50] in computational genomics via PseKNC (Pseudo K-tuple Nucleotide Composition) [51; 52]. According to [53], for a DNA sample with L nucleic acid residues:
(1)
its general form of PseKNC can be formulated as:
(2)
where T is the transposing operator, the subscript  is an integer, and its value and the components
  will depend on how to extract the desired features and properties from the DNA sequence. In this study, their definitions are described below.
K-tuple (or called K-mer) nucleotide composition has important biological significance [54] that the whole DNA sequence can be uniquely determined from the K-tuple nucleotide frequency distribution; i.e., the frequency distribution of K-tuple nucleotide contains mostly the information of the DNA sequence. And K-mer nucleotide composition has been widely used in gene identification [55] and other regulatory element recognition [24; 56-59]. Several studies [60,61] have shown that hexamer (6-mer) distribution has unique properties among species and different DNA fragments. Thus, we have the dimension of PseKNC in Eq.2 is:
(3)
and its components given by:
(4)
where  and L denote the number of the u-th hexamer and the length of the sample sequence, respectively. Thus, the DNA sample has been uniquely defined in a 4096-D PseKNC vector.
The rule for ranking features
The DNA sequence is represented by a set of 4096 features, which may bring out three problems [62-63]: (1) containing some redundant or irrelevant information; (ii) leading to an over-fitting model and reducing its flexibility; (iii) causing the curse of dimensionality and dyscalculia. However, we can improve these problems by means of the feature selection approach [64]. Many effective feature selection techniques have been proposed, such as diffusion Maps [65], principal component analysis (PCA) [66-68], analysis of variance (ANOVA) [69; 70], recursive feature elimination algorithm [71; 72] and geometry preserving projections (GPP) [73] and so on. These techniques are all quite efficient in alleviating the interference from noise or irrelevant features so as to improve the prediction quality.
Here, let us define a prior probability given by

(5)
where M is the total occurrence times of all hexamers in the benchmark dataset (including both positive and negative samples), and  represents the number of hexamers in the i-th type with i = 1 referring to the positive subset whereas i=2 referring to the negative subset.
Now, the probability of the j-th hexamers occurring in type i can be formulated as
(6)
where  represents the total occurrence number of a given j-th hexamer in the benchmark dataset. The smaller the P(
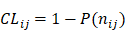
 ), the lower the probability of the j-th hexamer randomly occurring in type i, meaning the hexamer has more biological significance. The confidence level (CL) of the j-th hexamer occurring in i-th type of sample is defined by:
(7)
Suppose:
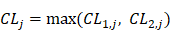
(8)
thus the 4096 hexamers can be ranked according to the values of Eq.8.
Support vector machine
Support vector machine (SVM) is a supervised machine learning algorithm based on statistical learning theory, and has been successfully applied in the field of bioinformatics [74]. The basic idea of SVM is to transform the data into a high dimensional feature space and then determine the optimal separating hyper plane. For a brief formulation of SVM and how it is working, see the papers [75; 76]; for more details about SVM, see a monograph [77]. In this study, we used the free software LIBSVM 3.20, which was developed by Chang and Lin [78]. Due to its good performance for classification, the radial basis kernel function was used to obtain the best classification hyper plane. The two parameters, C and γ, which were preliminarily optimized through a grid search strategy.
The proposed predictor thus built up is called iRSpot-Pse6NC, where “i” stands for “identify”, “RSpot” for “Recombination Spots”, and “Pse6NC” for “Pseudo 6-tuple Nucleotide Composition”.
Results and Discussion
Cross-validation
To evaluate the quality of a new predictor, one needs to consider the following two things: (i) what metrics should be used to measure its performance? (ii) what test method should be adopted to calculate these metrics? In literature, the following four metrics are usually used to measure a predictor's quality [79]: (i) overall accuracy (Acc); (ii) stability (MCC); (iii) sensitivity (Sn); and (4) specificity (Sp). But their conventional expressions directly taken from math books are lack of intuition and difficult to understand by most biological scientists. Fortunately, by means of the symbols introduced by Chou in studying signal peptides [23], the four conventional metrics can be converted to a set of intuitive ones [16; 80; 81] as given below:
(9)
where  represents the total number of positive samples investigated, while
  is the number of positive samples incorrectly predicted to be of negative one;
  the total number of negative samples investigated, while
  the number of the negative samples incorrectly predicted to be of positive one.
As pointed out by many recent publications (see, e.g., [22; 32; 33; 50; 82-90]), the meanings of Sn, Sp, Acc, and MCC have become crystal clear when using Eq.9.
With a set of intuitive metrics, the next thing is how to test their values. As is well known, the independent dataset test, subsampling (or K-fold cross-validation) test, and jackknife test are the three cross-validation methods widely used for testing a prediction method [91]. To reduce the computational cost, in this study we adopted the 5-fold cross-validation (namely K=5), as done by many investigators with SVM as the prediction engine (see, e.g., [24; 26; 92-95]).
Comparison with existing methods
Listed in Table 1 are the metrics rates (Eq.9) achieved by iRSpot-Pse6NC via the 5-fold cross-validation on the benchmark dataset. For facilitating comparison, listed there are also the corresponding rates obtained by iRSpot-PseDNC [16], iRSpot-KNCPseAAC [18], and IDQD [15] using exactly the same cross-validation method and same benchmark dataset. As we can see from the table, the rates achieved by iRSpot-Pse6NC are remarkably higher than its cohorts in all the four metrics, clearly indicating the proposed predictor is indeed superior to the existing predictors in this area.
A comparison of the proposed predictor with the existing ones.
| Method | Sna | Spa | Acca | MCCa |
|---|---|---|---|---|
| iRSpot-Pse6NCb | 0.7571 | 0.9103 | 0.8408 | 0.6805 |
| iRSpot-PseDNCc | 0.6234 | 0.9052 | 0.7792 | 0.5585 |
| iRSpot-KNCPseAACd | 0.6102 | 0.8951 | 0.7660 | 0.5334 |
| IDQDe | 0.6959 | 0.7509 | 0.7259 | 0.4469 |
Feature analysis
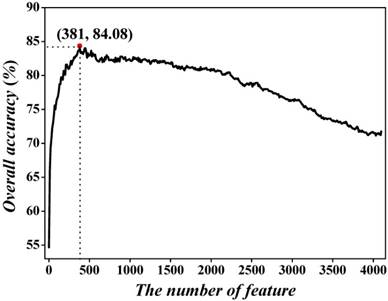
As mentioned in section 2.3, the dimension for the hexamer vector is 4096, which is too large to avoid the high-dimension problems. To exclude the noise and redundant features, we used the incremental feature selection (IFS) to find out the best feature subset to maximize accuracy. We initially ranked the 4096 hexamers according to Eqs.5-8. Subsequently, the 4096 feature subsets were obtained, in which the first feature subset contained the first hexamer, the second feature subset was produced by adding the second hexamer into the first feature subset, and so on. Thirdly, the SVM with 5-fold cross-validation was adopted to examine the accuracies of 4096 feature subsets. By using Acc as vertical coordinates and feature number as horizontal coordinates, we plotted IFS curve in Figure 3. One may notice that the peak of the curve is 84.08%, which is located at horizontal coordinate of 381. This result (84.08%) is dramatically higher than that (71.04%) of all features. Meanwhile, we also dramatically reduced the considered features from 4096 to 381, indicating that our proposed feature selection technique could pick out the optimal hexamers so as to further improve the prediction quality. Accordingly, the 381 hexamers were selected to form the optimal feature subset to train the prediction model.
The 5-fold cross-validated IFS curve for predicting recombination hotspots and coldspots. An IFS peak of 84.08% was observed when using the top 381 hexamers to perform prediction.
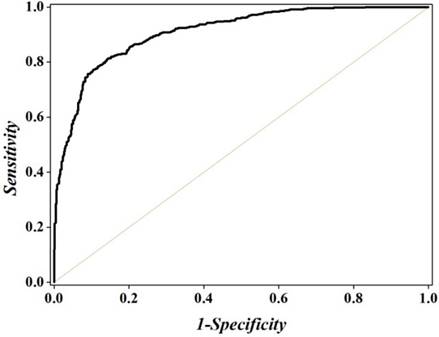
To further investigate the performance of the optimal model across the entire range of SVM decision values, we drew the ROC curve [96] in Figure 4. It shows that the AUC (the Area Under ROC Curve) reaches the value of 0.9084, indicating that the proposed method is quite promising and holds very high potential to become a useful high-throughput tool for predicting recombination spots.
The ROC curve for identifying recombination spots by using 381 optimal hexamers. The AUC of 0.9084 was obtained in 5-fold cross-validation. The diagonal dot line denotes a random guess with the AUC of 0.5.
For further analyzing the contributions of different features in the prediction model, a heat map [97] was provided (Figure 5), which is a graphical representation of a matrix by using different colors according to its CL values scaled between 0 and 1. As we can see from Figure 5, for the 4096 different hexamers, the majority of them are blue or green, indicating that most of them are irrelevant to the recombination spot recognition.
A heat map to illustrate the CL of the 4096 different hexamers. The color scale is ranged from blue (low CL) through green and yellow to red (high CL). See the main text for further explanation. A higher resolution version can be found at http://lin-group.cn/server/iRSpot-Pse6NC/heatmap2.jpg.
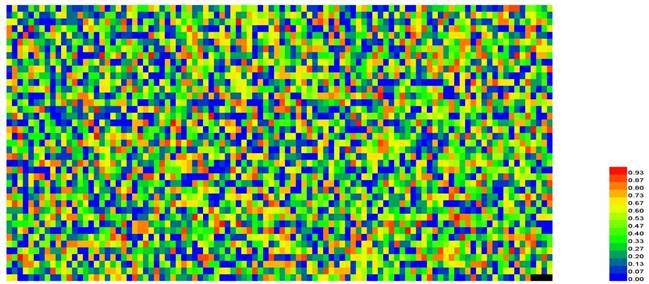
It can be seen from Figure 5 that those regions with high GC content, e.g., the hexamers CGCCGG, AGCCGG and GCAGCT, GCCGGA, AGTGGG are with the CL values ranking top five among all the features and with the confidence level of CL > 98.3%.
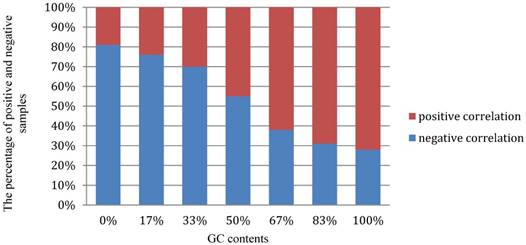
Moreover, we performed a detail analysis on the 381 optimal hexamers with CL>98.3% to investigate the relationship between the features and GC content (Figure 6). In this figure, abscissa coordinate denotes the GC content distribution from 0% -100%, and the vertical axis indicates that the percentage of positive and negative samples at the GC content shown on the abscissa. It can be seen from the figure that the optimal hexamers with high GC content have a higher proportion in positive samples, whereas hexamers with lower GC contents have a higher proportion of negative samples. This means that there is a close relationship between GC content and the hot spots, once again proofing that the way we handled the data is fully valid.
The graph to show the relationship between the important features and GC content.
Web-server and user guide
As pointed out in [25] and demonstrated in many follow-up publications (see, e.g., [28; 30; 32; 35; 81; 98-116]), user-friendly and publicly accessible web-servers represent the future direction for developing practically more useful predictors. Actually, a new prediction method with the availability of a user-friendly web-server would significantly enhance its impacts [36; 49]. In view of this, the web-server for iRSpot-Pse6NC has been established. Furthermore, to maximize the convenience of most experimental scientists, the step-by-step instructions are given below.
Step 1. Open the web server at http://lin-group.cn/server/iRSpot-Pse6NC and you will see the top page of`iRSpot-Pse6NC shown on your computer screen (Figure 7).
A semi-screenshot for the top page of the iRSpot-Pse6NC webserver at http://lin-group.cn/server/iRSpot-Pse6NC.
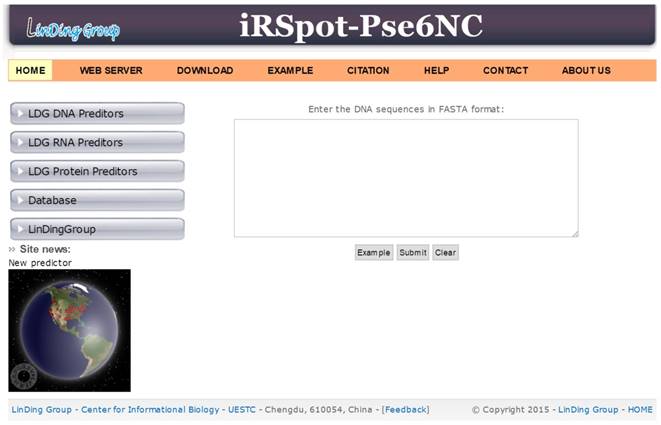
Step 2. Click on the WEB SERVER button to start the prediction. Either type or copy/paste the query DNA sequences into the input box at the center of Figure 7. The input sequences should be in the FASTA format. And click on the Submit button to see the predicted result.
Step 3. Click on the DOWNLOAD button to download the benchmark data sets used to train and test the iRSpot-Pse6NC predictor.
Step 4. Click on the CITATION button to find the relevant papers that document the detailed development and algorithm of iRSpot-Pse6NC.
Step 5. Click on the HELP button to view the relevant instructions and the caveat when using it.
Acknowledgements
This work was supported by the National Nature Scientific Foundation of China (61772119, 31771471), Applied Basic Research Program of Sichuan Province (No. 2015JY0100), the Fundamental Research Funds for the Central Universities of China (Nos. ZYGX2015Z006, ZYGX2016J125, ZYGX2016J118), Natural Science Foundation for Distinguished Young Scholar of Hebei Province (No. C2017209244), the Program for the Top Young Innovative Talents of Higher Learning Institutions of Hebei Province (No. BJ2014028).
Author Contributions
H.L. conceived and designed the experiments; H.Y., W.R.Q., G.L., F.B.G. and W.C. analyzed the data and implemented SVM. H.Y., H.L. and W.C. established the web-server; H.Y., W.C., K.C.C. and H.L performed the analysis and wrote the paper. All authors read and approved the final manuscript.
Competing Interests
The authors have declared that no competing interest exists.
References
1. Keeney S. Spo11 and the Formation of DNA Double-Strand Breaks in Meiosis. Genome Dyn Stab. 2008;2:81-123
2. Zenvirth D, Arbel T, Sherman A. et al. Multiple sites for double-strand breaks in whole meiotic chromosomes of Saccharomyces cerevisiae. EMBO J. 1992;11:3441-7
3. Gerton JL, DeRisi J, Shroff R. et al. Global mapping of meiotic recombination hotspots and coldspots in the yeast Saccharomyces cerevisiae. Proc Natl Acad Sci U S A. 2000;97:11383-90
4. Marais G, Mouchiroud D, Duret L. Does recombination improve selection on codon usage? Lessons from nematode and fly complete genomes. Proc Natl Acad Sci U S A. 2001;98:5688-92
5. Myers S, Bottolo L, Freeman C. et al. A fine-scale map of recombination rates and hotspots across the human genome. Science. 2005;310:321-4
6. Baudat F, Nicolas A. Clustering of meiotic double-strand breaks on yeast chromosome III. Proc Natl Acad Sci U S A. 1997;94:5213-8
7. Klein S, Zenvirth D, Dror V. et al. Patterns of meiotic double-strand breakage on native and artificial yeast chromosomes. Chromosoma. 1996;105:276-84
8. Kohl KP, Sekelsky J. Meiotic and mitotic recombination in meiosis. Genetics. 2013;194:327-34
9. Lichten M, Goldman AS. Meiotic recombination hotspots. Annu Rev Genet. 1995;29:423-44
10. Ito M, Kugou K, Fawcett JA. et al. Meiotic recombination cold spots in chromosomal cohesion sites. Genes Cells. 2014;19:359-73
11. Parvanov ED, Petkov PM, Paigen K. Prdm9 controls activation of mammalian recombination hotspots. Science. 2010;327:835
12. Zhang B, Liu G. Predicting recombination hotspots in yeast based on DNA sequence and chromatin structure. Curr Bioinfor. 2014;9:28-33
13. Jiang P, Wu H, Wei J. et al. RF-DYMHC: detecting the yeast meiotic recombination hotspots and coldspots by random forest model using gapped dinucleotide composition features. Nucleic Acids Res. 2007;35:W47-51
14. Zhou T, Weng J, Sun X. et al. Support vector machine for classification of meiotic recombination hotspots and coldspots in Saccharomyces cerevisiae based on codon composition. BMC Bioinfor. 2006;7:223
15. Liu G, Liu J, Cui X. et al. Sequence-dependent prediction of recombination hotspots in Saccharomyces cerevisiae. J Theor Biol. 2012;293:49-54
16. Chen W, Feng PM, Lin H. et al. iRSpot-PseDNC: identify recombination spots with pseudo dinucleotide composition. Nucleic Acids Res. 2013;41:e68
17. Li L, Yu S, Xiao W. et al. Sequence-based identification of recombination spots using pseudo nucleic acid representation and recursive feature extraction by linear kernel SVM. BMC Bioinfor. 2014;15:340
18. Qiu WR, Xiao X, Chou KC. iRSpot-TNCPseAAC: identify recombination spots with trinucleotide composition and pseudo amino acid components. Int J Mol Sci. 2014;15:1746-66
19. Liu G, Xing Y, Cai L. Using weighted features to predict recombination hotspots in Saccharomyces cerevisiae. J Theor Biol. 2015;382:15-22
20. Liu B, Liu Y, Jin X. et al. iRSpot-DACC: a computational predictor for recombination hot/cold spots identification based on dinucleotide-based auto-cross covariance. Sci Rep. 2016;6:33483
21. Dong C, Yuan YZ, Zhang FZ. et al. Combining pseudo dinucleotide composition with the Z curve method to improve the accuracy of predicting DNA elements: a case study in recombination spots. Mol Biosyst. 2016;12:2893-900
22. Liu B, Wang S, Long R. et al. iRSpot-EL: identify recombination spots with an ensemble learning approach. Bioinformatics. 2017;33:35-41
23. Chou KC. Prediction of signal peptides using scaled window. Peptides. 2001;22:1973-9
24. Lin H, Deng EZ, Ding H. et al. iPro54-PseKNC: a sequence-based predictor for identifying sigma-54 promoters in prokaryote with pseudo k-tuple nucleotide composition. Nucleic Acids Res. 2014;42:12961-72
25. Chou KC. Some remarks on protein attribute prediction and pseudo amino acid composition. J Theor Biol. 2011;273:236-47
26. Meher PK, Sahu TK, Saini V. et al. Predicting antimicrobial peptides with improved accuracy by incorporating the compositional, physico-chemical and structural features into Chou's general PseAAC. Sci Rep. 2017;7:42362
27. Tripathi P, Pandey PN. A novel alignment-free method to classify protein folding types by combining spectral graph clustering with Chou's pseudo amino acid composition. J Theor Biol. 2017;424:49-54
28. Cheng X, Zhao SC, Lin WZ. et al. pLoc-mAnimal: predict subcellular localization of animal proteins with both single and multiple sites. Bioinformatics. 2017;33:3524-31
29. Chen W, Feng P, Yang H. et al. iRNA-AI: identifying the adenosine to inosine editing sites in RNA sequences. Oncotarget. 2017;8:4208-17
30. Lai HY, Chen XX, Chen W. et al. Sequence-based predictive modeling to identify cancerlectins. Oncotarget. 2017;8:28169-75
31. Qiu WR, Sun BQ, Xiao X. et al. iKcr-PseEns: Identify lysine crotonylation sites in histone proteins with pseudo components and ensemble classifier. Genomics. 2017:10 1016/j.ygeno.201710.008
32. Dao FY, Yang H, Su ZD. et al. Recent advances in conotoxin classification by using machine learning methods. Molecules. 2017;22:1057
33. Feng P, Yang H, Ding H. et al. iDNA6mA-PseKNC: Identifying DNA N6-methyladenosine sites by incorporating nucleotide physicochemical properties into PseKNC. Genomics. 2018 doi:10.1016/j.ygeno.2018.01.005
34. Zhao YW, Lai HY, Tang H. et al. Prediction of phosphothreonine sites in human proteins by fusing different features. Sci Rep. 2016;6:34817
35. Yang H, Tang H, Chen XX. et al. Identification of secretory proteins in mycobacterium tuberculosis using pseudo amino acid composition. BioMed Res Int. 2016;2016:5413903
36. Chou KC. Impacts of bioinformatics to medicinal chemistry. Med Chem. 2015;11:218-34
37. Chou kC. Prediction of protein cellular attributes using pseudo amino acid composition. Proteins. 2011;43:246-55
38. Zhong WZ, Zhou SF. Molecular science for drug development and biomedicine. Int J Mol Sci. 2014;15:20072-8
39. Zhou GP, Zhong WZ. Perspectives in Medicinal Chemistry. Curr Top Med Chem. 2016;16:381-2
40. Esmaeili M, Mohabatkar H, Mohsenzadeh S. Using the concept of Chou's pseudo amino acid composition for risk type prediction of human papillomaviruses. J Theor Biol. 2010;263:203-209
41. Mohammad Beigi M, Behjati M, Mohabatkar H. Prediction of metalloproteinase family based on the concept of Chou's pseudo amino acid composition using a machine learning approach. J Struct Funct Genomics. 2011;12:191-7
42. Tang H, Su ZD, Wei HH. et al. Prediction of cell-penetrating peptides with feature selection techniques. Biochem Biophys Res Commun. 2016;477:150-4
43. Pacharawongsakda E, Theeramunkong T. Predict Subcellular Locations of Singleplex and Multiplex Proteins by Semi-Supervised Learning and Dimension-Reducing General Mode of Chou's PseAAC. IEEE Trans Nanobioscience. 2013;12:311-20
44. Nanni L, Brahnam S, Lumini A. Prediction of protein structure classes by incorporating different protein descriptors into general Chou's pseudo amino acid composition. J Theor Biol. 2014;360:109-16
45. Sharma R, Dehzangi A, Lyons J. et al. Predict Gram-Positive and Gram-Negative Subcellular Localization via Incorporating Evolutionary Information and Physicochemical Features Into Chou's General PseAAC. IEEE Trans Nanobioscience. 2015;14:915-26
46. Ding H, Liu L, Guo FB. et al. Identify Golgi protein types with modified Mahalanobis discriminant algorithm and pseudo amino acid composition. Protein Pept Lett. 2011;18:58-63
47. Yu B, Li S, Qiu WY. et al. Accurate prediction of subcellular location of apoptosis proteins combining Chou's PseAAC and PsePSSM based on wavelet denoising. Oncotarget. 2017;8:107640-65
48. Zhang S, Duan X. Prediction of protein subcellular localization with oversampling approach and Chou's general PseAAC. J Theor Biol. 2018;437:239-50
49. Chou KC. An unprecedented revolution in medicinal chemistry driven by the progress of biological science. Curr Top Med Chem. 2017;17:2337-58
50. Liu B, Yang F, Chou KC. 2L-piRNA: A two-layer ensemble classifier for identifying piwi-interacting RNAs and their function. Mol Ther - Nucleic Acids. 2017;7:267-77
51. Chen W, Lei TY, Jin DC. et al. PseKNC: a flexible web-server for generating pseudo K-tuple nucleotide composition. Anal Biochem. 2014;456:53-60
52. Chen W, Zhang X, Brooker J. et al. PseKNC-General: a cross-platform package for generating various modes of pseudo nucleotide compositions. Bioinformatics. 2015;31:119-20
53. Chen W, Lin H, Chou KC. Pseudo nucleotide composition or PseKNC: an effective formulation for analyzing genomic sequences. Mol BioSyst. 2015;11:2620-34
54. Ghandi M, Mohammad-Noori M, Beer MA. Robust k-mer frequency estimation using gapped k-mers. J Math Biol. 2014;69:469-500
55. Hua ZG, Lin Y, Yuan YZ. et al. ZCURVE 3.0: identify prokaryotic genes with higher accuracy as well as automatically and accurately select essential genes. Nucleic Acids Res. 2015;43:W85-90
56. Li WC, Deng EZ, Ding H. et al. iORI-PseKNC: a predictor for identifying origin of replication with pseudo k-tuple nucleotide composition. Chemom Intell Lab Syst. 2015;141:100-6
57. Lin H, Liang ZY, Tang H. et al. Identifying sigma70 promoters with novel pseudo nucleotide composition. IEEE/ACM Trans Comput Biol Bioinform. 2017 doi: 10.1109/TCBB.2017.2666141
58. Guo SH, Deng EZ, Xu LQ. et al. iNuc-PseKNC: a sequence-based predictor for predicting nucleosome positioning in genomes with pseudo k-tuple nucleotide composition. Bioinformatics. 2014;30:1522-9
59. Li WC, Zhong ZJ, Zhu PP. et al. Sequence analysis of origins of replication in the Saccharomyces cerevisiae genomes. Front Microbiol. 2014;5:574
60. Hsieh LC, Luo L, Ji F. et al. Minimal model for genome evolution and growth. Phys Rev Lett. 2003;90:018101
61. Lin H, Li QZ. Eukaryotic and prokaryotic promoter prediction using hybrid approach. Theory Biosci. 2011;130:91-100
62. Feng PM, Chen W, Lin H. et al. iHSP-PseRAAAC: Identifying the heat shock protein families using pseudo reduced amino acid alphabet composition. Anal Biochem. 2013;442:118-25
63. Ding C, Yuan LF, Guo SH. et al. Identification of mycobacterial membrane proteins and their types using over-represented tripeptide compositions. J Proteomics. 2012;77:321-28
64. Lin H, Ding H, Guo FB. et al. Prediction of subcellular location of mycobacterial protein using feature selection techniques. Mol Divers. 2010;14:667-71
65. Wu Y, Tang H, Chen W. et al. Predicting human enzyme family classes by using pseudo amino acid composition. Curr Proteomics. 2016;13:99-104
66. Ma J, Gu H. A novel method for predicting protein subcellular localization based on pseudo amino acid composition. BMB Rep. 2010;43:670-6
67. Olivier I, Loots du T. A metabolomics approach to characterise and identify various Mycobacterium species. J Microbiol Methods. 2012;88:419-26
68. Du QS, Wang SQ, Xie NZ. et al. 2L-PCA: A two-level principal component analyzer for quantitative drug design and its applications. Oncotarget. 2017;8:70564-78
69. Lin H, Ding H. Predicting ion channels and their types by the dipeptide mode of pseudo amino acid composition. J Theor Biol. 2011;269:64-9
70. Tang H, Chen W, Lin H. Identification of immunoglobulins using Chou's pseudo amino acid composition with feature selection technique. Mol BioSyst. 2016;12:1269-75
71. Zhang X, Lu X, Shi Q. et al. Recursive SVM feature selection and sample classification for mass-spectrometry and microarray data. BMC Bioinformatics. 2006;7:197
72. Qureshi MN, Min B, Jo HJ. et al. Multiclass Classification for the Differential Diagnosis on the ADHD Subtypes Using Recursive Feature Elimination and Hierarchical Extreme Learning Machine: Structural MRI Study. PLoS One. 2016;11:e0160697
73. Wang T, Xia T, Hu XM. Geometry preserving projections algorithm for predicting membrane protein types. J Theor Biol. 2010;262:208-13
74. Vapnik VN. An overview of statistical learning theory. IEEE Trans Neural Netw. 1999;10:988-99
75. Chou KC, Cai YD. Using functional domain composition and support vector machines for prediction of protein subcellular location. J Biol Chem. 2002;277:45765-9
76. Qiu WR, Sun BQ, Tang H. et al. Identify and analysis crotonylation sites in histone by using support vector machines. Artif Intell Med. 2017;83:75-81
77. Cristianini N, Shawe-Taylor J. An Introduction to Support Vector Machines and Other Kernel-based Learning Methods. Cambridge University Press. 2000 Chapter 3
78. Chang CC, Lin CJ, Training nu-support vector classifiers. theory and algorithms. Neural Comput. 2001;13:2119-47
79. Chen J, Liu H, Yang J. Prediction of linear B-cell epitopes using amino acid pair antigenicity scale. Amino Acids. 2007;33:423-8
80. Xu Y, Ding J, Wu LY. et al. iSNO-PseAAC: Predict cysteine S-nitrosylation sites in proteins by incorporating position specific amino acid propensity into pseudo amino acid composition. PLoS ONE. 2013;8:e55844
81. Xu Y, Shao XJ, Wu LY. et al. iSNO-AAPair: incorporating amino acid pairwise coupling into PseAAC for predicting cysteine S-nitrosylation sites in proteins. PeerJ. 2013;1:e171
82. Chen E, Feng PM, Deng EZ. et al. iTIS-PseTNC: a sequence-based predictor for identifying translation initiation site in human genes using pseudo trinucleotide composition. Anal Biochem. 2014;462:76-83
83. Ding H, Li D. Identification of mitochondrial proteins of malaria parasite using analysis of variance. Amino Acids. 2015;47:329-33
84. Tang H, Zou P, Zhang C. et al. Identification of apolipoprotein using feature selection technique. Sci Rep. 2016;6:30441
85. Ding H, Deng EZ, Yuan LF. et al. iCTX-Type: A sequence-based predictor for identifying the types of conotoxins in targeting ion channels. BioMed Res Int. 2014;2014:286419
86. Chen W, Feng PM, Lin H. et al. iSS-PseDNC: identifying splicing sites using pseudo dinucleotide composition. BioMed Res Int. 2014;2014:623149
87. Xu Y, Li C. Chou KC. iPreny-PseAAC: identify C-terminal cysteine prenylation sites in proteins by incorporating two tiers of sequence couplings into PseAAC. Med Chem. 2017;13:544-51
88. Feng PM, Lin H, Chen W. Identification of antioxidants from sequence information using Naive Bayes. Comput Math Method Med. 2013;2013:567529
89. Feng P, Ding H, Yang H. et al. iRNA-PseColl: Identifying the occurrence sites of different RNA modifications by incorporating collective effects of nucleotides into PseKNC. Mol Ther - Nucleic Acids. 2017;7:155-63
90. Feng PM, Ding H, Chen W. et al. Naive Bayes classifier with feature selection to identify phage virion proteins. Comput Math Method Med. 2013;2013:530696
91. Chou KC, Zhang CT. Prediction of protein structural classes. Crit Rev Biochem Mol Biol. 1995;30:275-349
92. Rahimi M, Bakhtiarizadeh MR, Mohammadi-Sangcheshmeh A. OOgenesis_Pred: A sequence-based method for predicting oogenesis proteins by six different modes of Chou's pseudo amino acid composition. J Theor Biol. 2017;414:128-36
93. Khan M, Hayat M, Khan SA. et al. Unb-DPC: Identify mycobacterial membrane protein types by incorporating un-biased dipeptide composition into Chou's general PseAAC. J Theor Biol. 2017;415:13-9
94. Tahir M, Hayat M, Kabir M. Sequence based predictor for discrimination of enhancer and their types by applying general form of Chou's trinucleotide composition. Comput Methods Programs Biomed. 2017;146:69-75
95. Guo FB, Dong C, Hua HL. et al. Accurate prediction of human essential genes using only nucleotide composition and association information. Bioinformatics. 2017;33:1758-64
96. Fawcett JA. An Introduction to ROC Analysis. Pattern Recognit Lett. 2005;27:861-74
97. Ding H, Feng PM, Chen W. et al. Identification of bacteriophage virion proteins by the ANOVA feature selection and analysis. Mol Biosyst. 2014;10:2229-35
98. Chen W, Feng P, Tang H. et al. Identifying 2'-O-methylationation sites by integrating nucleotide chemical properties and nucleotide compositions. Genomics. 2016;107:255-258
99. Xiao X, Wang P, Lin WZ. et al. iAMP-2L: A two-level multi-label classifier for identifying antimicrobial peptides and their functional types. Anal Biochem. 2013;436:168-77
100. Chen W, Yang H, Feng PM. et al. iDNA4mC: identifying DNA N4-methylcytosine sites based on nucleotide chemical properties. Bioinformatics. 2017;33:3518-23
101. Lin H, Ding C, Yuan LF. et al. Predicting subchloroplast locations of proteins based on the general form of Chou's pseudo amino acid composition: approached from optimal tripeptide composition. Int J Biomath. 2013;6:1350003
102. Jia J, Zhang L, Liu Z. et al. pSumo-CD: Predicting sumoylation sites in proteins with covariance discriminant algorithm by incorporating sequence-coupled effects into general PseAAC. Bioinformatics. 2016;32:3133-41
103. Chen W, Feng P, Tang H. et al. RAMPred: identifying the N-1-methyladenosine sites in eukaryotic transcriptomes. Sci Rep. 2016;6:31080
104. Chen W, Tang H, Lin H. MethyRNA: a web server for identification of N6-methyladenosine sites. J Biomol Struct Dyn. 2017;35:683-7
105. Cheng X, Xiao X, Chou KC. pLoc-mGneg: Predict subcellular localization of Gram-negative bacterial proteins by deep gene ontology learning via general PseAAC. Genomics. 2017 doi:10.1016/j.ygeno.2017.10.002
106. Lin H, Liu WX, He J. et al. Predicting cancerlectins by the optimal g-gap dipeptides. Sci Rep. 2015;5:16964
107. Zhu PP, Li WC, Zhong ZJ. et al. Predicting the subcellular localization of mycobacterial proteins by incorporating the optimal tripeptides into the general form of pseudo amino acid composition. Mol Biosyst. 2015;11:558-63
108. Chen XX, Tang H, Li WC. et al. Identification of Bacterial Cell Wall Lyases via Pseudo Amino Acid Composition. BioMed Res Int. 2016;2016:1654623
109. Zhao YW, Su ZD, Yang W. et al. IonchanPred 2.0: a tool to predict ion channels and their types. Int J Mol Sci. 2017;18:1838
110. Cao R, Freitas C, Chan L. et al. ProLanGO: Protein Function Prediction Using Neural Machine Translation Based on a Recurrent Neural Network. Molecules. 2017;22:1732
111. Liang ZY, Lai HY, Yang H. et al. Pro54DB: a database for experimentally verified sigma-54 promoters. Bioinformatics. 2017;33:467-9
112. Cao R, Adhikari B, Bhattacharya D. et al. QAcon: single model quality assessment using protein structural and contact information with machine learning techniques. Bioinformatics. 2017;33:586-8
113. Zhang T, Tan P, Wang L. et al. RNALocate: a resource for RNA Subcellular Localizations. Nucleic Acids Res. 2017;45:D135-8
114. Cao R, Bhattacharya D, Hou J. et al. DeepQA: improving the estimation of single protein model quality with deep belief networks. BMC Bioinformatics. 2016;17:495
115. Li N, Kang J, Jiang L. et al. PSBinder: A Web Service for Predicting Polystyrene Surface-Binding Peptides. BioMed Res Int. 2017;2017:5761517
116. He B, Chai G, Duan Y. et al. BDB: biopanning data bank. Nucleic Acids Res. 2016;44:D1127-32
Author contact
![]() Corresponding author: Wei Chen: chenweiimucom; Kuo-Chen Chou: kcchouorg; Hao Lin: hlinedu.cn
Corresponding author: Wei Chen: chenweiimucom; Kuo-Chen Chou: kcchouorg; Hao Lin: hlinedu.cn