Impact Factor ISSN: 1449-2288
- Issue 12; 2026
- Issue 11; 2026
- Issue 10; 2026
- Issue 9; 2026
- Issue 8; 2026
- Volume 22; 2026
- Past Issues
- Advance Articles
- Editorial Board
- Cover Images
- Index & Coverage
- Cover Suggestion
- Special Issues
Introduction
Material and Methods
Results
Discussion
Abbreviations
Supplementary Material
Acknowledgements
References

 Global reach, higher impact
Int J Biol Sci 2021; 17(5):1263-1276. doi:10.7150/ijbs.56357 This issue Cite
Research Paper
Targeting HLA-F suppresses the proliferation of glioma cells via a reduction in hexokinase 2-dependent glycolysis
Xin Chen1,2*, Na Sun1,2*, Rongqin Li1,2*, Xuejia Sang3, Xueqin Li1,2, Jie Zhao1,2, Jing Han1,2, Jing Yang1,2 ![]() , Takayuki Ikezoe4
, Takayuki Ikezoe4
1. Jiangsu Province Key Laboratory of Immunity and Metabolism, Xuzhou Medical University, Xuzhou, China.
2. Department of Pathogenic Biology and Immunology, Xuzhou Medical University, Xuzhou, China.
3. China University of Mining and Technology, Xuzhou, China.
4. The Department of Hematology, Fukushima Medical University, Fukushima, Japan.
*These authors contributed equally to this work.
Received 2020-11-26; Accepted 2021-3-15; Published 2021-3-25
Abstract

HLA-F, a nonclassical HLA class I molecule, is required for regulating immune tolerance. In recent years, HLA-F has been found to play a role in a variety of cancers, including glioma (GM). Additionally, high expression of HLA-F predicts the poor overall survival of individuals with GM. However, the functions of HLA-F in GM remain to be further elucidated. In this study, we found that HLA-F expression was elevated in GM tissues. High levels of HLA-F resulted in a high cell proliferation index and predicted GM recurrence. Forced expression of HLA-F promoted the growth of murine C8-D1A cells transplanted in immunodeficient Rag2-/- mice. In contrast, silencing HLA-F inhibited cell growth in vitro. Furthermore, targeting HLA-F with an anti-HLA-F antibody suppressed the growth of C8-D1A cells stably expressing HLA-F transplanted in immunodeficient Rag2-/- mice. In further experiments, we found that forced expression of HLA-F contributed to the aerobic glycolysis phenotype in C8-D1A cells along with an increase in HK2 protein stabilization. Conversely, silencing HK2 by shRNA reduced HLA-F-mediated glycolysis and cell proliferation. Our data indicated that HLA-F promoted cell proliferation via HK2-dependent glycolysis. HLA-F could be a potential therapeutic target for the treatment of GM.
Keywords: HLA-F, glycolysis, hexokinase 2, glioma
Introduction
The prognosis of individuals with GM, especially glioblastoma (GBM), is generally poor. It has been reported that the median survival time is approximately 14 months, and only 3-5% of patients can survive up to 5 years after diagnosis [1, 2]. Hotspot mutations in tumor suppressors and proteins involved in regulating cell signaling and growth have been found in GM. Additionally, recent studies have demonstrated that higher levels of PD-L1 [3], CD95 ligand (CD95L), and TGF-β [4, 5] were observed in GM patients, which suppresses immune responses and helps GM cells escape immune surveillance.
Alterations in HLA class I (HLA-I) expression have been found in a variety of malignancies. Additionally, these alterations could have a decisive influence on the tumor immune response and metastatic ability [6, 7]. HLA-F, a nonclassical HLA class I molecule (HLA-Ib), is structurally related to HLA-Ia molecules. However, in contrast to HLA-Ia molecules, HLA-F has a limited tissue distribution and is generally considered a tolerogenic molecule [8, 9]. HLA-F physically interacts with killer cell immunoglobulin-like receptors (KIRs), including KIR3DL2, KIR2DS4, and KIR3DS1 [10], and is involved in regulating human pregnancy, infection, and autoimmunity [8, 11, 12]. Moreover, recent studies have demonstrated that HLA-F is constitutively expressed in various cancers, including non-small cell lung cancer, gastric cancer, and GM [9, 13, 14]. Notably, HLA-F expression is negatively associated with overall survival [9, 13], indicating that HLA-F might play a role in tumorigenesis or tumor progression.
In addition to the induction of immunosuppression, GM progression is associated with metabolic remodeling, resulting in aerobic glycolysis as the primary source of energy and biosynthetic precursors for proliferation [15]. The glycolytic enzymes hexokinases (HKs), including HK1, HK2, HK3 and HK4, catalyze the first committed step in glucose metabolism and influence the magnitude and direction of glucose flux within cells [16, 17]. HK1 is predominantly expressed in most mammalian adult tissues, including the normal brain. HK2 is abundantly expressed in skeletal, adipose tissues and cardiac muscles but not in the normal brain [18]. Recent studies have demonstrated that HK2 is constitutively expressed in GBMs and plays a vital role in proliferation and cell survival [19, 20]. HK2 suppresses apoptosis through translocation to the outer mitochondrial membrane and interaction with the permeability transition pore [21-23]. Several transcription and growth factors have been indicated to modulate the expression and activity of HK2 [24, 25]. A recent study found that B1.23.2, an HLA-B, C-specific monoclonal antibody, decreased the levels of key glycolytic enzymes, glutamine transporters and glutaminase enzymes, reducing energy production and melanoma cell motility [26]. Nevertheless, whether HLA-F influences HK2 expression or activity remains unclear.
This study identified a crucial role for HLA-F in regulating the proliferation of GM cells via HK2-dependent glycolysis.
Material and Methods
Cells
The murine astrocyte cell line C8-D1A was commercially obtained from Fuheng (FH0837, FuHeng Cell Center, Shanghai, China). Human GM U373, HS683 and U138MG cell lines were commercially obtained from ATCC. SHG44, U251, T98G, TJ905 and A172 cells were commercially obtained from Bolida (Bolida, Xuzhou, Jiangsu, China). The cells were cultured in DMEM containing 10% heat-inactivated FBS (FB25015, Clark, Virginia, USA), 100 mg/L streptomycin and 100 U/mL penicillin at 37 °C in a 5% CO2 environment. All human GM cell lines have been authenticated using STR profiling within the last three years. In addition, all experiments were performed with mycoplasma-free cells.
Plasmids, shRNA and Transfection
Myc-tagged human HK2 cDNA was synthesized and cloned into the pcDNA3.1 (+) vector at the NheI/HindIII sites. shRNAs targeting human HLA-F or murine HK2 were purchased from GeneChem (GeneChem, Shanghai, China) or Jima (Jima., Shanghai, China), respectively. Cells were transfected with either control shRNA or the indicated shRNA utilizing jetPRIME transfection reagent (Polyplus, France) according to the manufacturer's instructions. After 24 h, the cells were harvested and used for further experiments. Puromycin (2 mg/mL, VICMED, Xuzhou, Jiangsu, China) was added to the culture medium to select the transfected cells. The shRNA sequences were as follows: shHLA-F #1: CGCAGTATTGGGAGTGGACCACTCGAGTGGTCCACTCCCAATACTGCGTTTTTG, shHLA-F #2: CCGGAGAGGAATATGCAGAGGAGTTCTCGAGAACTCCTCTGCATATTCCTCTTTTTTG; shHK2 #1: GATCCGCGTAGATGCATAACAAGATTCAAGAGATCTTGTTATGCATCTCTACGCTTTTTTG, shHK2 #2: GATCCGGAGATGCGTAATGTGGAACTTTCAAGAGAAGTTCCACATTACGCATCTCCTTTTTG, and shHK2 #3: GATCCGCATATGATCGCCTGCTTATTTCAAGAGAATAAGCAGGCGATCATATGCTTTTTG.
Lentivirus and infection
HLA-F lentivirus was obtained from GeneChem (GeneChem.). Cells were infected with the indicated lentivirus according to the manufacturer's instructions. After 24 h, 1 mL culture medium was added to the wells. 24h later, the infected cells were cultured in DMEM culture medium containing 10% FBS and 2 mg/mL puromycin.
Colony formation assay
The colony formation assay was performed as previously described [27]. Briefly, 200 infected cells were cultured in six-well plates at 37 °C for 7-10 days. Visible colonies were washed twice with PBS, fixed with 4% paraformaldehyde, and stained with crystal violet. Images of the colonies were taken, and the number of colonies was counted by ImageJ software.
Generation of anti-HLA-F antibody
Commercial anti-HLA-F antibodies are mainly used to detect proteins but cannot be used as blocking antibodies. We generated a patented monoclonal antibody (mAb) to solve this issue. Briefly, an HLA-F cDNA expression vector, pCzn1(+)-HLA-F, was constructed by inserting the fragment carrying the human HLA-F cDNA between the NdeI and XbaI sites of the pCzn1(+) expression vector (Zoonbio, Nanjing, China). The pCzn1-HLA-F expression vector was transformed into ArcticExpress competent cells and incubated with isopropyl-1-thio-β-D-galactopyranoside (IPTG) (final concentration was 0.5 mM) at 37 °C for 4 h with shaking. Then, the fusion protein was purified by Ni-iminodiacetic acid (IDA) affinity chromatography. The purified protein was confirmed by CBB staining and Western blot analysis (data not shown).
Six- to eight-week-old female BALB/c mice were immunized with 50 μg purified HLA-F protein emulsified in the same volume of complete Freund's adjuvant by intraperitoneal injection [28]. Three additional injections were administered to the mice at 2-week intervals with the same dose of antigen emulsified in incomplete Freund's adjuvant [28]. At the end of the experiments, immunized mice were sacrificed, and single spleen cells were fused with SP2/0 myeloma cells utilizing polyethylene glycol 1450 (PEG1450, Sigma-Aldrich, USA) [28, 29]. After which, the hybridoma cells were seeded into 96-well plates and followed by selection in hypoxanthine-aminopterin-thymidine (HAT) medium and hypoxanthine-thymidine (HT) medium. The cell culture of surviving clones were assayed by indirect ELISA for antibody reactivity and specificity [28]. One hybridoma was subsequently cloned by repeated limiting dilution until a stable clone was obtained [29]. Ascitic fluids were produced in pristane-induced BALB/c mice [28].
Indirect enzyme-linked immunosorbent assay (ELISA)
Indirect ELISA was used to determine the immune reactivity of HLA-F and to screen positive hybridoma cells as described previously [28]. Briefly, ELISA plates were plated with purified HLA-F protein in PBS (pH 7.4), coated at 4 °C overnight and. After which, the plates were incubated with 100 μL diluted antibodies at 37 °C for 1 h, and followed by incubation with horseradish peroxidase (HRP)-conjugated goat anti-mouse IgG (Proteintech Group, China) at a 1:5000 dilution in PBST at 37 °C for 1 h. After washing, 50 μL/well of TMB substrate (Amresco, Solon, Ohio, USA) was added into the wells, and the plates were incubated for 15 min at room temperature in the dark. OD450 values were obtained after stopping the reaction with 1 M HCl (100 μL/well).
Ectopic tumor implantation and weight measurements
The mouse strains were maintained and housed under specific pathogen-free (SPF) conditions. Six-week-old female Rag2-/- mice (Shanghai Model Organisms Center Inc., Shanghai, China) were utilized for ectopic implantation. The mice's left and right flanks were shaved, and 1×10⁶ C8-D1A cells were injected subcutaneously (s.c.). For monoclonal antibody experiments, when a palpable mass formed, the mice were divided into two groups and treated with either the same volume of control diluent or 100 μg/mass anti-HLA-F mAb by intratumor injection. The palpable mass size was monitored every other day. The detectable mass size was measured three times a week using calipers. The palpable mass sizes were calculated using the formula a×b×c, where “a” is the length, “b” is the width, and “c” is the height in millimeters. 14 days later, the animals were euthanized, and the masses were isolated to determine the weight following careful dissection.
3-(4,5-Dimethylthiazol-2-yl)-2,5-diphenyltetrazolium bromide assays
The proliferation of cells was assessed by 3‐(4,5‐dimethylthiazol‐2‐yl)‐2,5‐diphenyltetrazolium bromide (MTT) assay. Briefly, cells were transfected with either control shRNA or shRNA against HLA-F. After 24 h, cell viability was measured by the MTT assay.
RNA isolation and real-time reverse transcription-polymerase chain reaction (RT-PCR)
We measured the expression of 18S or Actb for normalization as previously described [27]. Real-time RT-PCR was performed using TB Green PCR Master Mix (TaKaRa, Japan). The primer sets for PCR are shown in Table 1. The PCR conditions for all the genes were as follows: initial activation at 95 °C for 30 s, followed by 40 cycles at 95 °C for 5 s, 60 °C for 20 s, and fluorescence determination at the melting temperature of the product for 15 s on a LightCycler 480 (Roche).
Real time RT-PCR primers
| Gene | Direction | Primer |
|---|---|---|
| Hk2 | Forward | 5'-AGAAATGGAGCGAGGTCTGA-3' |
| Reverse | 5'-TTGTTCCTCCAAGGTCCAAG-3' | |
| Hlaf | Forward | 5'-AATGGGAAGGAGACGCTACA-3' |
| Reverse | 5'-CACAGCTCCAAGGACAACAA-3' | |
| 18S | Forward | 5'-AAACGGCTACCACATCCAAG-3' |
| Reverse | 5'-CCTCCAATGGATCCTCGTTA-3' | |
| Actb | Forward | 5'-GCTACAGCTTCACCACCACA-3' |
| Reverse | 5'-TCTCCAGGGAGGAAGAGGAT-3' | |
| mHk2 | Forward | 5'-GAAGATGATCAGCGGGATGT-3' |
| Reverse | 5'-GCCAGTGGTAAGGAGCTCTG-3' |
Determination of mRNA half-life
To measure the half-life of endogenous Hk2 mRNA, cells were cultured in the presence of either control diluent or actinomycin D at a final concentration of 2 µg/mL at the indicated time points, the total RNA was extracted and subjected to real-time RT-PCR. mRNA levels were normalized to 18S levels and plotted as a percentage of the value at time 0 (set at 100%).
Immunoblotting
Immunoblotting was performed as described previously [30, 31]. Anti-HLA-F (14670-1-AP), -HK1 (19662-1-AP), -HK2 (22029-1-AP), -PKM1 (15821-1-AP), -PFKM (55028-1-AP), -Myc (16286-1-AP), and -β-actin (66009-1-Ig) antibodies were purchased from Proteintech.
Immunoprecipitation
293T cells were cotransfected with the indicated plasmid DNA. After 24 h, lysates were prepared in immunoprecipitation lysis buffer (20 mmol/L Tris-Cl, pH 8.0, 10 mmol/L NaCl, 1 mmol/L EDTA, 0.1% NP-40) containing a protease inhibitor cocktail (Sigma-Aldrich). One microgram of cell extract was precleared with 50 µL of protein A/G-agarose (Thermo Fisher) at 4 °C for 15 min. After centrifugation, the supernatant was harvested and incubated with the corresponding antibodies with gentle shaking at 4 °C for overnight, followed by the addition of 20 µL of protein A/G-agarose for another 1 h. The beads were washed, resuspended in 30 µL of 1×loading buffer and boiled for 3 min, followed by Western blot detection.
Protein half-life assay
Cells were treated with cycloheximide (CHX, final concentration: 100 μg/mL) and harvested using sodium dodecyl sulfate (SDS) lysis buffer at the indicated time points. The levels of HK2 and β-actin were analyzed by Western blotting. HK2 bands were quantified after normalization to β-actin, and the data were plotted as the relative amount of protein remaining compared to the treatment at time zero. Bands were compared quantitatively using ImageJ software.
Immunofluorescence staining and quantification
A tissue microarray of the GM cohort consisting of 180 cases (OUTDO IVD, Shanghai, China) was used in the study. Staining was performed with an antibody against HLA-F together with immunofluorescent markers (Opal, PerkinElmer) and digital images acquired by a multispectral imaging system (PerkinElmer). Quantification of positively stained cells was verified with manual counting.
Seahorse analyzer
The extracellular acidification rate (ECAR) was measured with an XF 24 extracellular flux analyzer (Seahorse Bioscience). Briefly, 5×10⁴ cells were seeded in each well of Seahorse XF 24 plates with 250 μL of DMEM and incubated overnight. ECAR measurements were normalized to the cell number. In ECAR tests, the cells were plated in XF Seahorse media with 2 mM glutamine using the following concentrations of injected compounds, as indicated in the text: 1 µM oligomycin, 500 mM 2-DG, and 100 mM glucose. For the oxygen consumption rate (OCR), the cells were plated in XF Seahorse media with 10 mM glucose, 2 mM glutamine, and 1 mM sodium pyruvate in the mitochondrial stress test using the following concentrations of injected compounds: 1 µM oligomycin, 1 µM Carbonyl cyanide 4-(trifluoromethoxy)phenylhydrazone (FCCP), and 100 nM rotenone + 0.5 µM antimycin A (Seahorse Bioscience), as indicated.
G6PDH activity
G6PDH activity was examined using G6PDH Activity Assay Kit with WST-8 (Beyotime, Shanghai, China) according to the manufacturer's instructions.
The expression of HLA-F and survival analysis using the GEPIA web tool
The online database Gene Expression Profiling Interactive Analysis (GEPIA2, http://gepia2.cancer-pku.cn/#index) was used to analyze the expression of HLA-F and the overall survival (OS) of individuals with various types of cancers.
TCGA data re‐analysis
The gene expression profiles and clinicopathological information of a large cohort of low-grade glioma (LGG) patients (509 cases) in The Cancer Genome Atlas (TCGA) were obtained from the Genomic Data Commons Data Portal (GDC) website (https://portal.gdc.cancer.gov/). Data collection and application were performed in accordance with TCGA publication guidelines and data access policy without the need for additional approval from the local ethics committee. The downloaded RNA expression data were scored by the ESTIMATE algorithm for stromal scores, and LGG cases were classified into high and low groups based on the median score. Data analysis was performed using the “limma” package (version 3.8) in R (version 3.6.0).
Statistical analysis
To compare two groups, Student's t-test was utilized. One-way ANOVA followed by multiple comparisons test was used to compare the differences between more than two groups. Kaplan-Meier univariate survival analysis was performed by classification as 'low' or 'high' based on the median densities of cells, and P values are reported using the log-rank (Mantel-Cox) test with HR and 95% CI as described in a previous study [32]. The association between HLA-F expression and patient clinicopathological parameters was evaluated by chi square (χ2) analysis. Both tests were performed using GraphPad Prism V5 (GraphPad Software).
Results
Constitutive expression of HLA-F predicted poor outcomes in GM patients
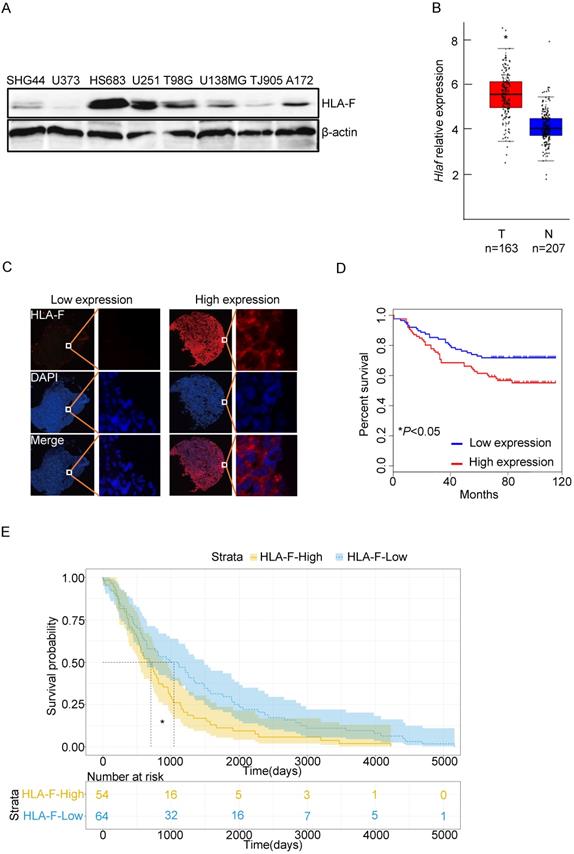
To determine the role of HLA-F in GM, we first examined the levels of HLA-F in a variety of GM cell lines, including HS683 and U251 cells, and found that HLA-F could be detected in GM cells (Figure 1A). We next explored whether HLA-F expression was increased in GM patients through the GEPIA web tool and found that Hla-f levels were significantly increased in individuals with GM (n = 163) compared with normal individuals (n = 207) (Figure 1B). Additionally, immunofluorescence staining revealed high expression of HLA-F in GM patients (Figure 1C). Consistent with a previous study [9], HLA-F expression was associated with GM patient survival (Figures 1D and 1E). Additionally, high expression of HLA-F could predict the progression and recurrence of GM (Table 2). As shown in the multivariate Cox regression analysis, the expression of HLA-F was an independent predictor of GM patient survival, together with age, stage and proliferating cell nuclear antigen (PCNA), an independent biomarker of overall survival [33] (Tables 3 and 4). In addition to GM, the constitutive expression of HLA-F was associated with the overall survival of individuals with acute myeloid leukemia (AML) and stomach adenocarcinoma (STAD, data not shown).
The expression of HLA-F was closely associated with the outcome of GM patients. (A) Western blot analysis. Proteins were extracted from the indicated GM cell lines and subjected to Western blot analysis. The membrane was sequentially probed with anti-HLA-F and anti-β-actin antibodies. The data represents one of two independent experiments with similar results. (B) The relative mRNA levels of Hlaf in GM tumor tissues (Red box, n = 163) and normal tissues (blue box, n = 207) were assessed using the GEPIA web tool. The relative expression level of Hlaf in each sample was shown as log2FPKM. *P < 0.05. (C) Immunofluorescence staining. Immunofluorescence for HLA-F (red) and DAPI (blue) in tumor sections (n = 180) was performed. The data shown represents a single experiment. (D) Kaplan-Meier plot indicating the overall survival of patients with GM categorized by HLA-F expression. The P value was determined by the log-rank test. *P < 0.05. (E) High HLA-F expression level was a risk factor for glioma patient survival, as determined by TCGA database analysis. *P < 0.05.
Relationship between the level of HLA-F and clinicopathological features of GM patients
| Variables | HLA-F (n = 180 cases) | ||||
|---|---|---|---|---|---|
| Total | High (%) | Low (%) | N/A | P | |
| All patients | 180 | 89 (100) | 90 (100) | 1 (100) | |
| Sex | 0.205 | ||||
| male | 112 | 50 | 61 | 1 | |
| female | 68 | 39 | 29 | 0 | |
| Age (years) | 0.523 | ||||
| <60 | 151 | 72 | 78 | 1 | |
| ≥60 | 29 | 17 | 12 | 0 | |
| Stage | <0.001 | ||||
| I+II | 105 | 39 | 65 | 0 | |
| III+IV | 75 | 50 | 25 | 0 | |
| Recurrence | <0.001 | ||||
| yes | 96 | 62 | 34 | 0 | |
| no | 84 | 27 | 56 | 0 | |
| PCNA | 0.031 | ||||
| N/A | 85 | 40 | 45 | 0 | |
| -/+ | 29 | 9 | 20 | 0 | |
| ++ | 60 | 34 | 25 | 1 | |
| +++ | 6 | 6 | 0 | 0 | |
| GFAP | 0.024 | ||||
| N/A | 14 | 6 | 8 | 0 | |
| -/+ | 74 | 36 | 38 | 0 | |
| ++ | 80 | 41 | 39 | 0 | |
| +++ | 12 | 6 | 5 | 1 | |
| S-100 | 0.074 | ||||
| N/A | 21 | 12 | 9 | 0 | |
| -/+ | 86 | 41 | 45 | 0 | |
| ++ | 56 | 30 | 26 | 0 | |
| +++ | 17 | 6 | 10 | 1 | |
| CK | 0.401 | ||||
| N/A | 111 | 50 | 60 | 1 | |
| -/+ | 59 | 31 | 28 | 0 | |
| ++ | 8 | 7 | 1 | 0 | |
| +++ | 2 | 1 | 1 | 0 | |
| Vimentin | 0.979 | ||||
| N/A | 122 | 60 | 61 | 1 | |
| -/+ | 29 | 16 | 13 | 0 | |
| ++ | 25 | 11 | 14 | 0 | |
| +++ | 4 | 2 | 2 | 0 | |
Univariate Cox regression analysis of HLA-F expression and clinicopathological variables predicting the 5-year survival of GM patients
| Variables | (n = 180 cases) | |
|---|---|---|
| HR (95% CI) | P | |
| Sex (male vs. female) | 0.669 (0.384-1.164) | 0.155 |
| Age (<60 years vs. ≥60 years) | 2.454 (1.382-4.359) | 0.002 |
| Stage (I+II vs. III+IV) | 14.812 (6.997-31.360) | <0.001 |
| PCNA | 0.691 (0.508-0.941) | 0.019 |
| S-100 | 0.790 (0.577-1.080) | 0.139 |
| CK | 0.845 (0.557-1.282) | 0.429 |
| Vimentin | 1.297 (0.990-1.699) | 0.059 |
| Recurrence (yes vs. no) | 0.011 (0.001-0.093) | <0.001 |
| HLA-F (high vs. low) | 1.752 (1.045-2.940) | 0.034 |
HR: hazard ratio; CI: confidence interval; P values are from log-rank test.
Univariate Cox regression analysis for recurrence-free survival of GM patients
| Variables | (n= 180 cases) | |
|---|---|---|
| HR (95% CI) | P | |
| Sex (male vs. female) | 0.736 (0.480-1.127) | 0.158 |
| Age (<60 years vs. ≥60 years) | 1.864 (1.165-2.985) | 0.009 |
| Stage (I+II vs. III+IV) | 6.871 (4.421-10.680) | <0.001 |
| PCNA | 0.658 (0.513-0.844) | 0.001 |
| S-100 | 0.730 (0.576-0.924) | 0.009 |
| CK | 0.973 (0.726-1.306) | 0.858 |
| Vimentin | 1.374 (1.118-1.687) | 0.002 |
| HLA-F (high vs. low) | 2.297 (1.518-3.475) | <0.001 |
HR: hazard ratio; CI: confidence interval; P values are from log-rank test.
HLA-F promoted cell proliferation
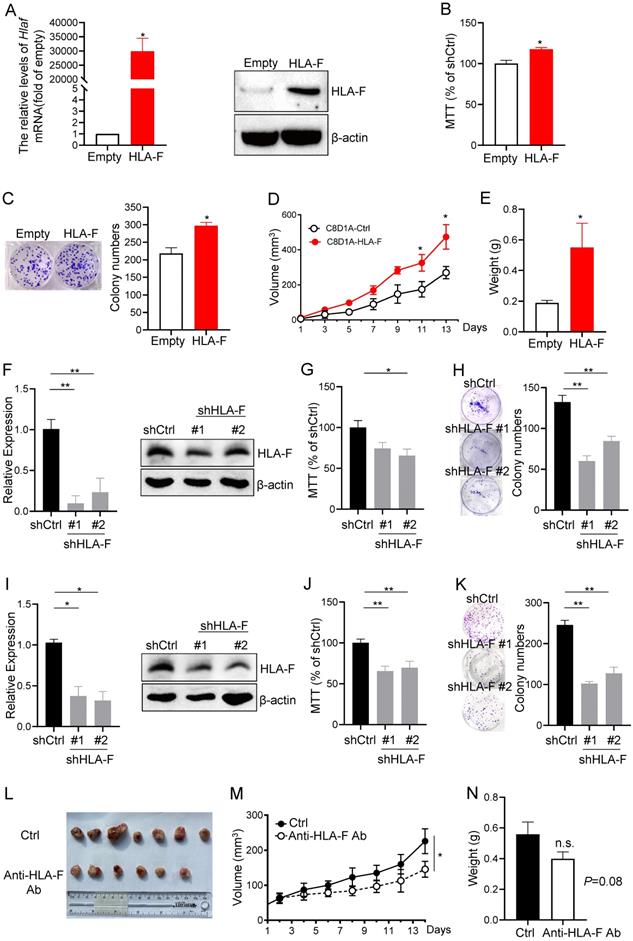
Given the above observations that aberrant expression of HLA-F may increase the proliferation index of GM cells, we overexpressed HLA-F in C8-D1A cells and performed MTT and colony formation assays. We revealed that the mRNA and protein levels of HLA-F were dramatically increased (Figure 2A). Interestingly, the viability and colony number of HLA-F-expressing C8-D1A cells were significantly elevated compared with those of empty vector-expressing C8-D1A cells (Figures 2B and 2C). Since HS683 and U251 cells highly expressing HLA-F barely formed tumors, to confirm whether HLA-F promotes cell proliferation in the mouse model, we transplanted HLA-F-expressing C8-D1A cells into Rag2-/- mice. As expected, HLA-F promoted C8-D1A cell growth in Rag2-/- mice (Figures 2D and 2E). To further validate the potential involvement of HLA-F in the proliferation of GM, we knocked down HLA-F and monitored the viability and colony formation of these cells. As shown in Figure 2F, shRNA against HLA-F decreased HLA-F expression in HS683 cells. As expected, silencing HLA-F significantly suppressed proliferation (Figures 2G and 2H). Similarly, knockdown of HLA-F also inhibited U251 cell growth (Figures 2I-2K). To further investigate whether HLA-F was involved in regulating proliferation in vivo, Rag2-/- mice transplanted with HLA-F-expressing C8-D1A cells were treated with either control diluent or anti-HLA-F antibody. The anti-HLA-F monoclonal antibody reduced the proliferation of HLA-F-expressing C8-D1A cells transplanted into Rag2-/- mice (Figures 2L-2N). These observations indicated that beyond its classic role in immunity, HLA-F could also be critical for controlling cell proliferation.
HLA-F was involved in regulating cell proliferation. (A) C8-D1A cells were infected with either empty lentivirus or HLA-F lentivirus and selected with puromycin for 14 days. Then, the relative expression of HLA-F mRNA (left) in C8-D1A cells infected with either empty lentivirus or HLA-F lentivirus was examined by real-time RT-PCR. Significance was calculated using Student's t-test. *P < 0.05. Western blot analysis (right). Proteins were extracted from either empty lentivirus or HLA-F lentivirus-infected C8-D1A cells and subjected to Western blot analysis. The membrane was sequentially probed with anti-HLA-F and anti-β-actin antibodies. The data demonstrates one of three independent experiments with similar results. (B) MTT assay. C8-D1A cells were infected with either control or HLA-F lentivirus and selected with puromycin for 14 days. Then, 1 × 10⁴ infected cells were plated into 96-well plates. After 24 h, cell viability was measured by the MTT assay. (C) Colony formation assay. Two hundred empty lentivirus- or HLA-F lentivirus-infected C8-D1A cells were plated into 6-well plates. After 10 days, visible colonies were fixed and stained with crystal violet, and the number of colonies was counted by ImageJ software. (D) C8-D1A cells (1 × 10⁶) were transplanted into Rag2-/- mice (n = 6 mice/group), and cell growth was monitored every other day. (E) The palpable mass was removed and weighed after 14 days. (B-E) The data demonstrate the mean ± SD of one of two independent experiments. Significance was calculated using Student's t-test. *P < 0.05. (F) HS683 cells were transfected with either control shRNA (shCtrl) or shRNAs against HLA-F (shHLA-F). After 24 h, the relative expression of HLA-F mRNA (left) in transfected HS683 cells was assessed by real-time RT-PCR. At the same time, protein (right) was extracted from transfected HS683 cells and subjected to Western blot analysis. The membrane was sequentially probed with anti-HLA-F and anti-β-actin antibodies. The data shows one of three independent experiments. (G) MTT assay. HS683 cells (1 × 10⁴) transfected with either shCtrl or shHLA-F were plated into 96-well plates. After 24 h, cell viability was measured by the MTT assay. (H) Colony formation assay. Two hundred transfected HS683 cells were plated into 6-well plates containing DMEM with 10% FBS in the presence of 2 μg/mL puromycin. 10 days later, colony number was counted by ImageJ software after crystal violet staining. (F-H) The bar graphs present the mean ± SD of one of three independent experiments performed in triplicate with similar results. One-way ANOVA followed by Dunnett's multiple comparisons test was utilized to calculate the P value. *P < 0.05, **P < 0.01. (I) U251 cells were transfected with either shCtrl or shHLA-F. After 24 h, the relative expression of HLA-F mRNA (left) in transfected U251 cells was assessed by real-time RT-PCR. At the same time, protein (right) was extracted from transfected U251 cells and subjected to Western blot analysis. The membrane was sequentially probed with anti-HLA-F and anti-β-actin antibodies. The picture shows one of three independent experiments. (J) MTT assay. U251 cells (1 × 10⁴) transfected with either shCtrl or shHLA-F were plated into 96-well plates. After 24 h, cell viability was measured by the MTT assay. (K) Colony formation assay. Two hundred transfected U251 cells were plated into 6-well plates containing DMEM with 10% FBS in the presence of 2 μg/mL puromycin. After 10 days, colony number was counted by ImageJ software after crystal violet staining. (I-K) The results are the mean ± SD of one of three independent experiments performed in triplicate with similar results. One-way ANOVA followed by Dunnett's multiple comparisons test was utilized to calculate the P value. *P < 0.05, **P < 0.01. (L) HLA-F-expressing C8-D1A cells (1 × 10⁶) were transplanted into Rag2-/- mice. When HLA-F-expressing C8-D1A cells formed a palpable mass, the mice were randomized to receive either the same volume control diluent (n = 7) or 100 µg/tumor anti-HLA-F mAb (n = 6) by intratumor injection. Representative images of palpable mass excised from Rag2-/- mice. (M) Growth curve of C8-D1A cells subjected to control treatmentor the anti-HLA-F monoclonal antibody treatment. *P < 0.05. (N) The palpable mass was removed and weighed at the end of the experiment. The results represent the mean ± SD of the weights. n.s., not significant. (L-N) The data shown represent one of two independent experiments with n = 6-7 mice/group. Significance was calculated using Student's t-test.
HLA-F induced HK2 expression
To adapt to an environment deficient in oxygen, nutrients, and stimuli, cells are forced to reprogram their metabolism to serve their energy needs. Similar to the process of motility, the process of proliferation also poses high energy requirements. Normally differentiated cells primarily rely on mitochondrial oxidative phosphorylation (OXPHOS) to generate the energy needed for cellular processes [30]. Therefore, we investigated whether metabolic changes occurred in response to the increase in HLA-F-mediated proliferation. To address this question, we measured the mitochondrial oxygen consumption rate (OCR) and the extracellular acidification rate (ECAR) in empty vector- and HLA-F-expressing C8-D1A cells. Unexpectedly, the OCR was decreased in HLA-F-infected C8-D1A cells compared to empty vector-infected C8-D1A cells (Figure 3A). Basal and maximal respiration was obviously reduced in HLA-F-expressing C8-D1A cells compared with empty vector-expressing C8-D1A cells (Figures 3B and 3C). Interestingly, we found that HLA-F-expressing C8-D1A cells displayed a higher basal ECAR than empty vector-expressing C8-D1A cells (Figures 3D and 3E). In addition, in contrast to empty vector-expressing C8-D1A cells, HLA-F-expressing C8-D1A cells had a higher glycolytic capacity (Figure 3F) and ECAR/OCR ratio (Figure 3G). These observations indicate that HLA-F-expressing C8-D1A cells could utilize glycolysis rather than mitochondrial OXPHOS.
Forced expression of HLA-F resulted in increased glycolysis. (A) Empty vector-expressing C8-D1A cells and HLA-F-expressing C8-D1A cells were plated into wells, and the OCR was determined by extracellular flux analysis. A representative plot of OCR over time in cells treated with oligomycin (1 μM), FCCP (1 μM), and the electron transport inhibitors antimycin (100 nM) + rotenone (0.5 μM), as indicated. (B) Quantification of the basal respiration in Figure 3A. (C) Quantification of the maximal respiration of Figure 3A. (A-C) The data shown are representative of one of two independent experiments. **P < 0.01. (D) Empty vector-expressing C8-D1A cells and HLA-F-expressing C8-D1A cells were plated into wells, and ECAR was determined by extracellular flux analysis. A representative plot of ECAR over time in cells after the addition of glucose (100 mM), oligomycin (1 μM), and 2-DG (500 mM) as indicated. (E) Quantification of glycolysis in Figure 3D. (F) Quantification of the glycolytic capacity in Figure 3D. (D-F) The data shown are representative of one of two independent experiments. *P < 0.05. (G) Bar graph representing ratios of extracellular acidification rates (ECAR, indicator of aerobic glycolysis) to O2 consumption rates (OCR, indicator of OXPHOS) at baseline. The result represents the mean ± SD. The data shown is representative of one of two independent experiments. *P < 0.05. (H) The levels of glucose uptake in empty vector- or HLA-F-expressing C8-D1A cells were examined. The data shown is representative of one of two independent experiments. n.s., not significant. (I) Western blot analysis. Proteins were extracted from empty vector- and HLA-F-expressing C8-D1A cells and subjected to Western blot analysis. The membrane was sequentially probed with the indicated antibodies. The data shown are representative of one of two independent experiments. (J) Western blot analysis. Proteins were extracted from HS683 cells transfected with either control or shHLA-F and subjected to Western blot analysis. The membrane was sequentially probed with the indicated antibodies. The data shown are representative of one of two independent experiments.
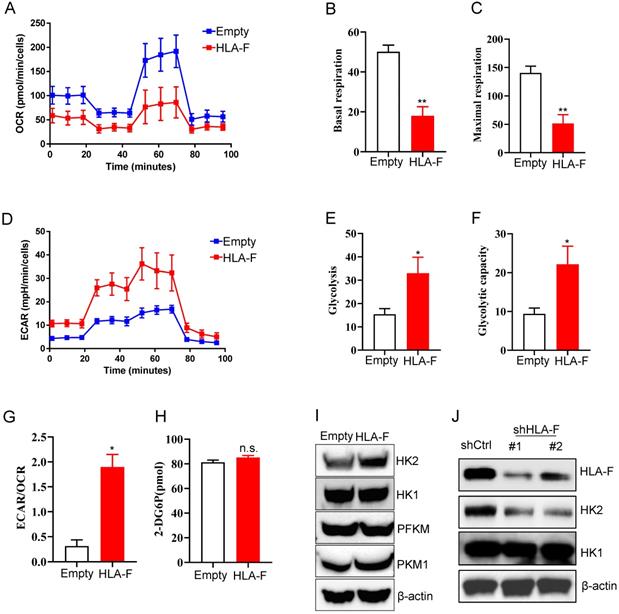
To investigate the underlying molecular mechanism by which HLA-F regulates the high glycolytic phenotype, we first examined whether HLA-F-expressing C8-D1A cells had a much higher glucose uptake rate than their parental cells. As shown in Figure 3H, ectopic expression of HLA-F did not enhance glucose uptake. The finding that HLA-F increased glycolysis without affecting glucose uptake prompted us to ask whether HLA-F modulates the expression of enzymes involved in glucose metabolism. Therefore, we investigated whether HLA-F influences the expression of glycolytic enzymes and found that the protein level of HK2, a member of the HK family involved in catalyzing the first committed step in glucose metabolism [34], was increased in HLA-F-expressing C8-D1A cells (Figure 3I). However, the expression levels of HK1 and PFKM were almost identical in HLA-F-expressing C8-D1A cells compared with empty vector-expressing C8-D1A cells (Figure 3I). The levels of PKM1 were slightly increased in HLA-F-expressing C8-D1A cells compared with empty vector-expressing C8-D1A cells (Figure 3I). On the other hand, targeting HLA-F by shRNA suppressed HK2 protein expression in HS683 cells compared to HS683 cells transfected with control shRNA (Figure 3J). However, shRNA against HLA-F did not influence the expression of HK1 (Figure 3J). These results indicated that HLA-F could be involved in regulating cell proliferation through the induction of HK2 expression.
HLA-F promoted proliferation by regulating HK2
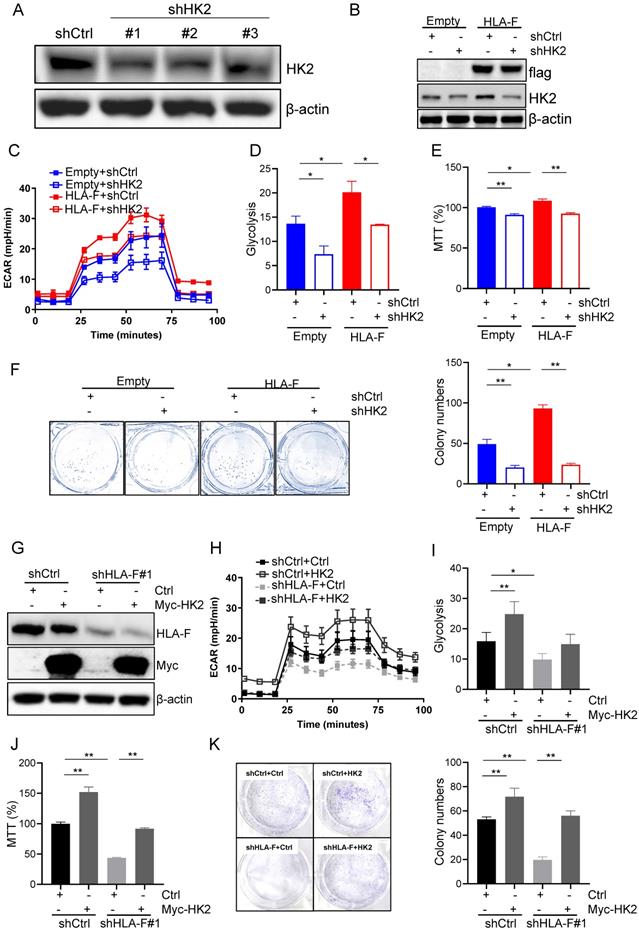
To confirm that HLA-F promoted proliferation by modulating HK2 expression, we silenced HK2 with shRNA and performed Seahorse and proliferation assays. shRNA #1 and #2 against HK2 reduced HK2 expression in C8-D1A cells (Figure 4A). Herein, we utilized #1 shHK2 for subsequent experiments. Knockdown of HK2 effectively decreased HLA-F-mediated HK2 expression (Figure 4B). Additionally, the silencing of HK2 in HLA-F-expressing C8-D1A cells significantly decreased glycolysis compared to that in shCtrl-transfected cells (Figures 4C and 4D). Moreover, knocking down HK2 inhibited HLA-F-promoted cell proliferation (Figures 4E and 4F). On the other hand, ectopic expression of HK2 in HS683 cells transfected with shHLA-F increased glycolysis and the colony numbers compared with their parental cells (Figures 4G-4K). These observations demonstrated that HK2 could be critical for HLA-F-mediated cell proliferation.
HK2 was required for HLA-F-mediated proliferation and glycolysis. (A) Western blot analysis. Proteins were extracted from C8-D1A cells transfected with either control or shHK2 and subjected to Western blot analysis. The membrane was sequentially probed with anti-HK2 and anti-β-actin antibodies. The data shown are representative of one of two independent experiments. (B) Western blot analysis. Proteins were extracted from empty vector- or HLA-F-expressing C8-D1A cells transfected with either shCtrl or shHK2 and subjected to Western blot analysis. The membrane was sequentially probed with anti-flag, anti-HK2 and anti-β-actin antibodies. The data represent one of two independent experiments. (C) Empty vector-expressing C8-D1A cells and HLA-F-expressing C8-D1A cells were transfected with either shCtrl or shHK2, and ECAR was determined by extracellular flux analysis. A representative plot of ECAR over time in these cells after the addition of glucose (100 mM), oligomycin (1 μM), and 2-DG (500 mM) as indicated. (D) Quantification of glycolysis in Figure 4C. (E) MTT assay. A total of 1 × 10⁴ empty vector-expressing C8-D1A cells and HLA-F-expressing C8-D1A cells transfected with either control or shHK2 were plated into 96-well plates. After 24 h, cell viability was measured by the MTT assay. (F) Colony formation assay. 200 empty vector- and HLA-F-expressing C8-D1A cells transfected with either control or shHK2 were plated into 6-well plates containing DMEM and 10% FBS in the presence of 2 μg/mL puromycin. 10 days later, the colonies were stained with crystal violet, and the number of colonies was counted by ImageJ software. (C-F) The bar graphs are the mean ± SD of one of two independent experiments performed in duplicate with similar results. One-way ANOVA followed by Tukey's multiple comparisons test was utilized to calculate the P value. *P < 0.05, **P < 0.01. (G) Western blot analysis. HS683 cells were treated with shRNA against HLA-F or nonspecific sequences (NS) followed by transfection with either empty vector or HK2 plasmid DNA for 24 h. Cell lysates were harvested and blotted for the indicated proteins. The data shown is representative of one of two independent experiments. (H) HS683 cells were treated with shRNA against HLA-F or non-specific sequences (NS) followed by transfection with either empty or HK2 plasmid DNA, and ECAR was determined by extracellular flux analysis. (I) Glycolysis of Figure 4H was quantified. (J) MTT assay. 1 × 10⁴ HS683 cells were treated with shRNA against HLA-F or non-specific sequences (NS) followed by transfection with either empty or HK2 plasmid DNA and planted into 96-wells. After 24 h, the viability of transfected cell was measured by MTT. (K) Colony formation assay. HS683 cells were treated with shRNA against HLA-F or nonspecific sequences (NS) followed by transfection with either empty vector or HK2 plasmid DNA. After 24 h later, the transfected cells were exposed to 2 μg/mL puromycin and 0.5 μg/mL G418 for 7 days. Two hundred selected cells were plated into 6-well plates containing DMEM and 10% FBS in the presence of 2 μg/mL puromycin and 0.5 μg/mL G418 for 7 days. Ten days later, the number of colonies was counted by ImageJ software after crystal violet staining. (H-K) The data shown are the mean ± SD of one of two independent experiments performed in duplicate with similar results. One-way ANOVA followed by Tukey's multiple comparisons test was utilized to calculate the P value. *P < 0.05, **P < 0.01.
HLA-F was required for HK2 protein stabilization
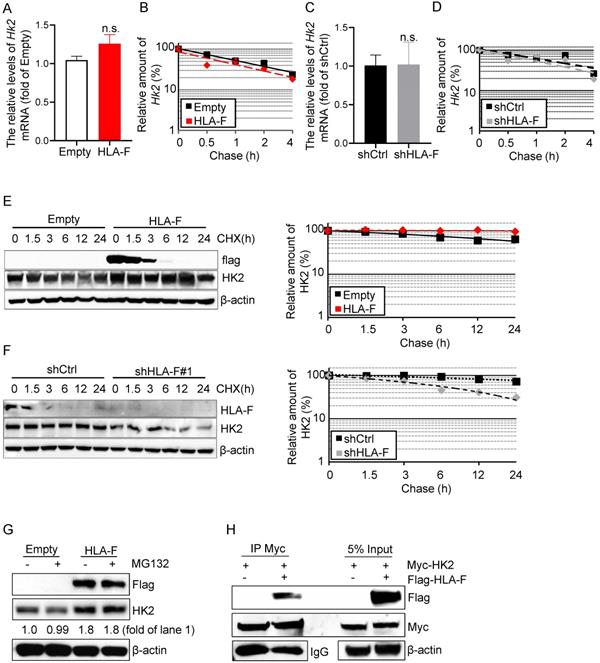
HK2 is an attractive drug target against human cancers [16, 35, 36], which has prompted a number of investigations into the underlying molecular basis of HK2 regulation in cancers. HK2 is regulated at the mRNA and protein levels [37]. To determine the mechanisms by which HLA-F controls HK2 expression, we first performed real-time RT-PCR and found that the mRNA levels of Hk2 were almost identical in HLA-F-expressing C8-D1A cells compared to their parental cells (Figure 5A). Additionally, forced expression of HLA-F did not influence the stabilization of Hk2 mRNA in C8-D1A cells (Figure 5B). Furthermore, knockout of HLA-F by shRNA did not affect the Hk2 transcriptional levels or the stabilization of Hk2 mRNA in HS683 cells (Figures 5C and 5D). Since HLA-F acts as a chaperone and stabilizes HLA class I molecules that have not yet bound peptides, we hypothesized that HLA-F could be involved in regulating the stabilization of the HK2 protein. We next examined the half-life of HK2 in the presence or absence of HLA-F. As expected, HK2 degradation was slower in HLA-F-expressing C8-D1A cells than in their parental cells (Figure 5E). In contrast, silencing HLA-F in HS683 cells induced the degradation of HK2 compared to that in HS683 cells transiently transfected with shCtrl (Figure 5F). To examine whether HLA-F affects HK2 stability through ubiquitination degradation, we treated empty vector-expressing or HLA-F-expressing C8-D1A cells with MG-132 and found that HK2 expression did not change in the presence of MG-132 (Figure 5G). To further explore the relationship between HLA-F and HK2, we also performed co-IP and found that HLA-F interacted with HK2 (Figure 5H), indicating that HLA-F was critical for HK2 stabilization.
HLA-F was involved in mediating HK2 protein stabilization. (A) C8-D1A cells were infected with either empty lentivirus or HLA-F lentivirus and selected with puromycin for 14 days. The relative expression of Hk2 in C8-D1A cells infected with either empty lentivirus or HLA-F lentivirus was examined by real-time RT-PCR. n.s., not significant. (B) Actinomycin D was added into the wells for the indicated timepoints to block RNA synthesis. Hk2 mRNA was analyzed using real-time RT-PCR in C8-D1A cells infected with either empty lentivirus or HLA-F lentivirus. (C) The relative expression of Hk2 in HS683 cells transfected with either control shRNA or shRNA against HLA-F was examined by real-time RT-PCR. n.s., not significant. (D) Actinomycin D was added for the indicated timepoints. Hk2 mRNA was analyzed using real-time RT-PCR in HS683 cells transfected with either control shRNA or shRNA against HLA-F. (A-D) The data represent one of three independent experiments performed in triplicate with similar results. Significance was calculated using Student's t-test. (E) C8-D1A cells infected with either empty lentivirus or HLA-F lentivirus were treated with CHX at a final concentration of 100 μg/mL. At the indicated timepoints, protein was extracted, and the levels of flag, HK2, and β-actin were analyzed by Western blotting. The amount of HK2 in these cells was quantified by densitometry, normalized to the level of β-actin, and plotted. The data shown are representative of one of two independent experiments. (F) HS683 cells transfected with either shCtrl or shHLA-F were treated with CHX for the indicated timepoints. Protein was extracted, and the levels of HLA-F, HK2 and β-actin were analyzed by Western blotting. The amount of HK2 in these cells was quantified by densitometry, normalized to the level of β-actin, and plotted. The data shown are representative of one of two independent experiments. (G) Empty vector-expressing or HLA-F-expressing C8-D1A cells were treated with 5 μM MG-132 for 5 h before harvesting. The membrane was probed with the indicated antibodies. The data shown are representative of one of two independent experiments. (H) 293T cells were cotransfected with the indicated plasmid DNA. After 24 h, the cell lysates were isolated and immunoprecipitated with an anti-Myc antibody and analyzed by Western blotting using an anti-flag antibody.
Discussion
HLA-F, a nonclassical HLA-Ib molecule, has been indicated to be critical for human pregnancy, infection and autoimmunity [8, 11, 12]. A large number of studies found that HLA-F is aberrantly expressed in several types of cancers [9, 13, 14] and is associated with overall survival in cancer patients [9, 13]. The underlying mechanism of HLA-F activity remains obscure, and only recently has it become clear that HLA-F is an important immune regulator [38]. Recent data indicated that HLA-F interacts with both activating and inhibitory receptors expressed on immune cells, which could present a diverse panel of peptides to T cells [39-41]. It has also been shown that HLA-F can present peptides to T cells and can regulate immunity via interactions with distinct NK cell receptors, which depends on the molecular conformation of peptide-bound HLA-F or HLA-F open conformers [41], highlighting the function of HLA-F as an important immunoregulatory molecule. However, in addition to acting as an immunoregulatory molecule, the roles of HLA-F in tumor development are unclear.
Consistent with a previous study [9], we also found that HLA-F was constitutively expressed in GM (Figure 1). High expression of HLA-F predicted the progression and recurrence of GM (Table 2). Interestingly, aberrant expression of HLA-F resulted in a high cell proliferation index both in vitro and in vivo (Table 2, Figure 2). It has been generally accepted that proliferating cells utilize glycolysis to assist their growth [36]. A shift to glycolysis resulting from aberrant regulation of glycolytic enzymes was observed in several types of cancers [19, 42-44]. Notably, in this study, a shift to glycolysis occurred in HLA-F-expressing C8-D1A cells along with an increase in HK2 expression (Figure 3). Silencing of HK2 suppressed HLA-F-mediated cell proliferation in parallel with a decrease in glycolysis (Figure 4). On the other hand, ectopic expression of HK2 in HS683 cells transfected with shHLA-F increased the colony number (Figure 4). These observations suggested that HLA-F-induced cell proliferation could depend on HK2-mediated glycolysis. In addition, elevated glycolysis with similar glucose uptake levels suggested pentose phosphate pathway (PPP) activity, which is very relevant for nucleotide biosynthesis, and the generation of reducing power (NADPH) [45] could be decreased in HLA-F-expressing GM cells. As expected, glucose-6-phosphate dehydrogenase (G6PDH) activity was decreased in HLA-F-expressing C8-D1A cells (Supplementary Figure 1), indicating that HLA-F-expressing GM cells might be sensitive to reactive oxygen species or ribose shortages, which should be investigated in further studies. Moreover, HLA-F expressed in some tissues and immune cells, and may be involved in altering the activation threshold of immune effector cells and mediating the activation of immune cells, such as activated regulator T cells [40, 46]. If blocking HLA-F by antibody in the mouse model could influence the functions of immune cells are unclear, which need to be clarified in further experiments.
Unlike HK1, HK2 is highly expressed in a variety of tumors, including GBM [42], and is a key mediator of glycolysis in GBM [19]. Silencing of HK2, but not HK1, by siRNA inhibited tumor growth in a xenograft model of GBM [19]. Similarly, knocking down HK2 by shRNA suppressed the proliferation of HLA-F-expressing C8-D1A cells (Figure 4). Constitutive expression of HK2 could protect cancer cells from apoptosis and provide a survival and proliferating advantage in vivo [42]. Additionally, HK2 plays an important role in tumor initiation and maintenance [32]. The metabolic switch is one of the characteristic hallmarks of cancer cells and contributes to tumor development [47]. All of these observations suggest that beyond its classical roles in immunity, HLA-F might function as an “oncogenic driver” in the progression of GBM by regulating HK2-dependent glycolysis, at least partially, although we cannot rule out the roles of HLA-F in allowing cancer cells to escape immune system surveillance in vivo.
Our study showed that HK2 protein expression was elevated in the presence of HLA-F, while HK1 expression did not change significantly. The underlying molecular basis for the selective induction of HK2 expression in HLA-F-expressing C8-D1A cells may be related to the fact that HLA-F interacted with HK2 and enhanced the stabilization of the HK2 protein (Figure 5), although the mechanisms by which HLA-F is involved in regulating HK2 stabilization are unclear. Moreover, HK2 has been shown to translocate into the outer mitochondrial membrane and interact with voltage-dependent anion channels (VDACs) [21, 22]. Knocking down HK2 dramatically increased the expression of OXPHOS-associated proteins involved in the electron transport chain, as well as the key transcription factors involved in mitochondrial function and biogenesis [19]. All of these data further elucidate the role of HLA-F in suppressing OXPHOS (Figure 3).
In summary, our results demonstrated that HLA-F promoted cell proliferation by regulating HK2-dependent glycolysis. Additionally, our also indicated that HLA-F could be a potential therapeutic target for the treatment of GBM.
Abbreviations
GM: glioma; GBM: glioblastoma; CD95L: CD95 ligand; HLA-I: HLA class I; HLA-Ib: nonclassical HLA class I molecule; KIRs: killer cell immunoglobulin-like receptors; HKs: hexokinases; mAb: monoclonal antibody; IPTG: isopropyl-1-thio-β-D-galactopyranoside; IDA: iminodiacetic acid; HAT: hypoxanthine-aminopterin-thymidine; HT: hypoxanthine-thymidine; ELISA: enzyme-linked immunosorbent assay; HRP: horseradish peroxidase; SPF: specific pathogen-free; MTT: 3‐(4,5‐dimethylthiazol‐2‐yl)‐2,5‐diphenyltetrazolium bromide; CHX: cycloheximide; SDS: sodium dodecyl sulfate; ECAR: extracellular acidification rate; OCR: oxygen consumption rate; FCCP: Carbonyl cyanide 4-(trifluoromethoxy)phenylhydrazone; OS: overall survival; LGG: low-grade glioma; TCGA: The Cancer Genome Atlas; PCNA: proliferating cell nuclear antigen; OXPHOS: oxidative phosphorylation; PPP: pentose phosphate pathway; G6PDH: glucose-6-phosphate dehydrogenase.
Supplementary Material
Supplementary figure S1.
Acknowledgements
This study was supported by the Foundation for Key Program of Universities of Jiangsu Province (No. 17KJA320010) and the Jiangsu Shuangchuang Program and Jiangsu Distinguished Professorship Program to J.Y.
Author contributions
- Conceptualization, J.Y.; Methodology, X.C., N.S., R.L.;
- Investigation, X.C., N.S., R.L., X.S., X.L. J.Z. and J.H.;
- Writing-Original Draft, X.C., N.S., R.L., J.Y. and T.I.; Writing-Review & Editing, J.Y. and T.I.;
- Funding Acquisition, J.Y.; Supervision, J.Y.
Competing Interests
J.Y. has filed a patent on the generation and application of anti-HLA-F antibody. Other authors have declared that no competing interest exists.
References
1. Huang K, Fang C, Yi K, Liu X, Qi H, Tan Y. et al. The role of PTRF/Cavin1 as a biomarker in both glioma and serum exosomes. Theranostics. 2018;8:1540-57
2. Affronti ML, Heery CR, Herndon JE 2nd, Rich JN, Reardon DA, Desjardins A. et al. Overall survival of newly diagnosed glioblastoma patients receiving carmustine wafers followed by radiation and concurrent temozolomide plus rotational multiagent chemotherapy. Cancer. 2009;115:3501-11
3. Doucette T, Rao G, Rao A, Shen L, Aldape K, Wei J. et al. Immune heterogeneity of glioblastoma subtypes: extrapolation from the cancer genome atlas. Cancer immunology research. 2013;1:112-22
4. Liebelt BD, Shingu T, Zhou X, Ren J, Shin SA, Hu J. Glioma Stem Cells: Signaling, Microenvironment, and Therapy. Stem cells international. 2016;2016:7849890
5. Szopa W, Burley TA, Kramer-Marek G, Kaspera W. Diagnostic and Therapeutic Biomarkers in Glioblastoma: Current Status and Future Perspectives. BioMed research international. 2017;2017:8013575
6. Pistillo MP, Nicolo G, Salvi S, Capanni P, Perdelli L, Pasciucco G. et al. Biochemical analysis of HLA class I subunits expression in breast cancer tissues. Human immunology. 2000;61:397-407
7. da Silva GB, Silva TG, Duarte RA, Neto NL, Carrara HH, Donadi EA. et al. Expression of the Classical and Nonclassical HLA Molecules in Breast Cancer. International journal of breast cancer. 2013;2013:250435
8. Laaribi AB, Hannachi N, Ben Yahia H, Marzouk M, Mehri A, Belhadj M. et al. Human leukocyte antigen (HLA-F) polymorphism is associated with chronic HBV infection. 3 Biotech. 2018 8: 49
9. Feng E, Liang T, Wang X, Du J, Tang K, Wang F. et al. Correlation of alteration of HLA-F expression and clinical characterization in 593 brain glioma samples. Journal of neuroinflammation. 2019;16:33
10. Garcia-Beltran WF, Holzemer A, Martrus G, Chung AW, Pacheco Y, Simoneau CR. et al. Open conformers of HLA-F are high-affinity ligands of the activating NK-cell receptor KIR3DS1. Nature immunology. 2016;17:1067-74
11. Burrows CK, Kosova G, Herman C, Patterson K, Hartmann KE, Velez Edwards DR. et al. Expression Quantitative Trait Locus Mapping Studies in Mid-secretory Phase Endometrial Cells Identifies HLA-F and TAP2 as Fecundability-Associated Genes. PLoS genetics. 2016;12:e1005858
12. Song S, Miranda CJ, Braun L, Meyer K, Frakes AE, Ferraiuolo L. et al. Major histocompatibility complex class I molecules protect motor neurons from astrocyte-induced toxicity in amyotrophic lateral sclerosis. Nature medicine. 2016;22:397-403
13. Lin A, Zhang X, Ruan YY, Wang Q, Zhou WJ, Yan WH. HLA-F expression is a prognostic factor in patients with non-small-cell lung cancer. Lung Cancer. 2011;74:504-9
14. Ishigami S, Arigami T, Okumura H, Uchikado Y, Kita Y, Kurahara H. et al. Human leukocyte antigen (HLA)-E and HLA-F expression in gastric cancer. Anticancer research. 2015;35:2279-85
15. Gabriely G, Wheeler MA, Takenaka MC, Quintana FJ. Role of AHR and HIF-1alpha in Glioblastoma Metabolism. Trends in endocrinology and metabolism: TEM. 2017;28:428-36
16. Patra KC, Wang Q, Bhaskar PT, Miller L, Wang Z, Wheaton W. et al. Hexokinase 2 is required for tumor initiation and maintenance and its systemic deletion is therapeutic in mouse models of cancer. Cancer cell. 2013;24:213-28
17. Robey RB, Hay N. Mitochondrial hexokinases, novel mediators of the antiapoptotic effects of growth factors and Akt. Oncogene. 2006;25:4683-96
18. Wilson JE. Isozymes of mammalian hexokinase: structure, subcellular localization and metabolic function. The Journal of experimental biology. 2003;206:2049-57
19. Wolf A, Agnihotri S, Micallef J, Mukherjee J, Sabha N, Cairns R. et al. Hexokinase 2 is a key mediator of aerobic glycolysis and promotes tumor growth in human glioblastoma multiforme. The Journal of experimental medicine. 2011;208:313-26
20. Agnihotri S, Mansouri S, Burrell K, Li M, Mamatjan Y, Liu J. et al. Ketoconazole and Posaconazole Selectively Target HK2-expressing Glioblastoma Cells. Clinical cancer research: an official journal of the American Association for Cancer Research. 2019;25:844-55
21. Gottlob K, Majewski N, Kennedy S, Kandel E, Robey RB, Hay N. Inhibition of early apoptotic events by Akt/PKB is dependent on the first committed step of glycolysis and mitochondrial hexokinase. Genes & development. 2001;15:1406-18
22. Pastorino JG, Shulga N, Hoek JB. Mitochondrial binding of hexokinase II inhibits Bax-induced cytochrome c release and apoptosis. The Journal of biological chemistry. 2002;277:7610-8
23. Majewski N, Nogueira V, Bhaskar P, Coy PE, Skeen JE, Gottlob K. et al. Hexokinase-mitochondria interaction mediated by Akt is required to inhibit apoptosis in the presence or absence of Bax and Bak. Molecular cell. 2004;16:819-30
24. Mathupala SP, Rempel A, Pedersen PL. Glucose catabolism in cancer cells. Isolation, sequence, and activity of the promoter for type II hexokinase. The Journal of biological chemistry. 1995;270:16918-25
25. Mathupala SP, Rempel A, Pedersen PL. Glucose catabolism in cancer cells: identification and characterization of a marked activation response of the type II hexokinase gene to hypoxic conditions. The Journal of biological chemistry. 2001;276:43407-12
26. Peppicelli S, Ruzzolini J, Andreucci E, Bianchini F, Kontos F, Yamada T. et al. Potential Role of HLA Class I Antigens in the Glycolytic Metabolism and Motility of Melanoma Cells. Cancers. 2019 11
27. Li R, Sun N, Chen X, Li X, Zhao J, Cheng W. et al. JAK2(V617F) Mutation Promoted IL-6 Production and Glycolysis via Mediating PKM1 Stabilization in Macrophages. Frontiers in immunology. 2020;11:589048
28. Kong N, Meng Q, Jiao Y, Wu Y, Zuo Y, Wang H. et al. Identification of a novel B-cell epitope in the spike protein of porcine epidemic diarrhea virus. Virology journal. 2020;17:46
29. Agata Y, Kawasaki A, Nishimura H, Ishida Y, Tsubata T, Yagita H. et al. Expression of the PD-1 antigen on the surface of stimulated mouse T and B lymphocytes. International immunology. 1996;8:765-72
30. Heiden MGV, Cantley LC, Thompson CB. Understanding the Warburg Effect: The Metabolic Requirements of Cell Proliferation. Science. 2009;324:1029-33
31. Chowdhury A, Lu J, Zhang R, Nabila J, Gao H, Wan Z. et al. Mangiferin ameliorates acetaminophen-induced hepatotoxicity through APAP-Cys and JNK modulation. Biomedicine & pharmacotherapy = Biomedecine & pharmacotherapie. 2019;117:109097
32. Ren F, Wang R, Zhang Y, Liu C, Wang Y, Hu J. et al. Characterization of a monoclonal antibody against CREPT, a novel protein highly expressed in tumors. Monoclonal antibodies in immunodiagnosis and immunotherapy. 2014;33:401-8
33. Korkolopoulou P, Christodoulou P, Kouzelis K, Hadjiyannakis M, Priftis A, Stamoulis G. et al. MDM2 and p53 expression in gliomas: a multivariate survival analysis including proliferation markers and epidermal growth factor receptor. British journal of cancer. 1997;75:1269-78
34. Patra KC, Wang Q, Bhaskar PT, Miller L, Wang ZB, Wheaton W. et al. Hexokinase 2 Is Required for Tumor Initiation and Maintenance and Its Systemic Deletion Is Therapeutic in Mouse Models of Cancer (vol 24, pg 213, 2013). Cancer cell. 2013;24:399 -
35. Ros S, Schulze A. Glycolysis back in the limelight: systemic targeting of HK2 blocks tumor growth. Cancer discovery. 2013;3:1105-7
36. Wang L, Xiong H, Wu F, Zhang Y, Wang J, Zhao L. et al. Hexokinase 2-mediated Warburg effect is required for PTEN- and p53-deficiency-driven prostate cancer growth. Cell reports. 2014;8:1461-74
37. Yang T, Ren C, Qiao P, Han X, Wang L, Lv S. et al. PIM2-mediated phosphorylation of hexokinase 2 is critical for tumor growth and paclitaxel resistance in breast cancer. Oncogene. 2018;37:5997-6009
38. Lin A, Yan WH. The Emerging Roles of Human Leukocyte Antigen-F in Immune Modulation and Viral Infection. Frontiers in immunology. 2019;10:964
39. Goodridge JP, Burian A, Lee N, Geraghty DE. HLA-F and MHC class I open conformers are ligands for NK cell Ig-like receptors. J Immunol. 2013;191:3553-62
40. Lepin EJ, Bastin JM, Allan DS, Roncador G, Braud VM, Mason DY. et al. Functional characterization of HLA-F and binding of HLA-F tetramers to ILT2 and ILT4 receptors. European journal of immunology. 2000;30:3552-61
41. Dulberger CL, McMurtrey CP, Holzemer A, Neu KE, Liu V, Steinbach AM. et al. Human Leukocyte Antigen F Presents Peptides and Regulates Immunity through Interactions with NK Cell Receptors. Immunity. 2017;46:1018-29 e7
42. Bonnet S, Archer SL, Allalunis-Turner J, Haromy A, Beaulieu C, Thompson R. et al. A mitochondria-K+ channel axis is suppressed in cancer and its normalization promotes apoptosis and inhibits cancer growth. Cancer cell. 2007;11:37-51
43. Gatenby RA, Gillies RJ. Why do cancers have high aerobic glycolysis? Nature reviews Cancer. 2004;4:891-9
44. Vander Heiden MG, Cantley LC, Thompson CB. Understanding the Warburg effect: the metabolic requirements of cell proliferation. Science. 2009;324:1029-33
45. Jiang P, Du W, Wu M. Regulation of the pentose phosphate pathway in cancer. Protein & cell. 2014;5:592-602
46. Lee N, Ishitani A, Geraghty DE. HLA-F is a surface marker on activated lymphocytes. European journal of immunology. 2010;40:2308-18
47. Hanahan D, Weinberg RA. Hallmarks of cancer: the next generation. Cell. 2011;144:646-74
Author contact
![]() Corresponding author: Jiangsu Province Key Laboratory of Immunity and Metabolism, Department of Pathogenic Biology and Immunology, Xuzhou Medical University, 209 Tongshan Road, Xuzhou, Jiangsu, China. Jing Yang, E-mail: jingyangedu.cn.
Corresponding author: Jiangsu Province Key Laboratory of Immunity and Metabolism, Department of Pathogenic Biology and Immunology, Xuzhou Medical University, 209 Tongshan Road, Xuzhou, Jiangsu, China. Jing Yang, E-mail: jingyangedu.cn.