Impact Factor ISSN: 1449-2288

 Global reach, higher impact
Int J Biol Sci 2021; 17(5):1302-1314. doi:10.7150/ijbs.56477 This issue Cite
Research Paper
Aurka deficiency in the intestinal epithelium promotes age-induced obesity via propionate-mediated AKT activation
Na Sun1,2*, Fandong Meng3*, Jie Zhao1,2, Xueqin Li1,2, Rongqing Li1,2, Jing Han1,2, Xin Chen1,2, Wanpeng Cheng1,2, Xiaoying Yang1,2, Yanbo Kou1,2, Kuiyang Zheng1,2,4 ![]() , Jing Yang1,2,4
, Jing Yang1,2,4 ![]() , Takayuki Ikezoe5
, Takayuki Ikezoe5
1. Jiangsu Province Key Laboratory of Immunity and Metabolism, Affiliated Hospital of Xuzhou Medical University.
2. Department of Pathogenic Biology and Immunology, Affiliated Hospital of Xuzhou Medical University.
3. Department of Endocrinology, Affiliated Hospital of Xuzhou Medical University.
4. National Experimental Demonstration Center for Basic Medicine Education, Xuzhou Medical University, Xuzhou, Jiangsu, China.
5. The Department of Hematology, Fukushima Medical University, Fukushima, Japan.
*These authors contributed equally to this work.
Received 2020-11-29; Accepted 2021-3-11; Published 2021-3-25
Abstract

Aurora-A kinase, a serine/threonine mitotic kinase involved in mitosis, is overexpressed in several human cancers. A recent study showed that Aurora-A mediates glucose metabolism via SOX8/FOXK1 in ovarian cancer. However, the roles of Aurora-A in metabolic diseases remain unclear. This study found that Aurka loss in the intestinal epithelium promoted age-induced obesity and enlargement of lipid droplets in parallel with an increase in infiltrated macrophages in the white adipocyte tissue (WAT) of male mice. Moreover, loss of Aurka induced the expression of lipid metabolism regulatory genes, including acetyl-coenzyme A carboxylase 1 (Acc1), in association with an increase in the levels of p-AKT in the intestinal epithelium as well as WAT. Blockade of AKT activation reduced the expression of lipid metabolism regulatory genes. In subsequent experiments, we found that the Firmicutes abundance and the levels of short-chain fatty acids (SCFAs) in the gut were dramatically increased in Aurkaf/+;VillinCre/+ mice compared with Aurkaf/+ mice. Additionally, propionate increased the phosphorylation of AKT in vitro. These observations indicated that Aurka loss in the intestinal epithelium contributed to gut microbiota dysbiosis and higher levels of SCFAs, especially propionate, leading to AKT activation and lipid metabolism regulatory gene expression, which in turn promoted age-induced obesity.
Keywords: Aurora-A, AKT, obesity, IL-6
Introduction
Obesity has gained widespread recognition as a global pandemic caused by overnutrition and sedentary lifestyles [1]. From a public health perspective, obesity is a major risk factor for cancers and metabolic disorders, including nonalcoholic fatty liver disease, diabetes, and cardiovascular disease [2-5]. A growing number of studies have indicated that inflammation could play a major role in obesity [6, 7]. Additionally, high nutrient content and nutrient absorption appear to be associated with obesity by altering the morphology and function of epithelial cells [8]. The mechanisms involved in obesity remain to be fully elucidated, although the incidence of obesity is often attributed to an unhealthy lifestyle.
The mitotic kinase Aurora kinase A (Aurora-A) belongs to the serine/threonine kinase family and controls multiple steps of mitotic progression, including microtubule stability during the G1 phase of the cell cycle, chromosome alignment and segregation, and cytokinesis [9]. Multiple studies have suggested that Aurora-A is aberrantly expressed in various types of cancers, including hematopoietic malignancies and colorectal cancer [9]. In addition to playing a role in mitosis, Aurora-A is active during G1 and regulates microtubule stability in cooperation with TPX2 and CEP192 [10]. During neurite extension, Aurora A is also involved in microtubule organization regulation [11]. Furthermore, it has been shown that Aurora-A translocates into the nucleus and contributes to distinct oncogenic properties in breast cancer cells by enhancing the breast cancer stem cell (BCSC) phenotype, which is independent of its kinase activity [12]. A recent study also showed that Aurora-A translocates into mitochondria and directly interacts with proteins that regulate mitochondrial dynamics, leading to increased mitochondrial fusion [13]. Additionally, overexpression of Aurora-A contributes to elevated ATP production in parallel with an increase in the abundance of mitochondrial complex IV [13]. Interestingly, the expression of Aurora-A is elevated in human diabetic skin tissue, although the role of elevated Aurora-A in diabetic skin tissues remains unclear [14]. These observations imply that Aurora-A's functions beyond its classical mitosis and kinase activity are still largely unexplored.
To further investigate the metabolic function of Aurora-A, we generated Aurora-A conditional knockout (CKO) mice by crossing Aurkaflox/flox (Aurkaf/f) mice with VillinCre/+ mice, in which Cre-dependent recombination is induced in the intestinal epithelium by embryonic day (E) 12.5 [15]. We unexpectedly discovered that Aurkaf/+;VillinCre/+ mice, though developmentally normal, displayed age-induced obesity and maintained insulin sensitivity well into late adulthood. Further studies revealed that the levels of genes involved in nutrient absorption, including the solute carrier 2A4 (Slc2a4) gene, which encodes glucose transporter protein GLUT4, were increased in association with increased expression of p-AKT in Aurkaf/+;VillinCre/+ mice.
Material and Methods
Generation of conditional Aurka knockout mice
Conditional Aurka knockout mice were generated as previously described [16]. VillinCre mice [B6. SJL-Tg (Vil-cre)997Gum/J] were intercrossed with mice carrying loxP-flanked Aurka alleles (Aurkaf/f). PCR was utilized to confirm conditional Aurka knockout using primers as previously described [16]. The mice were bred and maintained strictly according to protocols approved by the Institutional Animal Care and Use Committee at Xuzhou Medical University.
Metabolic analyses
Body weights were recorded weekly. Metabolic studies were performed as previously described [1]. The mice were placed individually in the metabolic chambers of an Oxymax system (Columbus Instruments) and were allowed to acclimate for a 24-hour period. The respiratory exchange ratio (RER) was calculated as the volume of CO2 versus the oxygen volume (VCO2/VO2). To assess energy intake, mice were housed individually, and food consumption was measured. Food consumption data were normalized to body weight measurements. Energy intake in calories was calculated by multiplying the number of grams of normal chow diet consumed daily by 3.93 kcal/gram as described previously [1].
For the glucose tolerance test, 16-hour-fasted mice were injected intraperitoneally with D-glucose (2.5 g/kg body weight). Blood glucose concentrations were examined in tail vein blood samples collected at the designated time points by an Accu-Chek Aviva glucometer (Roche, Basel, Switzerland). Serum triglyceride (TG) and total cholesterol (TC) levels were measured using colorimetric kits (Nanjing Jiancheng Bioengineering Institute, China) based on the protocol recommended by the manufacturer.
Real-time reverse transcription-polymerase chain reaction (RT-PCR)
RNA was extracted and subjected to real-time RT-PCR as previously described [1]. We measured the expression of actin for normalization on a LightCycler 480 (Roche). The primer sets for PCR are shown in Table 1.
Real-time RT-PCR primers
| Gene | Direction | Primer |
|---|---|---|
| Pept1 (mouse) | Forward | 5'- AACTGTGGCGGTCGGCAATAT -3' |
| Reverse | 5'-CTGTGCTTCAATCTCTGCTGGGT-3' | |
| Il6 (mouse) | Forward | 5'- CCGGAGAGGAGACTTCACAG -3' |
| Reverse | 5'- CCACGATTTCCCAGAGAAC -3' | |
| Lat1 (mouse) | Forward | 5'-GCACCACCATCTCCAAGTCAGG-3' |
| Reverse | 5'-GAATGATGAGCAGCTCGATCCA-3' | |
| Eaat3 (mouse) | Forward | 5'-ATTTTCCATTTTGACCTCATCTCCA -3' |
| Reverse | 5'-TTCCCCTAAACCCCACAACTATCTT-3' | |
| Il1b (mouse) | Forward | 5'-CAGGCAGGCAGTATCACTCA -3' |
| Reverse | 5'-TGTCCTCATCCTGGAAGGTC -3' | |
| Mtp (mouse) | Forward | 5'-CTTCCGCACTTTCCGAGATG-3' |
| Reverse | 5'-TCAAAGCCCAGGACTGTCAT-3' | |
| Fabp2 (mouse) | Forward | 5'-TGTTGTGTTTGAGCTCGGTG-3' |
| Reverse | 5'-TTTCCCTCAATGGTCCAGGC-3' | |
| Slc2a2 (mouse) | Forward | 5'- CTGCACCATCTTCATGTCGG-3' |
| Reverse | 5'- ACCTGGCCCAATCTCAAAGA -3' | |
| Glut4 (mouse) | Forward | 5'- CCGAAAGAGTCTAAAGCGCC-3' |
| Reverse | 5'- GCTCTCTCTCCAACTTCCGT -3' | |
| Scd1 (mouse) | Forward | 5'-CTTCCTCCTGAATACATCCCTCC-3' |
| Reverse | 5'- CTCCATCCCATCTAGCACAACCT -3' | |
| Acc1 (mouse) | Forward | 5'- TGCTGGATTATCTTGGCTTCA-3' |
| Reverse | 5'- CCCGTGGGAGTAGTTGCTGTA -3' | |
| Il6 (human) | Forward | 5'-TACATCCTCGACGGCATCTC -3' |
| Reverse | 5'-AGTGCCTCTTTGCTGCTTTC -3' | |
| Mtp (human) | Forward | 5'-GGACGTCAAGAACATCCTGC-3' |
| Reverse | 5'-CGACGGACAATTTTGCTTGC-3' | |
| Il1b (human) | Forward | 5'-ACGATGCACCTGTACGATCA-3' |
| Reverse | 5'-GGAGGTGGAGAGCTTTCAGT-3' | |
| Pparγ (human) | Forward | 5'-GACCACTCCCACTCCTTTGA-3' |
| Reverse | 5'-TCTGCAACCACTGGATCTGT-3' | |
| Acc1 (human) | Forward | 5'-ACGGCATCATTAACTGGGGA-3' |
| Reverse | 5'-TATCCACATCCGGGGCAATT-3' | |
| Glut4 (human) | Forward | 5'-CTGGCCATCATCATCTCCCT-3' |
| Reverse | 5'-GTGGACAGGGTGGTGAAGTA-3' | |
| Pparγ (mouse) | Forward | 5'-TCTTAACTGCCGGATCCACA-3' |
| Reverse | 5'-GCATTGTGAGACATCCCCAC-3' | |
| Scd1 (mouse) | Forward | 5'-CTTCCTCCTGAATACATCCCTCC-3' |
| Reverse | 5'- CTCCATCCCATCTAGCACAACCT -3' | |
| 18S (human) | Forward | 5'-AAACGGCTACCACATCCAAG -3' |
| Reverse | 5'- CCTCCAATGGATCCTCGTTA-3' |
Short hairpin (sh) RNA lentivirus and infection
The shRNA lentivirus used to target Aurora-A was obtained from GeneChem (Shanghai, China). FHC cells purchased from Qingqi (Shanghai, China) were infected with either shcontrol or shAurora-A lentivirus according to the manufacturer's instructions. After 24 hours, LY294002 purchased from Selleckchem (Houston, TX, USA) was added to the indicated wells for 6 hours, and the cells were subjected to immunoblotting.
Histologic analysis and Oil red O staining
Tissues were fixed in 4% formaldehyde and embedded in paraffin. Sections with a thickness of 4 µm were stained with hematoxylin-eosin (Beyotime Biotechnology, Nantong, Jiangsu, China).
Mouse liver tissues were fixed in 10% neutral formalin for 24 hours and then submerged in 20% sucrose for two days. The liver pieces were frozen in optimal cutting temperature (OCT) solution, and 5-µm-thick tissue sections were cut as previously described [1]. Oil red O staining was conducted according to the manufacturer's protocol.
Multiplexed immunofluorescence staining
Multiplexed staining and multispectral imaging were performed to identify the cell subsets expressing CD11b in WAT or CD3 in intestinal tissues using a PANO 4-Plex IHC Kit (cat 0004100020, Panovue, Beijing, China). Different primary antibodies were sequentially applied, and then horseradish peroxidase-conjugated secondary antibody incubation and tyramide signal amplification were performed. The slides were heated in a microwave after each TSA reaction. The nuclei were stained with 4'-6'-diamidino-2-phenylindole (DAPI, Sigma) after all the antigens had been labeled.
Immunoblotting
Immunoblotting was performed as previously described [16]. Anti-Aurora-A (D3E4Qz, #14475), anti-Acc 1 (#4190), anti-AKT (C67E7, #4691), anti-p-AKT (Ser473, #9271), and anti-PPARγ (C26H12, #2435) antibodies were purchased from Cell Signaling Technology (MA, USA). An anti-SLC7A5/LAT1 (#DF8065) antibody was purchased from Affinity. Anti-β-actin (66009-1-Ig), anti-GLUT4 (66846-1-lg), and anti-GAPDH (60004-1-lg) antibodies were purchased from Proteintech.
16S rRNA gene sequence analysis
Genomic DNA amplification and sequencing were performed as described in a previous study [17]. Briefly, total DNA was extracted from feces (n = 3-5/group) using an E.Z.N.A. Stool DNA Kit (Omega Biotek, Norcross, GA, U.S.) according to manufacturer's protocols.
PCR and custom primers were utilized to amplify the V4-V5 region of the 16S rRNA gene, and sequencing was performed on the Illumina MiSeq platform. 16S rRNA data were analyzed as previously described [17].
Measurement of fecal short-chain fatty acids (SCFAs)
GC-MS analysis of SCFAs in the feces was performed as previously described to assess SCFA composition [18].
Enzyme-linked immunosorbent assay (ELISA)
The concentration of IL-1β in the serum was measured using ELISA kits (R&D) according to the manufacturer's instructions. The concentration of IL-6 in the serum was analyzed using an ELISA kit (Jianglai, Shanghai, China) according to the manufacturer's instructions.
Statistical analysis
Differences were statistically analyzed using Student's t-test or one-way ANOVA followed by Bonferroni post-tests by PRISM statistical analysis software (GraphPad Software, San Diego, CA). The data are presented as the mean ± SEM. Significance is indicated as follows: *P < 0.05; n.s. for not significant.
Results
Aurka loss in the intestinal epithelium promoted obesity and enlargement of lipid droplets in male mice
Aurka-deficient mice exhibited a lethal phenotype. To investigate metabolic function, we generated mice with intestinal epithelium-specific Aurka deficiency by crossbreeding Aurkaf/f and VillinCre/+ mice to obtain Aurkaf/+;VillinCre/+ mice. Unexpectedly, when mice were maintained on a normal chow diet, Aurkaf/+;VillinCre/+ mice showed significantly greater body weight gain than Aurkaf/+ littermates starting at approximately 42 weeks of age (Figure 1A). The weight of subcutaneous fat pads relative to body weight was significantly increased in Aurkaf/+;VillinCre/+ mice (Figure 1B). Similarly, the percentage of epididymal fat pads was also increased in Aurkaf/+;VillinCre/+ mice compared to that in Aurkaf/+ littermates (Figures 1C and 1D). Additionally, as shown in Figures 1E and 1F, the area of white adipocytes in sections of the subcutaneous fat pad was larger in Aurkaf/+;VillinCre/+ mice than in Aurkaf/+ littermates.
Aurka loss in the intestine promoted obesity. (A) The body weights of Aurkaf/+ and Aurkaf/+;VillinCre/+ mice were monitored weekly from 2 weeks to 59 weeks (n=5). *, P < 0.05. (B) The percentage of subcutaneous fat and (C) epididymal fat pads compared to body weight. (D) Representative images of epididymal fat from Aurkaf/+ and Aurkaf/+;VillinCre/+ mice. (E) Representative photomicrographs of H&E-stained sections of WAT from Aurkaf/+ and Aurkaf/+;VillinCre/+ mice. (F) The cell area was measured with ImageJ (n = 4 mice per group). The graphs show the mean ± SEM of one of two independent experiments. (G) At the end of long-term weight monitoring, the livers of the mice were removed and weighed. The data are representative of experiments that included n = 5 livers per group. The results represent the mean ± SEM of liver weight. *, P < 0.05. (H) Liver weight relative to body weight. (I, J) Sections of the livers of Aurkaf/+ and Aurkaf/+;VillinCre/+ mice were stained by H&E and oil red O of (n = 4 mice per group). The pictures show one of three independent experiments. (K, L) Plasma AST and ALT levels were measured. The bar graphs show the mean ± SEM of one of two independent experiments (n = 4 mice per group). *, P < 0.05.
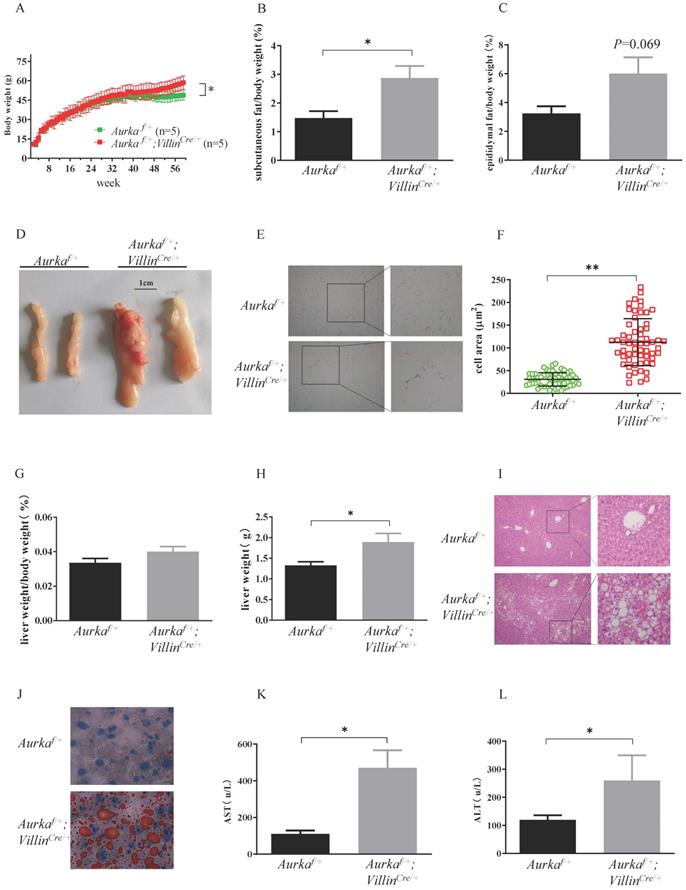
To further clarify the differences in adiposity, we examined liver weight and fat accumulation in the mouse liver, an organ involved in lipid metabolism [1]. Liver weight was increased in Aurkaf/+;VillinCre/+ mice compared with Aurkaf/+ littermates, although the relative size of the livers of Aurkaf/+;VillinCre/+ mice were not different from that of the livers of Aurkaf/+ mice after normalization to body weight (Figures 1G and 1H). Of note, the livers of 59-week-old Aurkaf/+;VillinCre/+ mice exhibited markedly higher lipid droplet accumulation compared than those of Aurkaf/+mice (Figures 1I and 1J). Additionally, the levels of aspartate aminotransferase (AST) and alanine aminotransferase (ALT) were both markedly higher in the serum of Aurkaf/+;VillinCre/+ mice than in that of Aurkaf/+mice (Figures 1K and 1L). These observations indicated that loss of Aurka in the intestinal epithelium promoted weight gain and enhanced lipid accumulation with age.
Aurka deficiency in the intestinal epithelium affected metabolism
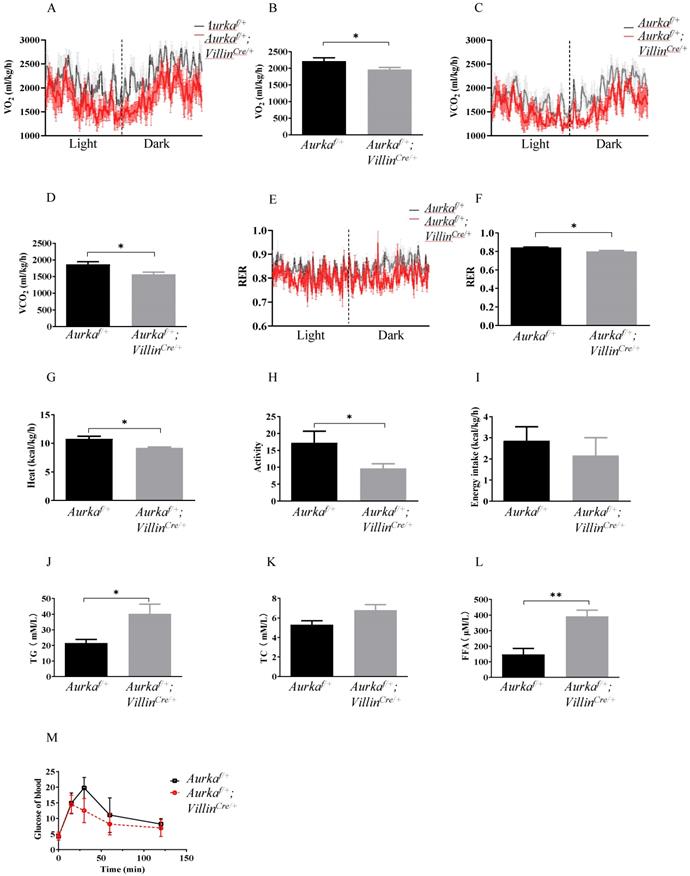
To investigate the underlying mechanisms by which Aurka loss in the intestinal epithelium induced obesity, we analyzed metabolic differences between Aurkaf/+;VillinCre/+ and Aurkaf/+ mice at 59 weeks of age using metabolic cages. The results showed that the Aurkaf/+;VillinCre/+ mice exhibited significant decreases in VO2, VCO2, and RER (Figures 2A-2F). The Aurkaf/+;VillinCre/+ mice also demonstrated a reduction in heat production (Figure 2G). Additionally, a decrease in activity was observed in Aurkaf/+;VillinCre/+ mice (Figure 2H). However, there was no significant difference in cumulative food intake between Aurkaf/+;VillinCre/+ and Aurkaf/+ mice (Figure 2I). Because obesity profoundly affects how triglycerides (TGs) are metabolized in the body [1], we compared serum TG levels between Aurkaf/+;VillinCre/+ and Aurkaf/+ mice. As we expected, there were significant increases in the serum TG levels but not TC levels (Figures 2J and 2K). We also noted an increase in total cholesterol and FFA levels in the sera of Aurkaf/+;VillinCre/+ mice (Figure 2L). Unexpectedly, there was a decreasing trend in glucose levels in Aurkaf/+;VillinCre/+ mice (Figure 2M), suggesting that Aurka loss in the intestinal epithelium could influence metabolism, thus contributing to obesity rather than glucose tolerance.
Metabolism changes were observed in Aurkaf/+;VillinCre/+ mice. (A, B, C, D) O2 consumption and CO2 production rates at 24 hours were measured via indirect calorimetry using CLAMS under normal chow feeding conditions. The average O2 consumption and CO2 production rates are shown on the right (n = 4 mice per group). *, P < 0.05. (E) The respiratory exchange ratio at 24 hours in Aurkaf/+ and Aurkaf/+;VillinCre/+ mice (n = 4 mice per group). *, P < 0.05. (F, G, H, I) Histogram showing the average RER, heat, activity, and food intake. The results represent the mean ± SEM (n = 4 mice per group). *, P < 0.05. (J, K, L, M) Plasma TG, TC, FFA, and blood glucose levels in Aurkaf/+ and Aurkaf/+;VillinCre/+ mice. The graphs show the mean ± SEM of one of two independent experiments. *, P < 0.05; **, P < 0.01.
Loss of Aurka induced lipid metabolism regulatory gene expression and increased the number of macrophages in WAT
Since lipogenesis, which occurs predominantly in the liver and adipose tissue, is the primary source of TGs in the liver, we assessed the expression of acetyl-coenzyme A carboxylase 1 (Acc1), one of the critical enzymes involved in promoting de novo lipogenesis [19]. We found higher Acc1 mRNA and protein expression in WAT, but not liver tissues, in Aurkaf/+;VillinCre/+ mice than in Aurkaf/+ mice (Figures 3A-3D). Moreover, the mRNA levels of Mcd, one of the genes involved in FAO [20], in WAT, but not liver tissues, were markedly higher in Aurkaf/+;VillinCre/+ mice than in Aurkaf/+ mice (Figures 3A and 3B).
Lipogenesis, in parallel with increased p-AKT expression, was observed in Aurkaf/+;VillinCre/+ mice. (A) mRNA levels of lipid metabolism-related genes and inflammatory cytokines were measured in WAT from Aurkaf/+;VillinCre/+ mice. *, P < 0.05. **, P <0.01. (B) mRNA levels of lipid metabolism-related genes in the liver. (A, B) The graphs show the mean ± SEM of one of three independent experiments (n=3 mice per group). (C, D) The levels of the indicated proteins were measured in both the WATs and livers of Aurkaf/+;VillinCre/+ mice. The pictures are representative one of two independent experiments (n=3 mice per group). (E) mRNA levels of inflammatory cytokines in WAT. The histogram shows the mean ± SEM of one of two independent experiments (n=3 mice per group). *, P < 0.05. (F) CD11b immunostaining of WAT from Aurkaf/+ and Aurkaf/+;VillinCre/+ mice. The pictures show one of three independent experiments.
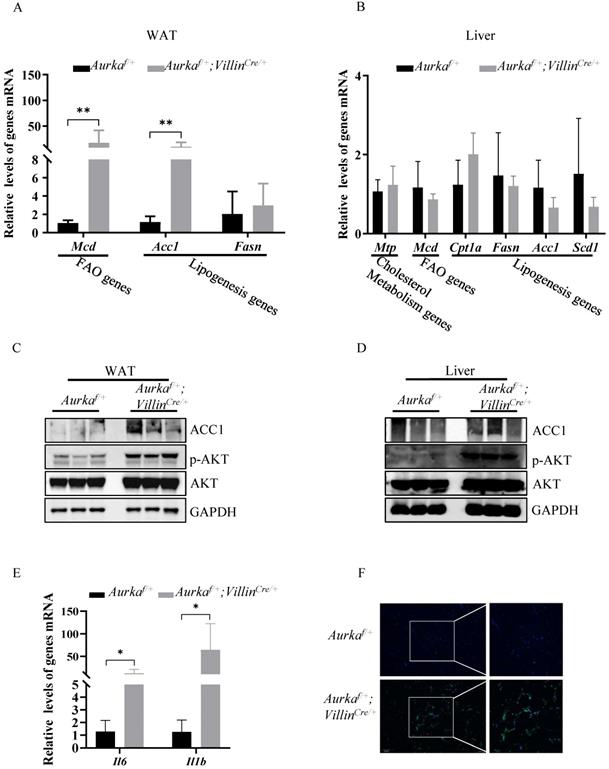
Previous studies have indicated that AKT activation plays a significant role in mediating lipid accumulation by indirectly regulating Acc1 expression [21, 22]. Therefore, we measured the levels of phosphorylated forms of AKT and found that the levels of p-AKT in WAT and liver tissues were markedly higher in Aurkaf/+;VillinCre/+ mice than in Aurkaf/+ mice but that the total amount of AKT protein was not different (Figures 3C and 3D).
A growing number of studies found that obesity is characterized by chronic and low-grade inflammation accompanied by an increase in the number of adipose tissue macrophages (ATMs), which play crucial roles in the altered production of several proinflammatory cytokines, such as IL-6 and IL-1β, in the adipose tissues of obese individuals [23-26]. The proinflammatory cytokines secreted from ATMs not only repress insulin action [24] but also play an important role in mediating Acc1 expression. Knockout of IL-6 results in decreased expression of Acc1 in mice fed normal chow [27]. In addition, IL-6 contributes to AKT activation [28, 29], which also promotes Acc1 expression [21, 22]. Therefore, we assessed the mRNA levels of proinflammatory cytokines as well as the percentage of ATMs in WAT. As expected, the mRNA levels of Il6 and Il1b were markedly elevated in WAT from Aurkaf/+;VillinCre/+ mice (Figure 3E). Additionally, infiltrated ATMs was dramatically higher in WAT from Aurkaf/+;VillinCre/+ mice than in that from Aurkaf/+ mice (Figure 3F). Together, these results indicated that Aurka loss could contribute to lipid accumulation in parallel with inflammation.
Aurka deficiency promoted nutrient absorption gene expression in the intestine
Obesity is generally considered the result of an imbalance between food intake, absorption, and energy expenditure, and in this study, no noticeable difference was observed in cumulative food intake between Aurkaf/+ mice and obese Aurkaf/+;VillinCre/+ mice. We next investigated whether Aurka loss could influence nutrient absorption by regulating genes critical for nutrient absorption in Aurkaf/+;VillinCre/+ mice. As shown in Figure 4A, the mRNA levels of the Slc2a4 gene-encoded glucose transporter protein GLUT4, which is critical for mediating glucose uptake and metabolism, were significantly increased in intestinal tissues from Aurkaf/+;VillinCre/+ mice. Additionally, the levels of solute carrier family 7 member 5 (SLC7A5, known as LAT1), which belongs to the APC superfamily and forms a heterodimeric amino acid transporter [30], were increased in Aurkaf/+;VillinCre/+ mice compared with Aurkaf/+ mice. There was a trend toward an increase in the mRNA levels of Slc2a2 and the excitatory amino acid transporter 3 (Eaat3) gene [31], which mediates the uptake of L-glutamate, L-aspartate, and D-aspartate in Aurkaf/+;VillinCre/+ mice. Moreover, the mRNA levels of Mtp, Scd1, and Acc1 were markedly increased in Aurkaf/+;VillinCre/+ mice (Figure 4A).
p-AKT promoted lipid metabolism and nutrient absorption in the intestine of Aurkaf/+;VillinCre/+ mice. (A, B) Lipid metabolism- and nutrient absorption-related mRNA and protein levels of were measured in the intestines of Aurkaf/+;VillinCre/+ mice. The graphs show the mean ± SEM of one of three independent experiments. (n=3 mice per group). *, P < 0.05. **, P <0.01. (C, D, E, F) The relative length and width of crypts and villi were measured by ImageJ software. The histogram shows the mean ± SEM. (G) The ratio of villi to crypt length in the intestine. (H, I) The concentrations of IL-6 and IL-1β in the serum were measured by ELISA. The bar graphs show the mean ± SEM of one of two independent experiments that included five groups of mice. *P <0.05. (J, K) H&E staining and CD3 immunostaining of the intestines of Aurkaf/+ and Aurkaf/+;VillinCre/+ mice. The quantitative data are shown on the right.
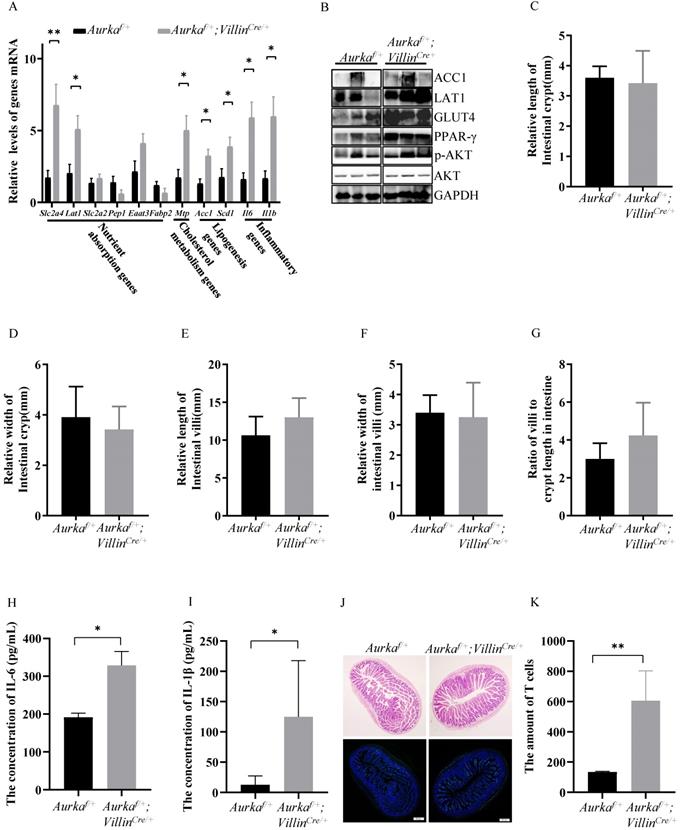
Consistently, the protein expression of GLUT4 and ACC1 was enhanced, and the level of p-AKT was increased (Figure 4B). The expression of peroxisome proliferator-activated receptor γ (PPARγ), a member of the PPAR family of nuclear receptors that regulates lipid metabolism and glucose homeostasis [32], was induced in intestinal tissues from Aurkaf/+;VillinCre/+ mice (Figure 4B). However, the relative length and width of the intestinal crypts, the relative height and width of intestinal villi, and the ratio of villi to crypt length were almost identical in Aurkaf/+;VillinCre/+ mice and Aurkaf/+ mice (Figures 4C-4G). These observations further demonstrated that obesity in Aurkaf/+;VillinCre/+ mice could result from the elevated expression of nutrient absorption-related genes.
Interestingly, Il6 and Il1b mRNA levels were dramatically increased in the intestinal tissues from Aurkaf/+;VillinCre/+ mice (Figure 4A). Consistently, the concentrations of IL-6 and IL-1β were obviously higher in the sera of Aurkaf/+;VillinCre/+ mice than in the sera of Aurkaf/+ mice (Figures 4H and 4I). Additionally, the number of CD3+ cells was markedly increased in Aurkaf/+;VillinCre/+ mice compared with Aurkaf/+ mice (Figures 4J and 4K), implicating that Aurka deficiency in the intestinal epithelium could promote inflammation.
Loss of Aurka in the intestinal epithelium induced gut microbiota dysbiosis in parallel with an increase in the levels of SCFAs
Recent studies showed that the gut microbiota improves energy extraction from the diet and modulates plasma levels of lipopolysaccharide (LPS), leading to chronic low-grade inflammation and contributing to obesity [33, 34]. We assessed the intestinal microbiota and found that at the phylum level, the abundance of Firmicutes and Proteobacteria was increased in Aurkaf/+;VillinCre/+ mice compared to Aurkaf/+ mice (Figures 5A and 5B). The relative abundance of Bacteroidetes was decreased in Aurkaf/+ mice (Figure 5B). The ratio of Firmicutes/Bacteroidetes was markedly increased (Figure 5C). We next compared the microbiota of Aurkaf/+ mice and Aurkaf/+;VillinCre/+ mice using linear discriminant analysis (LDA) effect size (LEfSe) analysis. We found that Aurka loss in the intestine increased the abundance of Firmicutes at the phylum level and the levels of lower taxa, such as Erysipelotrichia at the class level, Erysipelotrichales at the order level, Erysipelotrichaceae at the family level, and Erysipelotrichaceae incertae sedis at the genus level in the Aurkaf/+;VillinCre/+ mice (Figure 5D).
Aurka loss resulted in gut microbiota dysbiosis and elevated SCFA levels. (A) Composition of abundant bacterial phyla. The stacked graph shows the mean ± SEM. (B) Comparison of representative taxonomic abundance between Aurkaf/+ and Aurkaf/+;VillinCre/+ mice at the phylum level. The graphs show the mean ± SEM. *, P < 0.05. (C) The relative taxonomic abundance ratio of Firmicutes to Bacteroidetes (%). *, P < 0.05. (D) LDA effect size (LEfSe) analysis was utilized to compare the microbiota. the horizontal histogram shows the mean ± SEM. (E) Total SCFA production. **, P < 0.01. (F) Relative levels of the indicated SCFAs. (E, F) The results are presented as the mean ± SEM (n=3). *, P < 0.05.
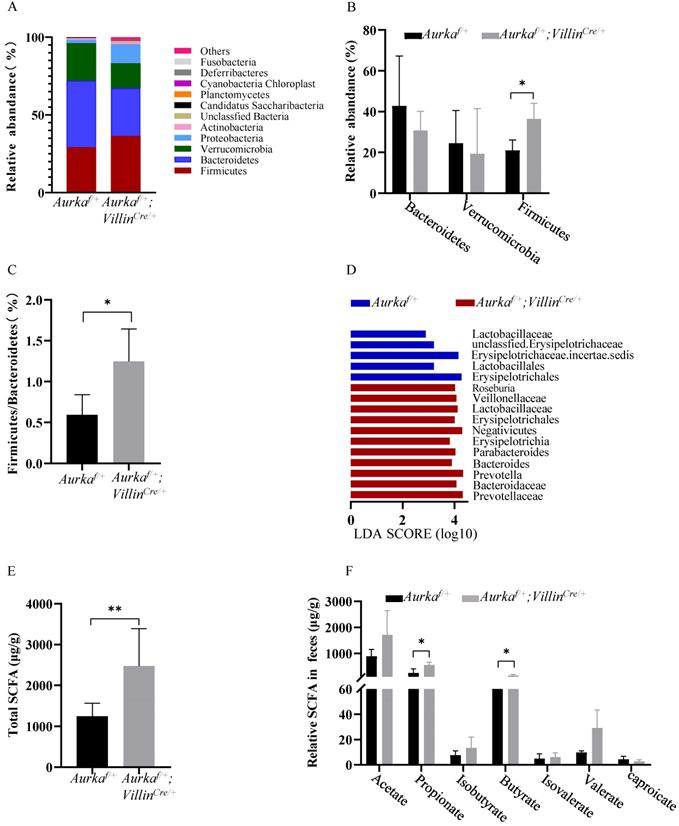
To evaluate whether the levels of SCFAs were increased in Aurkaf/+;VillinCre/+ mice compared to Aurkaf/+ mice, the fecal levels of SCFAs were measured. Higher levels of total SCFAs, propionate, and isobutyrate were observed in Aurkaf/+;VillinCre/+ mice than in Aurkaf/+ mice (Figures 5E and 5F). These results collectively suggested that Aurka deficiency in the intestine led to gut microbiota dysbiosis and an increase in the levels of SCFAs.
Aurka deficiency-mediated nutrient absorption-related gene transcription depended on SCFA-mediated AKT activation
Previous studies have shown that AKT is critical for the transcription of nutrient absorption-related genes, including Acc1 [21, 22]. Therefore, we treated the murine adipocyte cell line 3T3-L1 and the normal human colon epithelial cell line FHC with LY294002. Upon LY294002 treatment, the level of p-AKT was reduced in 3T3-L1 cells (Figure 6A). Acc1 and Lat1 mRNA levels were markedly decreased in 3T3-L1 cells treated with LY294002 (Figure 6B). Similarly, the levels of Il6 mRNA were also reduced in 3T3-L1 cells treated with LY294002 (Figure 6B). p-AKT expression was dramatically decreased after exposure of FHC cells to LY294002 (Figure 6C). The mRNA levels of Acc1, Glut4, and Lat1, but not Mtp, were markedly decreased in FHC cells treated with LY294002 (Figure 6D), suggesting that AKT activation was involved in mediating nutrient absorption-related gene transcription.
Propionate-induced activation of AKT. (A) The expression of the indicated proteins in 3T3-L1 cells was measured by western blot analysis. GAPDH expression is shown as a control. (B) Inhibition of the AKT signaling pathway and gene expression were assessed by real-time RT-PCR. The results represent the mean ± SEM of one of three independent experiments. *, P < 0.05. (C) The expression of the indicated proteins in FHC cells was measured by western blot analysis. GAPDH expression is shown as a control. (D) Gene expression was analyzed by real-time RT-PCR. The histogram shows the mean ± SEM of one of three independent experiments in FHC cells. *, P < 0.05, **, P < 0.01. (E) FHC cells were treated with acetate, propionate, or butyrate for 24 hours. The expression of the indicated proteins in these cells was measured by western blot analysis. GAPDH expression is shown as a control.
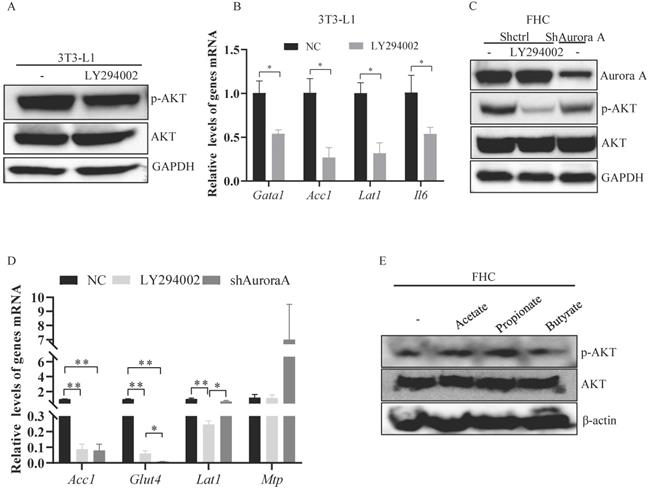
To investigate the mechanisms by which AKT was activated in Aurkaf/+;VillinCre/+ mice, we knocked down Aurora-A in FHC cells and found that the expression of p-AKT was decreased in FHC cells transfected with shRNA against Aurora-A compared FHC cells transfected with control shRNA (Figure 6C). Additionally, Acc1, Glut4, and Lat1 mRNA levels were significantly decreased in FHC cells transfected with shRNA against Aurora-A (Figure 6D). However, Mtp mRNA levels were markedly increased in FHC cells transfected with shAurora-A compared with FHC cells transfected with shcontrol (Figure 6D), indicating that AKT could be indirectly activated by Aurka loss. SCFAs are involved in mediating the activation of AKT [35]. Therefore, we treated FHC cells with the indicated SCFAs to explore whether SCFAs were critical for the activation of AKT in Aurkaf/+;VillinCre/+ mice. The levels of p-AKT were elevated after exposure of FHC cells to propionate (Figure 6E). These observations demonstrated that SCFA could mediate activated AKT in the intestine.
Discussion
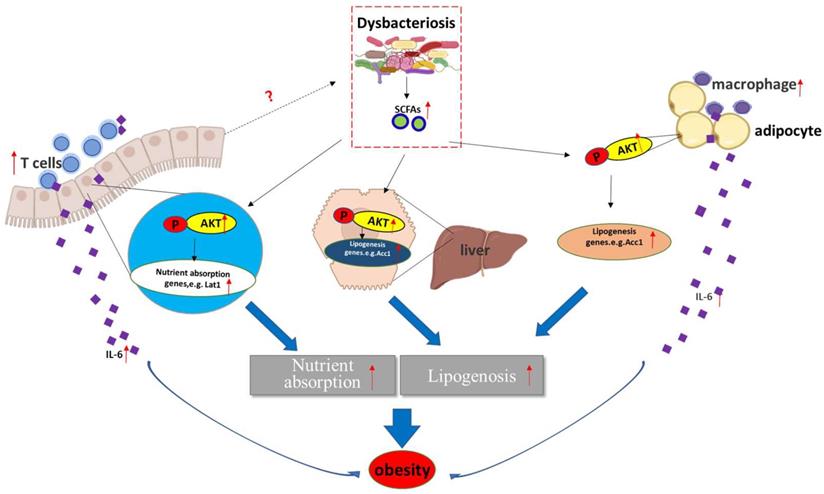
Obese and lean individuals respond differently to nutrients, exhibiting changes in digestion, absorption, and hormone release [8]. Additionally, intestinal maintenance and growth are driven by the number of luminal nutrients, with a high nutrient content resulting in increases in cell number, villus length, and crypt depth [8]. In this study, we unexpectedly found that deletion of Aurka in the intestinal epithelium promoted T cell infiltration without influencing villus length and crypt depth. Notably, Aurka loss in the intestinal epithelium increased the abundance of Firmicutes and Proteobacteria as well as the levels of SCFAs (Figure 5), which led to AKT activation, promotion of nutrient absorption and inflammatory gene expression, and subsequent development of obesity (Figure 7).
A hypothetical model by which Aurka loss promotes obesity. Aurka loss in the intestinal epithelium leads to gut microbiota dysbiosis and elevated SCFA levels, contributing to the activation of AKT, which in turn promotes nutrient absorption-related gene expression and inflammatory gene transcription, subsequently inducing the development of obesity.
It has been revealed that the gut microbiota enhances intestinal monosaccharide uptake, contributing to increased de novo lipogenesis and triglyceride accumulation [36, 37]. Additionally, by interacting with host epithelial cells, the gut microbiota indirectly regulates energy expenditure and storage [38]. A large number of studies suggested that the changes in the relative abundance of Bacteroidetes and Firmicutes are associated with a switch in the metabolic potential of the microbiota to extract energy from food [36, 39], which appears to enable Firmicutes, the “obese microbiota”, to harvest more energy from food. Consistent with a previous mouse study and analysis of the distal gut microbiota in human obesity [40], we found a shift in the gut microbiota shift (a decreased proportion of Bacteroidetes and an increased proportion of Firmicutes) in Aurkaf/+;VillinCre/+ mice in the present study (Figures 5A-5D). Unfortunately, how Aurka loss in the intestinal epithelium results in a shift in the gut microbiota remains unknown.
In addition to directly interacting with epithelial cells, the gut microbiota indirectly participates in cross-talk with distant organs such as liver and adipose tissue through metabolic products and SCFAs, and mediates obesity [41]. It has been shown that SCFAs bind with G-protein-coupled receptors expressed on adipocytes, leading to adipocyte formation [42]. Additionally, SCFAs also suppress the synthesis of the hunger-suppressing hormones leptin, peptide YY and glucagon-like peptide 1 [43]. Consistent with a recent study [35], propionate-induced activation of AKT was shown to be involved in regulating lipid accumulation by indirectly regulating Acc1 expression [17, 18] and nutrient absorption-related gene transcription in a human FHC cell line (Figure 6E). Consistently, the levels of Acc1 were increased in the WAT, liver and intestine (Figures 3C, 3D and 4B). Furthermore, the mRNA levels of nutrient absorption-related genes, including Slc2a4, Lat1, and Eaat3, were increased in Aurkaf/+;VillinCre/+ mice compared with Aurkaf/+ mice (Figure 4A). However, inhibition of AKT by LY294002 dramatically decreased the mRNA levels of these genes (Figure 6D). These observations suggested that loss of Aurka in the intestinal epithelium could promote obesity at least partially via SCFA-mediated AKT activation. In addition, gut microbiota dysbiosis resulted in inflammation, as indicated by the presence of ATMs and infiltrated CD3+ T cells in the WAT and intestine, respectively (Figures 3F and 4J), which led to increases in the mRNA levels and concentrations of proinflammatory cytokines such as IL-6 and IL-1β in the sera of Aurkaf/+;VillinCre/+ mice (Figures 3E, 4A, 4H and 4I). Previous studies have demonstrated that IL-6 also induces AKT activation [44]. This implies that activated AKT could also be mediated by upregulation of IL-6 expression in Aurkaf/+;VillinCre/+ mice.
Taken together, these data suggest that Aurka deficiency in the intestinal epithelium promoted age-induced obesity, resulting in gut microbiota dysbiosis and elevated SCFA levels and leading to AKT activation, which subsequently contributed to the upregulation of nutrient absorption-related gene expression.
Acknowledgements
We are grateful to Dr. Y. Kou for providing the mouse 3T3-L1 cells.
Authors Contributions
- Conception and design: J. Yang;
- Development of methodology: N. Sun and J. Yang;
- Acquisition of data (provided animals, acquired and managed patients, provided facilities, etc.): N. Sun, F. Meng, R. Li, X. Chen, Y. Kou, and J. Yang;
- Analysis and interpretation of data (statistical analysis and biostatistics): N. Sun, F. Meng, R. Li, X. Chen, X. Yang, and J. Yang;
- Writing, review, and revision of the manuscript: N. Sun, J. Yang and T. Ikezoe;
- Administrative, technical, or material support: N. Sun, F. Meng, J. Zhao, X. Li, R. Li, X. Chen, J. Han, W. Cheng, H. Hua, K. Zheng, and J. Yang;
- Study supervision: K. Zheng, J. Yang, and T. Ikezoe.
Financial Support
This study was supported by grants from Jiangsu Province Key Laboratory of Immunity and Metabolism (XZSYSKF2020016) to F.M., the Foundation for Key Program of Universities of Jiangsu Province (no. 17KJA320010), and Jiangsu Distinguished Professorship Program to J.Y.
Competing Interests
K.Y.Z. and J.Y. have filed a patent on Aurka CKO mice. The other authors report no conflicts.
References
1. Liu Y, Leslie PL, Jin A, Itahana K, Graves LM, Zhang Y. p32 heterozygosity protects against age- and diet-induced obesity by increasing energy expenditure. Scientific reports. 2017;7:5754
2. Hazlehurst JM, Woods C, Marjot T, Cobbold JF, Tomlinson JW. Non-alcoholic fatty liver disease and diabetes. Metabolism: clinical and experimental. 2016;65:1096-108
3. Bardou M, Barkun AN, Martel M. Obesity and colorectal cancer. Gut. 2013;62:933-47
4. Engin A. Obesity-associated Breast Cancer: Analysis of risk factors. Advances in experimental medicine and biology. 2017;960:571-606
5. Saltiel AR, Olefsky JM. Inflammatory mechanisms linking obesity and metabolic disease. The Journal of clinical investigation. 2017;127:1-4
6. Aggarwal BB. Targeting inflammation-induced obesity and metabolic diseases by curcumin and other nutraceuticals. Annual review of nutrition. 2010;30:173-99
7. Gregor MF, Hotamisligil GS. Inflammatory mechanisms in obesity. Annual review of immunology. 2011;29:415-45
8. Dailey MJ. Nutrient-induced intestinal adaption and its effect in obesity. Physiology & behavior. 2014;136:74-8
9. Li M, Gao K, Chu L, Zheng J, Yang J. The role of Aurora-A in cancer stem cells. The international journal of biochemistry & cell biology. 2018;98:89-92
10. Bertolin G, Sizaire F, Herbomel G, Reboutier D, Prigent C, Tramier M. A FRET biosensor reveals spatiotemporal activation and functions of aurora kinase A in living cells. Nature communications. 2016;7:12674
11. Mori D, Yamada M, Mimori-Kiyosue Y, Shirai Y, Suzuki A, Ohno S. et al. An essential role of the aPKC-Aurora A-NDEL1 pathway in neurite elongation by modulation of microtubule dynamics. Nature cell biology. 2009;11:1057-68
12. Zheng F, Yue C, Li G, He B, Cheng W, Wang X. et al. Nuclear AURKA acquires kinase-independent transactivating function to enhance breast cancer stem cell phenotype. Nature communications. 2016;7:10180
13. Bertolin G, Bulteau AL, Alves-Guerra MC, Burel A, Lavault MT, Gavard O. et al. Aurora kinase A localises to mitochondria to control organelle dynamics and energy production. eLife. 2018 7
14. Cho MK, An JM, Kim CH, Kang SG. Elevated aurora kinase a protein expression in diabetic skin tissue. Archives of plastic surgery. 2014;41:35-9
15. Madison BB, Dunbar L, Qiao XT, Braunstein K, Braunstein E, Gumucio DL. Cis elements of the villin gene control expression in restricted domains of the vertical (crypt) and horizontal (duodenum, cecum) axes of the intestine. The Journal of biological chemistry. 2002;277:33275-83
16. Han J, Jiang Z, Wang C, Chen X, Li R, Sun N. et al. Inhibition of Aurora-A Promotes CD8(+) T-Cell Infiltration by Mediating IL10 Production in Cancer Cells. Molecular cancer research: MCR. 2020;18:1589-602
17. Shi H, Yu Y, Lin D, Zheng P, Zhang P, Hu M. et al. beta-glucan attenuates cognitive impairment via the gut-brain axis in diet-induced obese mice. Microbiome. 2020;8:143
18. Han LD, Xia JF, Liang QL, Wang Y, Wang YM, Hu P. et al. Plasma esterified and non-esterified fatty acids metabolic profiling using gas chromatography-mass spectrometry and its application in the study of diabetic mellitus and diabetic nephropathy. Analytica chimica acta. 2011;689:85-91
19. Veprik A, Bakar RB, Vetterli L, Ramracheya R, Rorsman P, Gribble F. et al. Acetyl-CoA-Carboxylase 1 (ACC1) plays a critical role in glucagon and GLP1 secretion and controls whole body glucose homeostasis. Diabetologia. 2019;62:S231-S2
20. Liu Y, Leslie PL, Jin A, Itahana K, Graves LM, Zhang Y. p32 regulates ER stress and lipid homeostasis by down-regulating GCS1 expression. Faseb Journal. 2018;32:3892-902
21. Li J, Huang Q, Long X, Zhang J, Huang X, Aa J. et al. CD147 reprograms fatty acid metabolism in hepatocellular carcinoma cells through Akt/mTOR/SREBP1c and P38/PPARalpha pathways. Journal of hepatology. 2015;63:1378-89
22. Liao X, Song L, Zhang L, Wang H, Tong Q, Xu J. et al. LAMP3 regulates hepatic lipid metabolism through activating PI3K/Akt pathway. Molecular and cellular endocrinology. 2018;470:160-7
23. Wellen KE, Hotamisligil GS. Inflammation, stress, and diabetes. The Journal of clinical investigation. 2005;115:1111-9
24. Olefsky JM, Glass CK. Macrophages, inflammation, and insulin resistance. Annual review of physiology. 2010;72:219-46
25. Donath MY, Shoelson SE. Type 2 diabetes as an inflammatory disease. Nature reviews Immunology. 2011;11:98-107
26. Choe SS, Shin KC, Ka S, Lee YK, Chun JS, Kim JB. Macrophage HIF-2alpha ameliorates adipose tissue inflammation and insulin resistance in obesity. Diabetes. 2014;63:3359-71
27. Knudsen JG, Joensen E, Bertholdt L, Jessen H, van Hauen L, Hidalgo J. et al. Skeletal muscle IL-6 and regulation of liver metabolism during high-fat diet and exercise training. Physiological reports. 2016 4
28. Jin X, Zimmers TA, Zhang Z, Pierce RH, Koniaris LG. Interleukin-6 is an important in vivo inhibitor of intestinal epithelial cell death in mice. Gut. 2010;59:186-96
29. Nishikai-Yan Shen T, Kanazawa S, Kado M, Okada K, Luo L, Hayashi A. et al. Interleukin-6 stimulates Akt and p38 MAPK phosphorylation and fibroblast migration in non-diabetic but not diabetic mice. PloS one. 2017;12:e0178232
30. Sayama S, Song A, Brown BC, Couturier J, Cai X, Xu P. et al. Maternal erythrocyte ENT1-mediated AMPK activation counteracts placental hypoxia and supports fetal growth. JCI insight. 2020 5
31. Lee SN, Li L, Zuo Z. Glutamate transporter type 3 knockout mice have a decreased isoflurane requirement to induce loss of righting reflex. Neuroscience. 2010;171:788-93
32. Schubert M, Becher S, Wallert M, Maess MB, Abhari M, Rennert K. et al. The Peroxisome Proliferator-Activated Receptor (PPAR)-gamma Antagonist 2-Chloro-5-Nitro-N-Phenylbenzamide (GW9662) Triggers Perilipin 2 Expression via PPARdelta and Induces Lipogenesis and Triglyceride Accumulation in Human THP-1 Macrophages. Molecular pharmacology. 2020;97:212-25
33. Saad MJ, Santos A, Prada PO. Linking Gut Microbiota and Inflammation to Obesity and Insulin Resistance. Physiology (Bethesda). 2016;31:283-93
34. Nagata N, Xu L, Kohno S, Ushida Y, Aoki Y, Umeda R. et al. Glucoraphanin Ameliorates Obesity and Insulin Resistance Through Adipose Tissue Browning and Reduction of Metabolic Endotoxemia in Mice. Diabetes. 2017;66:1222-36
35. Abdelli LS, Samsam A, Naser SA. Propionic Acid Induces Gliosis and Neuro-inflammation through Modulation of PTEN/AKT Pathway in Autism Spectrum Disorder. Scientific reports. 2019;9:8824
36. Tilg H, Kaser A. Gut microbiome, obesity, and metabolic dysfunction. The Journal of clinical investigation. 2011;121:2126-32
37. Flint HJ, Bayer EA, Rincon MT, Lamed R, White BA. Polysaccharide utilization by gut bacteria: potential for new insights from genomic analysis. Nature reviews Microbiology. 2008;6:121-31
38. Backhed F, Ding H, Wang T, Hooper LV, Koh GY, Nagy A. et al. The gut microbiota as an environmental factor that regulates fat storage. Proceedings of the National Academy of Sciences of the United States of America. 2004;101:15718-23
39. Turnbaugh PJ, Ley RE, Mahowald MA, Magrini V, Mardis ER, Gordon JI. An obesity-associated gut microbiome with increased capacity for energy harvest. Nature. 2006;444:1027-31
40. Ley RE, Turnbaugh PJ, Klein S, Gordon JI. Microbial ecology: human gut microbes associated with obesity. Nature. 2006;444:1022-3
41. Mitev K, Taleski V. Association between the Gut Microbiota and Obesity. Open access Macedonian journal of medical sciences. 2019;7:2050-6
42. Kimura I, Ozawa K, Inoue D, Imamura T, Kimura K, Maeda T. et al. The gut microbiota suppresses insulin-mediated fat accumulation via the short-chain fatty acid receptor GPR43. Nature communications. 2013;4:1829
43. Tseng CH, Wu CY. The gut microbiome in obesity. Journal of the Formosan Medical Association = Taiwan yi zhi. 2019;118(Suppl 1):S3-S9
44. Wegiel B, Bjartell A, Culig Z, Persson JL. Interleukin-6 activates PI3K/Akt pathway and regulates cyclin A1 to promote prostate cancer cell survival. International journal of cancer. 2008;122:1521-9
Author contact
![]() Corresponding authors: Jiangsu Province Key Laboratory of Immunity and Metabolism, Department of Pathogenic Biology and Immunology, Xuzhou Medical University, 209 Tongshan Road, Xuzhou, Jiangsu, China. Kuiyang Zheng, E-mail: kyzhengedu.cn; Jing Yang, E-mail: jingyangedu.cn.
Corresponding authors: Jiangsu Province Key Laboratory of Immunity and Metabolism, Department of Pathogenic Biology and Immunology, Xuzhou Medical University, 209 Tongshan Road, Xuzhou, Jiangsu, China. Kuiyang Zheng, E-mail: kyzhengedu.cn; Jing Yang, E-mail: jingyangedu.cn.