Impact Factor ISSN: 1449-2288
- Issue 12; 2026
- Issue 11; 2026
- Issue 10; 2026
- Issue 9; 2026
- Issue 8; 2026
- Volume 22; 2026
- Past Issues
- Advance Articles
- Editorial Board
- Cover Images
- Index & Coverage
- Cover Suggestion
- Special Issues
Introduction
Materials and Methods
Results
Discussion
Supplementary Material
Acknowledgements
References

 Global reach, higher impact
Int J Biol Sci 2025; 21(6):2780-2805. doi:10.7150/ijbs.102675 This issue Cite
Research Paper
Macrophage KDM2A promotes atherosclerosis via regulating FYN and inducing inflammatory response
Yuzhou Xue, PhD1,2, Yuce Peng, MD2, Ling Jin, PhD1, Lin Liu, MD3, Qian Liu, MD4, Xiaofan Yuan, PhD5, Jingyu Wang, PhD6, Mingming Zhao, PhD1, Wenming Zhang, MD1, Suxin Luo, PhD2, Yuanjing Li, PhD2 ![]() , Minghao Luo, PhD2
, Minghao Luo, PhD2 ![]() , Longxiang Huang, MD2
, Longxiang Huang, MD2 ![]()
1. Department of Cardiology and Institute of Vascular Medicine, NHC Key Laboratory of Cardiovascular Molecular Biology and Regulatory Peptides, State Key Laboratory of Vascular Homeostasis and Remodeling, Peking University Third Hospital, Beijing, China.
2. Department of Cardiovascular Medicine, Cardiovascular Research Center, The First Affiliated Hospital of Chongqing Medical University, Chongqing, China.
3. Department of Dermatology, Beijing Hospital, National Center of Gerontology, Institute of Geriatric Medicine, Chinese Academy of Medical Sciences & Peking Union Medical College, Beijing, China.
4. College of Laboratory Medicine, Chongqing Medical University, Chongqing, China.
5. General Practice, Sichuan Provincial People's Hospital, School of Medicine, University of Electronic Science and Technology of China, Chengdu, China.
6. Renal Division, Peking University First Hospital, Beijing, China.
Yuzhou Xue, Yuce Peng, and Ling Jin contributed equally in this paper.
Received 2024-8-22; Accepted 2025-3-20; Published 2025-3-31
Abstract

Macrophage inflammatory response is the key driver in atherosclerosis development. However, transcriptional remodeling of macrophage inflammatory response remains largely unknown. In this study, transcriptional regulatory networks were constructed from human plaque microarray datasets. Differential analysis and subsequent machine learning algorithms were used to identify key transcriptional regulons. Multiple immune cell inference methods (including CIBERSORT, ssGSEA, MCP-counter, and xCell), single-cell RNA-seq of human plaques and immunofluorescence of human and mouse plaque samples reveal that the macrophage-specific transcriptional regulator, KDM2A, is critical for inflammatory response. Diagnostic analyses validate KDM2A expression in peripheral monocytes/macrophages is an excellent predictor of atherosclerosis development and progression. RNA-seq of mouse bone marrow-derived macrophages under oxidized low-density lipoprotein stimulation reveal KDM2A knockdown significantly represses pro-inflammatory, oxidative, and lipid uptake pathways. In vitro experiments confirmed KDM2A activates inflammation, oxidative stress and lipid accumulation in macrophages. Mechanistically, FYN was identified as a direct target of KDM2A by chromatin immunoprecipitation followed by sequencing and qPCR analysis. Specific inhibition of FYN restored the inflammatory response, oxidative stress, and intracellular lipid accumulation after transfection with KDM2A overexpression plasmid. Importantly, macrophage-specific knockdown of KDM2A in ApoE-/- mice fed a high-fat diet apparently attenuated plaque progression. Furthermore, the genetic association of KDM2A with atherosclerosis was validated by Mendelian randomization and colocalization analysis. A group of small molecules with the potential to target KDM2A has been identified through virtual screening, offering promising strategies for atherosclerosis treatment. The current study provides the novel role of KDM2A in macrophage inflammatory response of atherosclerosis through transcriptional regulation of FYN.
Keywords: Atherosclerosis, KDM2A, macrophage, oxidative stress, inflammatory response, FYN, Metabolism reprograming.
Introduction
Atherosclerosis is the leading cause of cardiovascular disease, and its complications, including myocardial infarction and stroke, are the first and fifth causes of death from this disease, respectively [1]. During atherogenesis, a variety of cell types, including monocytes/macrophages, vascular smooth muscle cells (VSMCs), and endothelial cells (ECs), undergo fate conversion to multipotential cells that can adopt plaque-destabilizing (inflammation, calcification) or plaque-stabilizing (collagen deposition, resident-like) cell states [2-4]. The imbalanced or dysregulated phenotypic transformation of cells is the prerequisite for atherogenesis. For example, macrophage inflammation and subsequent foamy cell formation are the major driver of atherosclerosis development [5-7]. Macrophages in the subendothelial space undergo phenotypic alterations upon oxidized low-density lipoprotein (ox-LDL) uptake, leading to lipid dysregulation and thereafter cytokines release [8]. With the development of single-cell multi-omics technology, more specific characteristics of different macrophage phenotypes have been delineated, including inflammatory, resident-like, foamy/TREM2, IFNIC, and cavity macrophages [9-11]. Accordingly, the emerging role of transcriptional remodeling in modulation of cell phenotype has attracted attention [12].
In the work of Samuel and his colleagues, approximately 1,600 human transcriptional factors (TFs) were systematically summarized and defined according to the presence of a DNA binding domain or literature information (because of the broader connotation, hereafter referred to as transcriptional regulators) [13]. Recently, several studies have suggested that newly identified transcriptional regulators (TRs) (such as NFATc3, ARID3A, CREB, and etc.) play an increasingly important role in macrophage activation and the development of atherosclerosis [14-16]. However, no study to date has systematically shown how TRs and their potential interactions induce the development of atherosclerosis and potential phenotypic transition of macrophage. Here, we applied a novel pipeline to unbiased screening key TRs that play a critical role in the development of atherosclerosis. And, lysine demethylase 2A (KDM2A) was identified as a key TR that specifically induces macrophage inflammatory response and atherosclerosis development through high-throughput data and in vivo experiments.
KDM2A has been reported to demethylate the di-methylated H3K36 residue to transcriptionally regulate gene expression [17]. Previous studies have shown that KDM2A is associated with tumorigenesis, progression, poor prognosis of various cancers (esophageal squamous cell carcinoma, lung cancer, breast cancer, etc.), and obesity [18-22]. In Longmin's work, they found that loss of Kdm2a promotes Pparg transcription by inhibiting its H3K36me2 demethylation, thereby protecting against from high fat diet-induced obesity.[18] In addition, KDM2A can promote the de-clustering of alternative telomere elongation to sustain the replicative immortality of tumor cells [23]. A recent study revealed that KDM2A paralog specifically interacts with nucleosome acidic patch and facilitates dynamic nucleosomal DNA unwrapping and histone charge shielding that induce the H3K36 sequence for demethylation in tumor cells [24]. Although, these studies suggest that KDM2A is an important TR, no study has revealed a potential association of KDM2A in cardiovascular disease.
In this study, we screened KDM2A as a novel key TR playing critical roles in the development of atherosclerosis. It specifically regulates macrophage inflammatory response (inflammation, oxidative stress, apoptosis, and lipid accumulation) through directly transcriptional activation of FYN.
Materials and Methods
Experimental design
The objectives were accomplished in four steps: i) analysis and validation of the master transcriptional regulons based on transcriptome datasets from patients with atherosclerosis, ii) identification the role of the de novo regulon KDM2A in phenotypic alterations of macrophages, iii) follow-up in vitro experiments on KDM2A and its target FYN in macrophage inflammatory response, iv) validation of the atherogenic role of macrophage KDM2A by in vivo experiments.
Data collection
Four independent transcriptome datasets (GSE43292, GSE40231, GSE21545, and GSE28829) comprising 299 patient-derived arterial samples were obtained from the Gene Expression Omnibus (GEO) database (detail information shown in Supplementary table 1). First, the samples were preprocessed using the affy and affyPLM packages prior to analysis [25]. Briefly, probe-set summaries were calculated from the raw data (CEL files) through probe-level robust regressions and then normalized using the robust multiarray averaging (RMA) algorithm. Accounting for the same platform of GSE40231, GSE21545, and GSE28829 (a total of 235 samples), we integrated these three datasets as we previously described (called combine dataset) [26]. Then, GSE43292 for uncovering regulons and the combine dataset for validation were used in the key regulon identification analysis. Utilizing the plaque classification data (early and advanced atherosclerotic plaques) available in GSE28829, we further analyzed the expression of KDM2A to investigate its involvement in atherosclerosis progression.
The microarray expression datasets (GSE90074 and GSE56045) with corresponding clinical information were also been downloaded from the GEO database for clinical significance analysis. GSE90074 include peripheral mononuclear samples from 143 subjects with coronary artery disease (CAD) classification information, while GSE56045 included 1202 peripheral monocyte/macrophage (CD14+) samples from participants in the Multi-Ethnic Study of Atherosclerosis (MESA). In addition, Genotype-Tissue Expression (GTEx) was used for correlation analysis of KDM2A and its potential targets among different organs.
Patient sample collection
Carotid artery samples were obtained from patients who were certified for carotid endarterectomy (CEA) certification and underwent surgery at the First Affiliated Hospital of Chongqing Medical University; sampling was approved by the patient and the Ethics Committee of the First Affiliated Hospital of Chongqing Medical University (approval number 2021-689) in strict accordance with the Declaration of Helsinki on Biomedical Research Involving Human Subjects.
Blood samples were consecutively collected from patients with stable CAD who undergoing percutaneous coronary intervention at the First Affiliated Hospital of Chongqing Medical University upon admission (ethics approval no. 2019-148). Peripheral blood mononuclear cells (PBMCs) were isolated via gradient centrifugation using Ficoll-Paque PLUS density gradient media (Cytiva, 17144002). A total of 10 patients were enrolled to validate the upregulation of KDM2A, p-FYN/FYN, and associated pathways in the severe CAD group, classified based on the Gensini score as previously described [27]. The TNF-α, IL-6, and HMGB concentration in the patients' serum using ELISA kits (Beyotime, Shanghai, China) as per the manufacturer's instructions. All patients had provided informed consent in our study.
Master regulon identification
The master TRs and their regulated target genes (named as regulons) were screened using a transcriptional regulatory network construction method [28]. A total of 1639 proteins identified as TRs based on their DNA-binding specificities and the regulatory effect on transcription were included to infer the transcriptional regulatory networks based on Samuel's work [13].
Using the preprocessed data, transcriptional regulatory regulons were generated and their activity assessed for further selection by RTN package. In brief, the mutual information of candidate TRs with all potential target genes was analyzed, and the non-significant and unstable associations were excluded by permutation analysis and bootstrapping. The networks were then pruned by ARACNe algorithm. Two-tailed gene set enrichment analysis (GSEA-2T) was used to test for positive or negative association with atherosclerosis.
Based on the activities of transcriptional networks, we performed differential analysis to find significantly altered regulons (P adj < 0.05 and |Fold change| > 2) by limma package [29]. Then, two different techniques for feature selection were employed to identify candidate master regulons: Least Absolute Shrinkage and Selection Operator (LASSO) and Support Vector Machine Recursive Feature Elimination (SVM-RFE). The LASSO is a regularization method used in linear regression that shrinks the coefficient estimates towards zero, and the minimum criteria with 10-fold cross-validation were chosen for regulon selection by the glmnet package. SVM-RFE trains a subset of features to reduce the feature set and identify the most predictive features. The set of features with minimum 10-fold cross-validation errors were picked up by the e1071 package [30]. The intersections by LASSO and SVM-RFE were recognized as potential master regulons and the difference in activity of these candidate regulons was examined in the combine dataset.
To assess the clinical significance of the potential regulons, we also performed correlation and regression analysis of potential TRs with CAD severity in GSE90074, which includes the demographic (age, sex, diabetes, hypertension, and hyperlipidemia) and pathological information (degrees of coronary artery stenosis from a geriatric cohort (phase 2 of the Supporting a Multi-disciplinary Approach to Researching Atherosclerosis study). The standards used to quantify the severity of CAD (0 to 4, with 0-1 defined as non-obstructive and ≥2 defined as obstructive) were consistent with corresponding publication [31]. For the ROC analysis, we used the roc function from the pROC package (v1.18.5) and plotted the ROC curves using ggplot2. For regression analysis, we used the glm function from the stats package (v4.4.1). Correlation analyses were also performed in GSE56045 to validate the significant association of target TRs expression in monocytes/macrophages with coronary artery calcification (CAC, Agatston score) and carotid plaque score [32]. In addition, the corresponding methylome data (GSE56046) were also obtained to investigate potential correlation between TR and the CpG sites of its targets.
Functional enrichment and immune cells infiltration
GSEA was carried out to identify potentially involved pathways according to the correlation coefficients of genes with assigned regulons. GSEA was performed against multiple ontologies, namely Gene ontology (GO) terms (including molecular function, cellular component, and biological process), Kyoto Encyclopedia of Genes and Genomes (KEGG), and reference HALLMARK reference gene sets from the MSigDB database [33].
Single sample GSEA (ssGSEA) was developed to measure the proportions of 28 immune cell types. And the relative abundance of each cell type was normalized from 0 to 1 enrichment score [34]. CIBERSORT can deconvolute the gene expression profile into relative percentages of 22 distinct leukocyte subsets [34]. Furthermore, the Microenvironment Cell Population-counter (MCP-counter) (can quantify the absolute abundance of 8 immune and 2 stromal cell populations) and the xCell algorithm (can infer 64 immune and stromal cell types) were used to validate the immune infiltration analysis [35, 36]. We systematically evaluated the immune cell abundances between normal and atherosclerotic arterial samples and their correlations with regulon activities. The consistency of associations between a leukocyte type and an assigned regulon was examined among different algorithms and independent datasets.
scRNA-seq processing
Single-cell RNA-sequencing (scRNA-seq) (10X Genomics, GSE159677) of the proximal adjacent (PA) and atherosclerotic core (AC) portions of plaques from 3 patients was downloaded from the GEO database (Supplementary table 1) [37]. And, the details of scRNA-seq data preprocessing, sample integration, cell type annotation, sub-clustering analysis, and TR activity inference were described in our previous study [38].
Pseudotime trajectory analysis was then conducted in macrophage clusters to identify different cell states and branches by monocle v2.16.0 R package. Genes defining the trajectory were selected based on VariableFeatures function after SCTransform. And dimensional reduction was carried out using DDRTree method with max components as 2. Cells expressing resident specific markers such as FOLR2, F13A1, and GAS6 were recognized as the root, as we hypothesized that atherosclerosis is an inflammation-driven disease. Genes significantly associated with the first branch point (q value < 10-4) were clustered through plot_genes_branched_heatmap function (num_clusters = 3). Gene clusters upregulated in different cell states (state 2 and 3) were functionally mapped (KEGG annotation). KDM2A activity was evaluated in these three different macrophage subtypes and states. And the correlation between KDM2A activity and pseudotime was fitted by regression model using ggscatterstats function of ggstatsplot package (v0.12.0).
In addition to 10X scRNA-seq dataset, GSE260657 based on SmartSeq2 (~8000 genes/cell) from 7690 single cells isolated from humans with asymptomatic (n=7) and symptomatic (n=8) carotid plaques were enrolled for validation (Supplementary table 1). Cells with a total RNA count ≤ 50,000 or ≥ 750,000, highly relative mitochondrial or ERCC gene content (≥10%), and genes expressed in ≤ 3 cells or with a total read count < 300 were excluded according to corresponding study [39]. Using the RunHarmony function of Harmony package (v1.2.1), we integrated different samples based on patient_ID and performed SCT normalization before conducting t-SNE clustering. Cell types were annotated based on the highly expressed genes in each cluster. Cells identified as Myeloid cells were enrolled for the second round of integration, normalization, and dimensionality reduction analysis.
KDM2A genetic validation
Arterial tissue-specific cis-expression quantitative trait loci (cis-eQTL) of KDM2A were integrated from the GTEx project (v8; https://gtexportal.org/home/), and those eQTLs with statistical significance (P < 1×10⁻⁵) were included in the subsequent analysis. Genome-Wide Association Study (GWAS) data for atherosclerosis were obtained from UK Biobank (discovery cohort) and FinnGen (validation cohort) [5, 40]. Details for the study population, description, ancestry, and genotyping have been described elsewhere (http://www.nealelab.is/uk-biobank; https://r10.finngen.fi/). For drug target Mendelian randomization (MR), cis-eQTLs with a linkage disequilibrium threshold of r2 < 0.1 were selected as instrumental variants. The TwoSampleMR (v0.6.0) package was used to identify the potential casual effect of KDM2A on atherosclerosis [41]. The inverse-variance weighted (IVW) method with fixed- and random-effects model was calculated to obtain the MR effects estimates. The heterogeneity of the genetic instruments was assessed using the Q statistic. Additional analyses were performed, including simple mode, weighted mode, weighted median, and MR-Egger to account for horizontal pleiotropy. Colocalization analysis was performed using the "coloc" package [42]. The colocalization analysis included five hypotheses and the posterior probability of H4 (PPH4) >0.5 was considered as supporting evidence for colocalization [43]. The "LocusCompareR" package was used to visualize the colocalization region. In addition, the CVDKP platform was used to explore the potential association between KDM2A and cardiovascular and metabolic diseases (https://cvd.hugeamp.org/) [44].
Virtual screening
The 3D structure of the human KDM2A protein (PDB ID: 4BBQ) was obtained from the Protein Data Bank (PDB, http://www.rcsb.org/pdb). Water and solvent molecules were removed, and hydrogen atoms as well as Gasteiger charges were added. Rotatable bonds were defined using AutoDock Tools. The grid box was configured with center coordinates (center_x: 5.04, center_y: 20.05, center_z: 65.16) and box size (size_x: 46, size_y: 46, size_z: 46) to encompass the whole protein. A Bioactive Compound Library (n=21321) (Library from medchemexpress company, https://www.medchemexpress.cn/screening/bioactive-compound-library-max.html) was screened using AutoDock Vina. Structural representations were generated using PyMOL software.
Cell isolation and culture
Bone marrow-derived macrophages (BMDMs) were obtained as previously described [38]. Briefly, after mice were anesthetized with ketamine (50 mg/kg-1) and xylazine (5 mg/kg-1), the skin was removed from abdomen and leg of the mice, the legs were separated at the hip joint, the muscles were dissected with a scalpel, and the tibia and femur were removed. The bone marrow of the tibia and femur was rinsed with PBS to collect macrophages. After lysing red blood cells with ammonium chloride-potassium lysing buffer, the cells were cultured in high-glucose DMEM medium containing 10% fetal bovine serum, 1% penicillin/streptomycin and macrophage-colony stimulating factor (M-CSF, 20 ng/mL, #576404, BioLegend). On days 4 and 6 of differentiation, the medium was supplemented with fresh medium containing 20 ng/mL M-CSF, adherent cells were considered as BMDMs. Human umbilical vein endothelial cells (HUVECs) were donated by the Department of Cardiothoracic Surgery, the First affiliated hospital of Chongqing Medical University. HUVECs were cultured in endothelial cell medium (Cat#1001, Sciencell, CA, USA), and three to five generations of HUVECs were used for experiments. The method of obtaining VSMCs is also described in previous studies [38]. Briefly, the aorta was separated and the surrounding adipose tissue and adventitial tissue were removed. The mouse aortas were cut into small pieces, digested in DMEM containing type I collagenase for 12 hours, and free VSMCs cells were obtained, centrifuged at 3000 rpm for 5 minutes, and the precipitates were resuspended in DMEM medium containing 10% fetal bovine serum (FBS), and three to five generations of VSMCs were used for the experiment. Original RAW264.7 (mouse macrophage cell line) was purchased from Servicebio (Wuhan, China) and cultured in DMEM medium containing 10% FBS. Cells were treated with 20 μg/mL ox-LDL (Yiyuan Biotechnology, Guangzhou, China) for 24 hours for further in vitro experiments. AZD0530 (MedChemExpress, USA) was applied to BMDMs at 10μM.
Plasmid transfection and RNA interference
BMDMs were transfected with specific small interfering RNA (siRNA) and plasmid. SiRNA of targeting Kdm2a (Si-KDM2A) and overexpression plasmid (OE-KDM2A) were designed through Suzhou Genepharma company in China. BMDMs were transiently transfected with siRNA oligonucleotides using transfection reagent (#AD600150, Zeta Life, USA) according to the manufacturer's protocol. And Invitrogen® LipofectamineTM 3000 reagent was used to transfect plasmid according to the manufacturer's instructions. The siRNA KDM2A primer sequence is 5′-CCCGACGCAUGAACAAUAATT-3′. ox-LDL and AZD0530 were added after the transfected cells were cultured for 24 hours. Briefly, siRNA transfection or plasmid transfection was performed when the cell density reached 70%. SiRNAs or plasmids and transfection reagent were diluted with Opti-MEMTM medium (Cat# 31985070, Gibco, Thermo Fisher Scientific, USA) in tubes A and B, respectively. The liquids in tubes A and B were then mixed in equal proportions, and the mixture was incubated at room temperature for 15 minutes. The mixture was then added to the cell culture medium to initiate transfection and the medium was replaced with the fresh medium 6 hours later. Technical details can be found in our previous study [26].
RNA-seq
BMDMs treated with ox-LDL for 24 hours under si-NC or si-KDM2A condition (5 vs 5) were collected for deep RNA-seq analysis (BGI Genomics, Shenzhen, China). The prepared mRNA libraries were sequenced on DNBseq (SE50) and filtered using SOAPnuke [45]. Hisat v2 2.1.1 software was used to align the clean reads to the mm10 reference genome (https://ftp.ebi.ac.uk/pub/databases/gencode/Gencode_mouse/release_M23/gencode.vM23.annotation.gtf.gz). Then subread v2.0.6 software was then used to count the number of reads mapped to each gene (featureCounts function). The calculated genes with a total count greater than 1 were recognized as being expressed. Differential analysis was performed to explore the effect of KDM2A on macrophage function using the DESeq2 R package [46]. Genes ordered by log2 (fold change) were used for GSEA analysis and the selected functional gene sets were visualized using the pheatmap R package.
Reverse transcription-quantitative (RT-q) PCR
According to the manufacturer's instructions, total RNA was extracted using TRIZOL reagent, 1 ug of RNA was reverse transcribed using RT SuperMix, and real-time quantitative PCR was performed using SYBR Green PCR Master Mix (Q341-02, Vazyme) to detect the mRNA expression levels of relevant genes. β-ACTIN was used as an internal control for quantification, and relative RNA expression was analyzed using the 2-ΔΔCt method. Primers for qPCR are listed in Table 1.
PCR primers used in this study
| Use | Genes | Directions | Sequence (5' to 3') |
|---|---|---|---|
| RT-qPCR | |||
| Kdm2a | Forward | GGTCAATAGGCTGCCAGGATTAA | |
| Reverse | TCGATTGTCTTGACCTGGCTTAT | ||
| Fyn | Forward | CGGGCATTGTACGACAACACT | |
| Reverse | AGCCTGGAAGTCCCGATAGA | ||
| Rreb1 | Forward | AGCCTGGAAGTCCCGATAGA | |
| Reverse | GTAGGGCTTCTCGCCCGTAT | ||
| Bcl2l11 | Forward | AAATGGCCAAGCAACCTTCTG | |
| Reverse | CTTGCGGTTCTGTCTGTAGGG | ||
| Runx1 | Forward | TGAAGAACCAGGTAGCGAGATTC | |
| Reverse | GCAACTTGTGGCGGATTTGTAAA | ||
| Arid1a | Forward | CTCTGGACCTCTATCGCCTCTAT | |
| Reverse | CACATTGAGGTTGGTTGCAAGTT | ||
| Rnf213 | Forward | TGACCTCCGCAGATCAACAATTA | |
| Reverse | TCCATTTGTTCCTCTGCCAATTC | ||
| Mafb | Forward | TTGAGGGAAAGCTAAGGGAGAGA | |
| Reverse | CGTGGGTGTGTGTATGTCAATTT | ||
| Aff1 | Forward | GAAGGAAAGACGCAACCAAGA | |
| Reverse | TAGCTCATCGCCTTTTGCAGT | ||
| ChIP-qPCR | |||
| Fyn-1 | Forward | GGCGTCCCTTTCTTTCTGGT | |
| Reverse | ACAGCTAAATGCCTGCACCT | ||
| Fyn-2 | Forward | ACTGGTAGCATTGAGTGGCA | |
| Reverse | GGGGAAATGAGGGATAGGGG |
Western blotting
After the treatment, the cells were washed with PBS, and was added RIPA lysis buffer containing protease and phosphatase inhibitors. The cells were collected in a centrifuge tube, and centrifuged at 12000 rpm for 15 minutes, 4°C. After centrifugation, the protein supernatant was collected, and the total protein concentration was quantified using a BCA protein detection kit (Beyotime, China). 40 ug of total protein was used for Western blotting. The sample was mixed with 5× loading and heated it in a metal bath at 100°C for 10 minutes to denature the protein. Proteins were separated by SDS-PAGE and then transferred to a PVDF membrane. After blocking with 5% skim milk in TBST, the membrane was incubated with relevant antibodies at 4°C overnight. Membranes were incubated with HRP-conjugated secondary antibodies for 1 hour. The bands were then detected using a chemiluminescence imaging system and the grey scale values were quantified using Image J software.
Animal study
8-week-old ApoE-/- mice (C57 background, Cavens, Jiangsu, China) were housed in the Animal Center of Chongqing Medical University, maintained on a 12-hour light/dark cycle, and given free access to food and water. After one week of acclimatization, the mice were induced by feeding a Western-type high-fat, high-cholesterol (HFD) diet (D12109C, Research Diets) (AS group). To obtain early and late atherosclerotic lesions, mice in the AS group fed for 8 or 16 weeks were harvested. To validate the atherogenic function of KDM2A, 100μl adeno-associated virus serotype 9 (AAV9) of KDM2A (HBAAV2/9-F4/80-mir30-m-KDM2A-mcherry, M-KDM2A KD group) (1×10¹¹ v.g) or negative control (HBAAV2/9-F4/80-mcherry, Control group) was injected through the tail vein at week 10 of high fat feeding. The AAV-associated virus was purchased from Han Hundsun Biological Technology. All animals were treated humanely, all animal procedures were in accordance with the protocol approved by the Animal Care and Use Committee of Chongqing Medical University (No. 2021-604), and all animal procedures complied with the relevant legal and ethical requirements.
After HFD feeding, all mice were euthanized. The aortic roots of the mice were then isolated and used to prepare the frozen sections. Aorta and carotid arteries were isolated and fixed in 4% paraformaldehyde. After dehydration, the tissues were embedded in paraffin wax and stained with hematoxylin and eosin (HE). Sections were visualized using a Leica DM4B microscope.
Oil-red O staining
Aortic root sections from mice were stained with Beyotime (China), soaked in Oil-red O staining solution for 10 minutes, washed with washing solution, and then hematoxylin staining solution was added to stain the nucleus. The same procedure was applied to cells. RAW264.7 cells were cultured in 24-well plates, and after treatment, the medium was aspirated and washed with PBS. After fixation with 4% paraformaldehyde for 30 minutes, Oil-red O staining solution (Merck, 1320-06-5) was added for 10 minutes, and after washing with washing solution, the hematoxylin staining solution was added to stain the nucleus. Analysis was performed using a microscope and ImageJ software (described above).
Immunofluorescence staining
Mouse aorta and human carotid atherosclerotic samples were harvested, fixed in 4% paraformaldehyde, embedded in paraffin, and sectioned at 5 um. Sections were dewaxed, rehydrated, and then boiled in citrate buffer for 5 minutes to extract antigens before being rinsed twice with PBS. To assess the expression of different proteins in the same tissue or cell section, tissue and cell sections were permeabilized with 0.1% Triton X-100 in PBS for 20 min, blocked with 5% goat serum for 1 h, and were then incubated with the respective target antibodies overnight at 4 °C. The sections were then treated with 4′,6-diamidino-2-phenylindole (DAPI) for 5 minutes, followed by incubation with multi-label fluorescence-conjugated secondary antibodies (AIFang biological, Hunan, China) for 1 hours at room temperature in the dark.
BMDMs are seeded in 24-well plates and at the end of the treatment, the medium was discarded and PBS was added for washing. After fixation with 4% paraformaldehyde for 30 minutes, 0.5% Triton X-100 was added for 20 minutes. Block with 10% goat serum for 30 minutes, discard blocking solution, add primary antibody and block overnight at 4°C. After washing the primary antibody with PBS, fluorescent secondary antibody was added and incubated at 37°C in the dark for 1 h. After incubation, the secondary antibody was washed with PBS, DAPI was incubated for 5 minutes and then observed under fluorescence microscopy (Leica Microsystems, Germany). ImageJ was used to qualify the number of positive cells and calculate the fluorescence intensity of the cells. The KDM2A antibody (Abcam, ab191387) and the inducible NO synthase (iNOS) antibody (Abcam, ab15323) were used for immunofluorescence.
ChIP-seq and ChIP-qPCR
1×10⁷ ox-LDL treated RAW264.7 cells were collected for chromatin immunoprecipitation followed by sequencing (ChIP-seq) at GeneCreate Biological Engineering (Wuhan, China). Briefly, five nanograms of DNA were used as starting material for input and IP samples. The libraries were amplified for 13 cycles on the thermocycler. And the sequencing results were analyzed using BGI DNBSEQ-T7. Low quality reads were filtered out using fastp v0.20.0 software. After the quality control step, the clean reads were aligned to the mouse GRCm38 genome using Bowtie2 2.4.4 software (https://ftp.ncbi.nlm.nih.gov/genomes/all/GCA/000/001/635/GCA_000001635.8_GRCm38.p6/). Data quality was assessed using the deeptools v3.5.1 tool with the parameters "plotFingerprint --minMappingQuality 30 --skipZeros --numberOfSamples 50000". The MACS2 program (v2.2.7) was used to identify KDM2A binding peaks. Peak motif analysis was then conducted by homer software (v4.11.1) and peak annotation was performed using the chipseeker (v1.26.2) R package. Functional enrichment for peaks located near corresponding genes was further performed by clusterProfiler R package (v3.18.1). The significant target peaks of KDM2A were visualized through IGV 2.15.2 software.
RAW264.7 cells (4 × 10⁶ per immunoprecipitation) treated with ox-LDL were subjected to ChIP-qPCR using the SimpleChIP® Plus Kit (CST, 9005) according to the manufacturer's protocol. Immunoprecipitated DNA and DNA isolated from 2% input chromatin were amplified by quantitative PCR using SYBR Green PCR Master Mix (Q341-02, Vazyme) and locus-specific primers. Results were expressed as the percentage of input, calculated as the amount of DNA amplified from immunoprecipitated samples relative to the corresponding input DNA, using the same primers. The ChIP-qPCR primers used in this study are listed in Table 1.
Antibodies
Primary antibodies against KDM2A (1:1000, 24311-1), NOX2 (1:5000, 19013-1), FYN (1:10000, 66606-1), BCL2 (1:1500, 26593-1), NRF2 (1:2000, 16396), SOD2 (1:10000, 66474-1) as well as secondary antibodies (goat anti-mouse, SA00001-1; goat anti-rabbit, SA00001-2) were purchased from Proteintech Group (Chicago, IL, USA); IL-1β (sc-12742, 1:2000) from Santa Cruz Biotechnology (Santa Cruz, CA, USA); TNF-α (1:500, AF7014), BAX (1:1000, AF0120), and acetyl-SOD2 (AC-SOD2) (1:1000, AF3751) were purchased from Affinity (USA). NQO1 (1:1000, 3187S), CD68 (1:1000, 97778S) and iNOS (1:1000, D6B6S) were purchased from Cell Signaling Technology (Beverly, MA, USA). Phospho-FYN (p-FYN) (1:1000, AF01116) was purchased from AiFang biological (Hunan, China). The KDM2A antibody used for immunofluorescence was purchased from Abcam (1:1000, ab191387).
Statistical analysis
All statistics were calculated using the GraphPad Prism 9.0 software or R 3.6.3 or 4.2.1 software. In vitro experiments included at least 3 biological replicates. Spearman's rank correlation test was used for correlation analysis. Binary logistic regression analysis was used for clinical significance part (adjusted for demographic variables). Statistical significance between two groups was assessed using paired Student's t-tests for paired samples, and Mann-Whitney U-test or Wilcoxon signed-rank test for unpaired samples (where indicated). For more than two groups, statistical significance was assessed by one-way ANOVA by Tukey's multiple comparison test. A p-value of less than 0.05 was considered statistically significant.
Results
Identification of master regulons in atherosclerosis development
Atherosclerosis is characterized as a lipid-driven inflammatory damage of the arterial intima, and the complexity of the functional response is determined by triggered TRs. A total of 1468 regulatory networks with regulon activities were constructed. After differential analysis, 404 regulons were dysregulated in plaque compared to the normal group (Supplementary table 2), of which 136 regulons were upregulated and 268 regulons were downregulated (Supplementary figure 1A). The top 10 up- and downregulated regulons are shown in Supplementary figure 1B. Accordingly, two different two different techniques for feature selection (LASSO and SVM-RFE) were applied to identify the potent regulons of atherosclerosis development (Figure 1A-B). Seven (NPAS2, ZNF215, ZNF276, TSHZ2, DLX2, HESX1, and KDM2A) and six (HOXB7, ZNF713, IRF4, DLX2, HESX1, and KDM2A) regulons were identified by LASSO and SVM-RFE, respectively. After intersection analysis, three regulons (DLX2, HESX1, and KDM2A) were identified as master TRs in atherosclerosis (Figure 1C). The regulatory networks were visualized in Supplementary figure 1C, in which 72 target genes of KDM2A, 19 target genes of HESX1, and 6 target genes of DLX2 were pruned by RTN analysis (Supplementary table 3). The box plot showed that DLX2 was inactivated in the plaque (AS group), whereas HESX1 and KDM2A were activated in the AS group based on GSE43292 (Figure 1D). Then, differences in the activities of the three regulons were validated in the combine dataset (Supplementary figure 1D). Only KDM2A was still activated in AS group with an excellent distinguish ability in GSE43292 (area under curve, AUC = 0.90) and the combine dataset (AUC=0.73, Figure 1E-F).
Identification of KDM2A as a key transcriptional regulator (TR) in the development of atherosclerosis. Screening of master regulons by (A) LASSO and (B) SVM-RFE machine learning algorithms. (C) Key regulons were identified as the intersection of these two algorithms. (D) Boxplots show the difference of the three TRs activities (DLX2, HESX1, and KDM2A) between macroscopically intact (n = 32) and atheroma plaque tissue (n=32) groups. (E) Receiving operating curve (ROC) shows the diagnostic efficacy of KDM2A regulon activity in GSE43292. (F) Validations of ROC curves (DLX2, HESX1, and KDM2A) in the combine dataset (n = 235 in total, AS = 195, normal = 40). (G) Linear regression plot of KDM2A expression with coronary artery disease (CAD) class in GSE90074 (n=143) (correlation coefficient = 0.15, P value = 0.046). (H) Receiving operating curve (ROC) shows the diagnostic efficacy of KDM2A regulon activity in GSE90074 (n = 143 in total, non-obstructive = 50 and obstructive = 93). Correlation analysis was examined by Spearman's test. Expressions were presented in boxplots together with the group mean ± SE. For two groups, data were compared by paired t-test test: ****P < 0.0001.
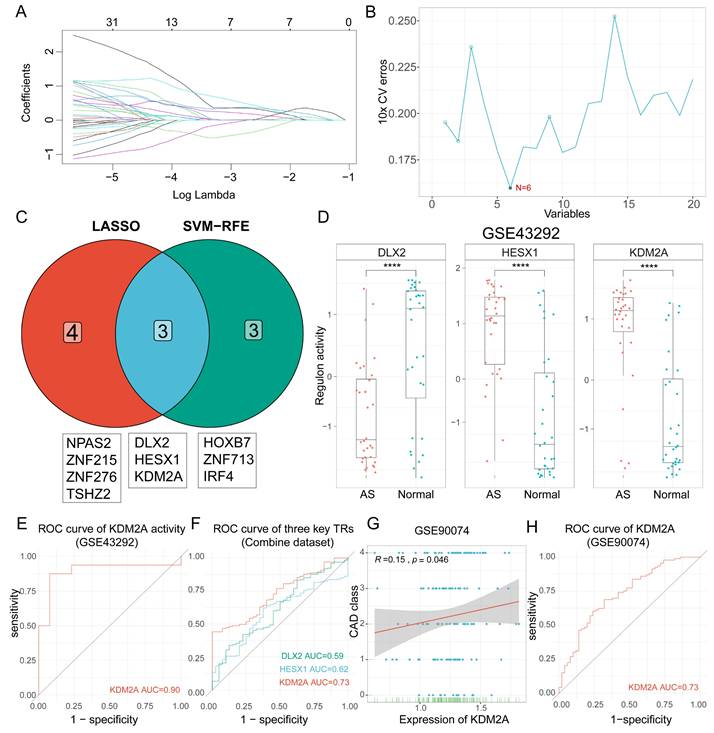
The transcriptional changes of the three TRs were also examined during atherosclerosis progression (GSE28829, including early atherosclerotic and advanced atherosclerotic plaque samples, n = 13 vs. n =16, respectively). KDM2A was still elevated in the advanced atherosclerotic plaque group (Supplementary figure 1E). To further validate the diagnostic efficacy of KDM2A, correlation and regression analyses were performed for the association of KDM2A levels from PBMCs with CAD class. We observed that KDM2A level in PBMCs is strongly correlated with CAD class (coefficient = 0.15, P = 0.046) and a good predictor for CAD classification (non-obstructive vs. obstructive, AUC = 0.73) (Figure 1G-H), instead of DLX2 and HESX1 (Supplementary figure 1F-G). The boxplot also showed the significant increase of KDM2A in obstructive CAD patients (Supplementary figure 1H). In the adjusted model, KDM2A was consistently associated with the risk of obstructive CAD (odds ratio = 6.00 [95% confidence interval, 1.03-34.91], P = 0.046) (Supplementary figure 1I). Therefore, we believe that KDM2A expression, especially in major immune cells (T cells or macrophages), is significantly associated with atherosclerosis, suggesting that KDM2A expression is potentially linked to immune response. Furthermore, we performed functional enrichment analysis of the target genes of KDM2A using the Metascape, and the top terms indicated the potential association of KDM2A with inflammation and immune cell response (Supplementary figure 1J).
Involvement of KDM2A in macrophage function
To precisely define the potential functions of KDM2A in atherosclerosis, GO, KEGG, and HALLMARK GSEA analyses of genes correlated with the regulon activity of KDM2A were performed. In the biological process subset, 8 of the top 10 terms were associated with immune cell activation (labelled in red in Figure 2A, Supplementary table 4). KEGG analysis also indicated that KDM2A was involved in inflammatory pathways, such as B- and T-cell receptor signaling, chemokine signaling, cytokine-cytokine receptor interactions, and FC gamma R-mediated phagocytosis, etc. (Figure 2B, Supplementary table 5). HALLMARK terms, including INFLAMMATORY_RESPONSE (most prominent, NES = 3.12), TNFA_SIGNALING_VIA_NFKB (NES = 2.82), and APOPTOSIS (NES = 1.86), were activated, indicating that KDM2A is significantly involved in the inflammatory response of immune cells (Figure 2C and Supplementary table 6).
KDM2A is involved in macrophage activation. Functional delineation of KDM2A by (A) gene ontology (GO), (B) Kyoto Encyclopedia of Genes and Genomes (KEGG), and (C) gene set enrichment analysis (GSEA). (D) The differences in the proportions of macrophage subtypes inferred by four algorithms (CIBERSORT, ssGSEA, xCell, and MCP-counter) in GSE43292 (n = 32 per group). (E) Correlation heatmap of three TRs (HESX1, DLX2, and KDM2A) with abundances of 11 macrophage subtypes in plaque samples (n = 32) of GSE43292. (F) Correlation heatmap of KDM2A with proportions of 11 macrophage subtypes in plaque (n = 195) and normal (n = 40) samples in the combine dataset. (G) Representative immunofluorescence staining images for KDM2A and CD68 in carotid arteries from a patient with atherosclerosis. Expressions are presented as box plots showing the group mean ± SE. Data for two groups were compared by paired-t test: **P < 0.01, ***P < 0.001, ****P < 0.0001.
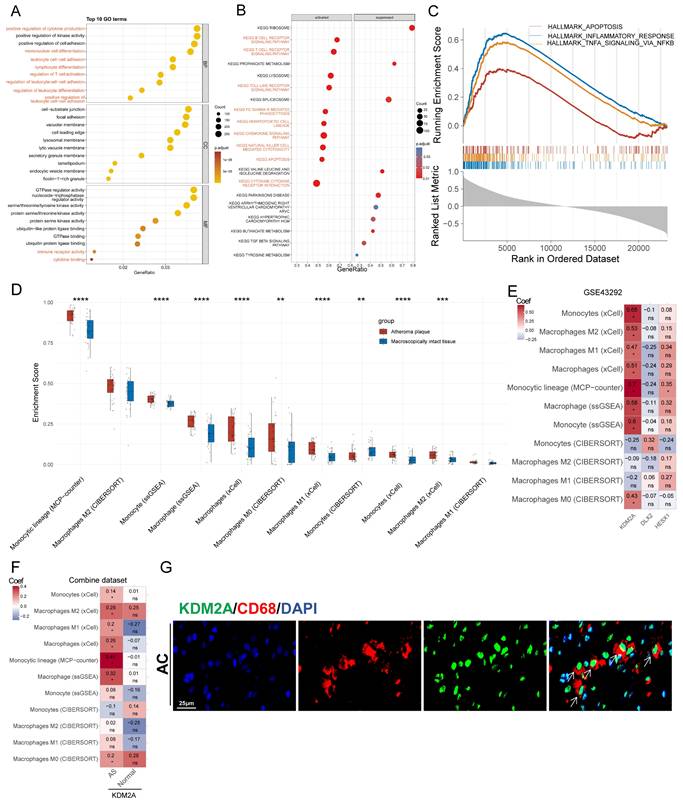
We therefore investigated the relationship between the potential regulons and the abundance of immune cells in plaque samples. KDM2A activity was positively associated with 24 out of 28 immune cell proportions (Supplementary figure 2A) using the ssGSEA algorithm. Accounting for the fact that macrophages and T cells constitute the main components of the innate and adaptive immune responses and play crucial roles in the development of atherosclerosis, we focused on different macrophage and T cell subtypes [47-50]. First, we found that most macrophage subsets from four different algorithms (except for M2 subtypes) were more abundant in the AS group compared with normal artery (Figure 2D), and the differences were consistent in the combine dataset (Supplementary figure 2B). Furthermore, KDM2A activity was strongly associated with different macrophage subsets by different algorithms (except for CIBERSORT) (Figure 2E and Supplementary figure 2C). We also found that the significantly positive associations were not maintained in normal arteries (Figure 2F), indicating the potential correlation of KDM2A activation and macrophage inflammatory response. As for T cells, we also found that most T cell subtypes were upregulated in plaque (Supplementary figure 2D and 2E). However, the associations of KDM2A activity with T cell subtypes were not consistent across different algorithms and datasets (Supplementary figure 2F and 2G). For example, although different T cell subtypes (such as regulatory, Th1, gamma delta, and CD8+ T cell) are positively correlated with KDM2A activity through ssGSEA analysis, the relationships could not be validated by other algorithms (MCP-Counter, XCell, and CIBERSORT) (Supplementary figure 2G). Therefore, the regulatory role of KDM2A in T cell isn't convincing. Furthermore, in a representative human plaque lesion, KDM2A+ cells were co-expressed with CD68 (Figure 2G), confirming our analysis.
scRNA-seq data reveals the role of KDM2A in macrophage phenotypical alterations
Using the GTEx database, we validated the expression of KDM2A in different organs/tissues. We found that KDM2A is expressed at the highest levels in blood vessels, with the exception of the lungs (Supplementary figure 3A). We also investigated the potential function of macrophage KDM2A based on scRNA-seq. A total of 35,021 cells were clustered into 19 cell populations and 5 main cell types were identified based on the automatic and manual annotation (Figure 3A and Supplementary figure 3B-C) as we previously described [38]. Among the main cell types (>3%) in the plaque, KDM2A expression was higher in macrophages than in T cells (Supplementary figure 3D). To explore the specific role of KDM2A in macrophages, we extracted cells annotated as macrophages for sub-clustering. Cluster 0, which showed upregulation of F13A1 as well as the anti-inflammatory markers FOLR2, was identified as a resident subset (Figure 3B-D, Supplementary figure 4A) [51]. Cluster 1 was recognized as TREM2-high (high expression in TREM2 and LGALS3) (Figure 3B-D, Supplementary figure 4A) [52, 53]. In addition, cluster 2 showed a predominant upregulation of inflammation-associated genes (IL1B, S100A8, CXCL2 etc.), suggesting as an inflammatory phenotype (Figure 3B-D, Supplementary figure 4A) [54]. The significant increase in the TREM2-high proportion and relative decrease in the resident-like subtype indicated a foaming process in the AC group (Supplementary figure 4B). DoRothEA, an efficient tool for inferring TR network activities in single-cell resolution, was implemented in our study [55]. Compared to resident-like subtype, KDM2A activity was significantly upregulated in inflammatory and TREM2-high subtypes, indicating KDM2A activation in macrophage phenotypic alterations (Figure 3E). Although KDM2A activity was relatively higher in inflammatory macrophages (inflammatory vs. TREM2-high, P = 0.058), the insignificance shown suggests that KDM2A may play a role in both inflammatory and TREM2-high subtypes. Therefore, the Monocle analysis was utilized to elucidate the underlying biological processes of KDM2A across different functional states.
KDM2A participates in the functional state alteration of macrophages. tSNE clustering plots showing (A) 8 cell populations of GSE159677 (a total of 35,021 individual cells), (B) 3 macrophage subtypes, (C) 3 color-coded cell clusters, and (D) different groups (of 6533 individual cells). (E) Violin/box plot of KDM2A activities across different macrophage subtypes. (F) Sankey diagram linking cell types and different Monocle states between atherosclerotic and normal groups. (G) Heatmap showing the expression dynamics of 3 gene clusters with the first branch point determined by BEAM analysis. Kyoto Encyclopedia of Genes and Genomes (KEGG) analyses of gene clusters (H) 2 and (I) 1 belongs to State 2 and 3, respectively. (J) Pseudotime kinetics of KDM2A activity with pseudotime progression (colored by different State). (K) Displayed genes ordered by correlation coefficient with KDM2A activity. Correlation analysis was examined by Spearman's test; for two groups, data were compared by Wilcoxon signed-rank test. Expressions are presented as box plots showing the group mean ± SE.

Three different functional states of macrophages were discovered by trajectory inference (Supplementary figure 4C-F). Obviously, resident-like macrophages were predominantly included in state 1 (98.17%), while most inflammatory and TREM2-high cells constituted the majority of state 2 and 3 (75.54% and 65.41%, respectively) (Figure 3F and Supplementary table 7). Furthermore, the increased abundances of state 3 (19.41% to 46.68%) and decreased proportions of state 2 (34.04% to 8.19%) in AC samples compared to PA samples indicated the state alterations of macrophages in atherosclerosis (Supplementary figure 4G and Supplementary table 8). Accordingly, we performed BEAM analysis to identify the genes involved in the differentiation of the trajectory of the first point. The genes were assigned into 3 gene clusters with different branch-dependent expression pattern (Figure 3G and Supplementary table 9). Gene cluster 2, upregulated in state 2, was associated with PI3K-Akt, focal adhesion, regulation of actin cytoskeleton, ECM-receptor interaction signaling (Figure 3H). Gene cluster 1, highly expressed in state 3, was associated with lipid-related metabolism (including lipid and atherosclerosis, fluid shear stress and atherosclerosis, cholesterol metabolism, glycolysis, and PPAR signaling) and inflammatory (including antigen processed and presentation, viral protein interactions with cytokine and cytokine receptor, and IL-17 signaling) pathways (Figure 3I). Furthermore, regression analysis of KDM2A activity with pseudotime revealed that KDM2A shifted sharply at the late stage of the macrophage trajectory (predominantly comprising state 3 cells) (Figure 3 J). In addition, we also observed the drastically upregulated levels of KDM2A activity in state 3 (Supplementary figure 4H). These data likely demonstrated the potential association of KDM2A with macrophage lipid metabolism and functional activation. Correlation analysis of KDM2A activity also showed positive associations with inflammatory response, apoptosis, and transcriptional regulation markers (including NEAT1, CCR2, NLRP3, TLR4, BCL2L11, MAFB, RNF213, ARID1A, RUNX1, RREB1, and AFF1) but negative associations with macrophage marker and cholesterol metabolism related genes (CD68, SPP1, LGALS3, APOC1, APOE, and TREM2) (Figure 3K and Supplementary table 10) [56-61].
We also observed high expression of S100A8/9 in inflammatory macrophages, typically considered neutrophil markers. However, examination of other neutrophil markers (FUT4, CXCR2, GNL2, S100P, CAMP, MPO) revealed negligible expression in macrophage subtypes (Supplementary Figure 4I) [62]. In addition, immunofluorescence staining of mouse plaques revealed neutrophil infiltration (Ly6G+ cells); however, these cells did not co-express KDM2A, indicating that KDM2A is primarily expressed in macrophages (Supplementary figure 4J).
Additionally, GSE260657, generated by SmartSeq2 with a total of 7,686 cells clustered into 12 populations and defined as 6 main cell types after quality control, was used to validate the potential function of KDM2A (Supplementary Figure 5A-D and Supplementary Table 11). Among 6 main cell types (>3%) in plaque, we found that KDM2A expression was significantly upregulated in myeloid cells (Supplementary Figure 5E). Further sub-clustering analysis of the myeloid cells also identified three main macrophage subtypes: Resident, inflammatory, and TREM2-high, in the Smart-seq2-based scRNA-seq data (Supplementary Figure 5F-J and Supplementary Table 12). KDM2A expression was also significantly upregulated in the inflammatory subtype (Supplementary Figure 5K). Based on TRs activity inferred by the Dorothea algorithm, KDM2A activity was positively correlated with inflammatory response and negatively correlated with lipid metabolism and classical macrophage markers (Supplementary Figure 5K and Supplementary Table 13).
KDM2A is the key TR of macrophage inflammatory response
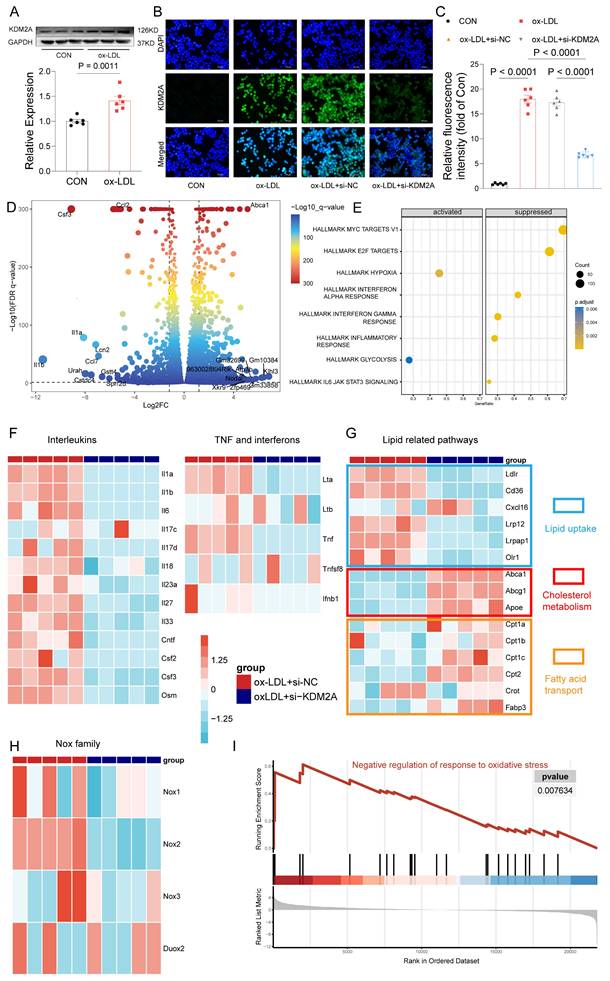
Given the demonstrated association of KDM2A with macrophage phenotypic alterations in plaque, we further validated the functions of KDM2A by in vitro experiments. Initially, although our focus was on the role of KDM2A in macrophages, we also examined the KDM2A levels in non-immune cells under ox-LDL treatment. We found that KDM2A expression in HUVECs remained unchanged across different concentrations of ox-LDL (Supplementary figure 6A) and different time points (Supplementary figure 6B). Similarly, the expression levels of KDM2A in VSMCs were also unchanged under different concentrations of ox-LDL at 24 hours (Supplementary figure 6C). Next, we examined the levels of KDM2A in BMDMs under different concentrations of ox-LDL (Supplementary figure 6D), and Kdm2a protein levels exhibited a significant increase at 20 ug/ml of ox-LDL. Meanwhile, the protein levels of Kdm2a were continuously upregulated at 12 h and further time points, as well as transcriptional levels (Supplementary figure 6E-F), so an ox-LDL concentration of 20 ug/ml and a treatment timepoint of 24 h were applied in further experiments (Figure 4A). Mus-1969 was selected for subsequent analyses due to its noteworthy efficacy in silencing Kdm2a expression in macrophages (hereafter referred to as si-KDM2A) (Supplementary figure 6G). Using immunofluorescence, we observed an upregulation of KDM2A in the ox-LDL group, which was downregulated after si-KDM2A treatment. Additionally, we found that Kdm2a was primarily localized in the nucleus (Figure 4B-C). To gain insight into the mechanism by which Kdm2a regulates macrophage inflammatory response, we performed RNA-seq analysis on BMDMs treated with either si-NC or si-KDM2A under ox-LDL stimulation. The si-KDM2A group was characterized by 1937 overexpressed and 1079 downregulated genes compared to si-NC treatment (Figure 4D and Supplementary table 14). We observed that cytokines and chemokines, such as Il1b, Il1a, and Ccl2, were most significantly suppressed, whereas energy and cholesterol metabolism markers, including Atp7b and Abca1, were strongly activated after si-KDM2A treatment. GSEA analysis of HALLMARK terms also indicated that inflammation-related pathways were repressed and glycolysis was activated (Figure 4E and Supplementary table 15). We further analyzed those genes relevant to cytokines (including interleukins, TNF family, and interferon) and lipid metabolism. Apart from Il1a and Il1b, other cytokines were also significantly downregulated in si-KDM2A group (Figure 4F). Interestingly, genes correlated with lipid uptake were downregulated whereas genes involved in cholesterol metabolism and fatty acid transport were upregulated after si-KDM2A treatment (Figure 4G), suggesting that activation of KDM2A would lead to lipid accumulation. Previous studies have demonstrated that oxidative stress can induce macrophage inflammation and subsequently destabilize plaque [63-65]. Accordingly, we analyzed the genes of the nicotinamide adenine dinucleotide phosphate (NADPH) oxidase complex (Nox1-3 and Duox2), which are the major donors of reactive oxygen species (ROS). These genes were downregulated in si-KDM2A group (Figure 4H). The oxidative stress-related GO terms also indicated the activation of negative regulation of the response to oxidative stress (Figure 4I and Supplementary table 16). Furthermore, the potential apoptosis and transcriptional regulation target genes of KDM2A through RTN and scRNA-seq were confirmed by RT-qPCR (Supplementary figure 6H).
KDM2A regulates the inflammatory response of macrophages. (A) Western blot assay demonstrates significant expression of KDM2A in bone marrow-derived macrophages (BMDMs) cultured with 20 ug/ml ox-LDL for 24 h. Data were shown as bar plot compared by Mann-Whitney U-test. (B) Immunofluorescence staining reveals alterations in KDM2A expression under siRNA Kdm2a (Si-KDM2A) treatment and quantified by (C) bar plot. Data were compared by one-way ANOVA test. (D) Differentially expressed genes identified between si-KDM2A treatment (n=5) and si-NC (n=5) BMDMs under ox-LDL treatment, represented by color and size dots in a volcano plot. (E) HALLMARK gene set enrichment analysis (GSEA) terms of differentially expressed genes after KDM2A knockdown. Heatmap shows the normalized read counts (log transformed) of genes belonging to (F) cytokines, (G) lipid-related pathways, and (H) Nox family. (I) GSEA plot showing upregulation of negative regulation of response to oxidative stress in si-KDM2A group. Expressions are presented as bar plots showing the group mean ± SEM, with n=6 per group.
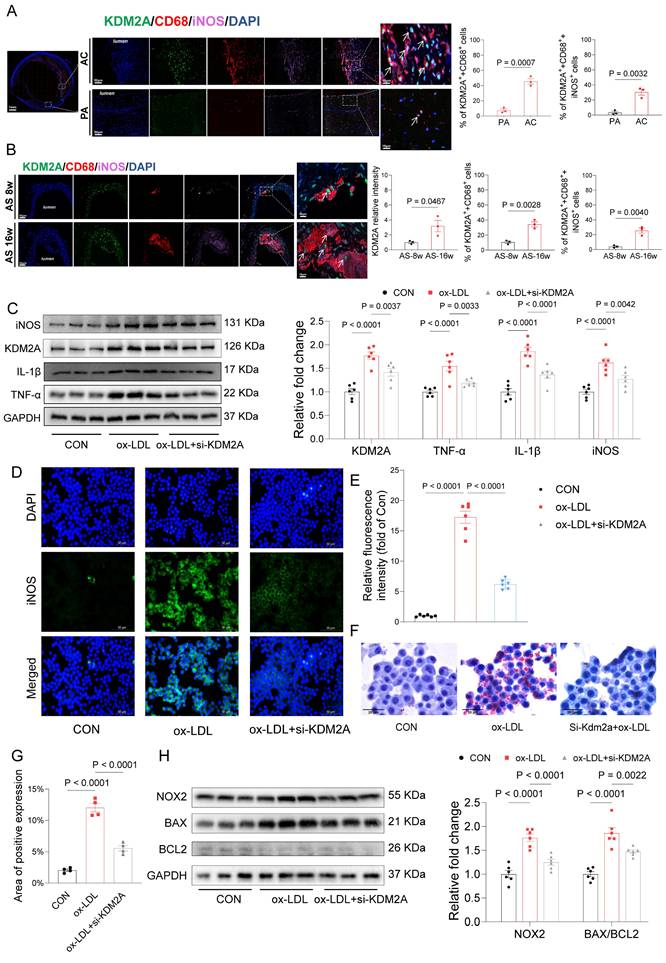
Based on carotid tissue samples from patients who underwent carotid endarterectomy, we compared the distribution of KDM2A and their co-localization with CD68 and iNOS in the PA and AC regions. Our findings indicate a significant increase in the nuclear accumulation of KDM2A in macrophages (CD68+ cells) and, notably, in inflammatory macrophages (CD68+iNOS+ cells) within the AC regions (Figure 5A). In the plaques of aortic arteries from ApoE-/- mice fed an HFD diet, increased nuclear accumulation of KDM2A in macrophages was observed during plaque progression (Figure 5B). Furthermore, the proportion of KDM2A+ macrophage co-expressing with iNOS was also increased in the AS-16w group (Figure 5B). Western blot assays confirmed that the increased levels of inflammatory markers (TNF-α, IL-1β, iNOS) after ox-LDL treatment could be rescued by Kdm2a knockdown (Figure 5C). Consistently, in vitro immunofluorescence confirmed the pro-inflammatory function of KDM2A (Figure 5D-E). Considering the effect of KDM2A on lipid metabolism, Oil-Red O staining revealed that lipid accumulation in macrophages could be alleviated by KDM2A knockdown (Figure 5 F-G). Furthermore, NOX2 was also positively regulated by KDM2A, as well as apoptotic markers (BAX and BCL2) (Figure 5H), indicating that KDM2A also regulates redox homeostasis and apoptosis.
In vitro experiments confirm the pro-inflammatory role of KDM2A. (A) Quantification of the number of cells expressing KDM2A co-expressed with CD68 and iNOS within the human carotid samples. (B) Quantification of the number of cells expressing KDM2A co-expressed with CD68 and iNOS within the mouse plaque lesions. Data were shown as bar plots together with group mean ± SE and compared using the Mann-Whitney U-test (n=3 per group). (C) Western blot assay showed significantly increased expression of inflammatory markers (TNF-α, IL-1β, and iNOS) in ox-LDL treated bone marrow-derived macrophages (BMDMs), which was rescued by si-KDM2A. (D) Immunofluorescence staining showed decreased iNOS expression under Si-KDM2A and quantified by (E) bar plot (n=3 per group). (F) Oil-red O staining determined the lipid accumulation of RAW264.7 cells with si-KDM2A treatment, and quantified by (G) bar plot (n=3 per group). (H) Western blot assay showed that the increased oxidative marker (NOX2) and apoptotic markers (BAX and BCL2) were alleviated by si-KDM2A. Expressions are presented as bar plots showing the group mean ± SEM, with n=6 per group unless otherwise specified. Data for more than two groups were compared by one-way ANOVA test.
KDM2A transcriptionally regulates FYN
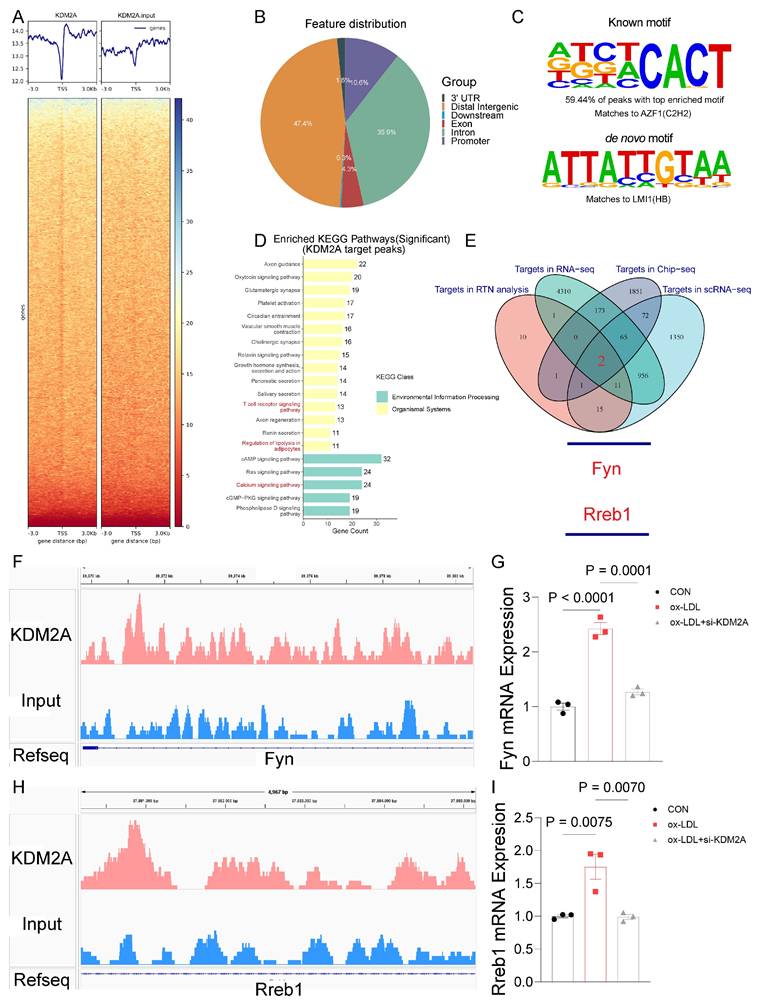
Having identified the pro-inflammatory role of KDM2A in macrophages, we performed further ChIP-seq experiments to identify the direct target genes of KDM2A under ox-LDL treatment (Figure 6A and Supplementary table 17). Most of the ChIP peaks were located at distal intergenic (47.4%), intron (35.9%), promoter (10.6%), and exon (4.3%) (Figure 6B and Supplementary table 18). And the motif of KDM2A targeted peaks was identified (Figure 6C). After enrichment analysis, peaks were enriched in calcium homeostasis based on GO terms (Supplementary figure 6 7A and Supplementary table 19), and genes were enriched in T cell receptor, chemokine signaling, leukocyte trans-endothelial migration, and regulation of lipolysis in adipocytes pathways based on KEGG terms (Figure 6D and Supplementary table 20). Intersection of RTN, RNA-seq, scRNA-seq, and ChIP-seq analyses suggested that Fyn and Rreb1 were the direct positively regulated genes by KDM2A (Figure 6E). The significantly different peaks were located at the promoter of Fyn and the intron of Rreb1 (Figure 6F and 6H), respectively. The positive regulatory relationships were also confirmed by RT-qPCR (Figure 6G and 6I). Furthermore, the positive associations of KDM2A with FYN and RREB1 were validated using plaque samples (Supplementary figure 7B-C). We then examined the correlations of KDM2A with FYN and RREB1 in 31 different organs-based GTEx. The associations (KDM2A-FYN and KDM2A-RREB1) was almost the most significant in blood vessels (Supplementary figure 7D-E).
FYN and RREB1 are direct target genes of KDM2A in macrophages. (A) Average ChIP-seq signal distribution near the transcriptional start site (TSS). (B) Genome-wide distribution of KDM2A ChIP-seq peaks in RAW264.7 cells. (C) Motif enrichment analysis of KDM22A co-bound peaks. (D) KEGG analysis of genes regulated by KDM2A. (E) A Venn diagram showing the target genes involved in inflammatory response regulated by KDM2A, identified as the intersection of RTN, scRNA-seq, RNA-seq, and ChIP-seq analysis. Genome browser views of 4 kb genomic loci of the (F) Fyn and (H) Rreb1 showing ChIP-seq tracks with called peaks (red bars). The increased RNA expression of KDM2A target genes (G) Fyn and (I) Rreb1 could be reversed by si-KDM2A. Expressions are shown as group mean ± SEM in bar plots. Data were compared by one-way ANOVA test, with n=3 per group.
Given the important role of KDM2A in macrophage inflammatory response during atherosclerosis development, we investigated the association of its expression in peripheral monocytes/macrophages with coronary/carotid atherosclerotic severity. The expression levels of KDM2A showed a strongly positive association with CAC score (P = 0.0046, R = 0.084) and carotid plaque severity (P = 0.011, R = 0.076) (Figure 7A and Supplementary figure 8A). The regulatory relationship between KDM2A and FYN was also confirmed in GSE56045 (Figure 7B). Furthermore, the FYN expression was also positively associated with CAC score (P = 0.04, R = 0.061) and carotid plaque severity (P = 0.12, R = 0.047) (Figure 7C and Supplementary figure 8B). Although the positive correlation between KDM2A and RREB1 expression was also observed (Supplementary figure 8C), there are no significant associations between RREB1 and CAC score (P = 0.96, R = 0.00014) and carotid plaque severity (P = 0.45, R = -0.023) (Supplementary figure 8D-E). Therefore, we further focus on the KDM2A-FYN axis in the macrophage inflammatory response. Previous studies had shown that H3K36me2 recruits DNMT3A and induces the DNA methylation of its target genes, which shapes the transcriptional processes in disease development [66, 67]. Accordingly, we analyzed the potential effect of KDM2A on FYN methylation. We found almost no association of KDM2A with CpG sites in FYN, especially in the promoter region (Supplementary figure 8F), suggesting that the regulatory relationship of KDM2A is independent of DNA methylation. ChIP-qPCR experiments confirmed the direct binding of KDM2A to the Fyn promoter (Chr10:39371081-39371369) (Figure 7D-E and Supplementary Figure 8G-H). To complement transcriptional analysis, we performed WB analysis to assess KDM2A dysregulation at the protein level in patients with stable CAD who undergoing percutaneous coronary intervention. Notably, patients with a high Gensini score demonstrated pronounced systemic inflammation (Supplementary Figure 8I-K), elevated KDM2A expression, and increased p-FYN, FYN levels (Figure 7F-I). Additionally, they showed heightened markers of inflammation and oxidative stress (Figure 7F-I and Supplementary Table 21).
KDM2A transcriptionally regulate FYN. The association of KDM2A expression with (A) CAC score and (B) FYN expression in GSE56045. (C) The association of FYN expression with CAC score. (D) Schematic illustrated the design for Fyn primers. (E) ChIP-qPCR showed the direct binding of KDM2A with the promoter of Fyn (n=3 per group). (F-I) Peripheral blood mononuclear cells from stable CAD patients undergoing percutaneous coronary intervention were used to validate the dysregulation of KDM2A, p-FYN/FYN ratios, and associated pathways based on the Gensini score. The expression levels of inflammatory markers (TNF-α, IL-1β, iNOS), oxidative stress markers (NRF2, NOX2, SOD2), and apoptosis-related proteins (BAX and BCL2) were assessed by immunoblotting (n = 5 per group). Data are presented as bar plots showing the group mean ± SEM and compared by Mann-Whitney U-test. Correlation analysis was examined by Spearman's test.

KDM2A-FYN axis promotes macrophage inflammatory response
AZD0530, a selective inhibitor of FYN phosphorylation, was used to explore the pro-inflammatory role in ox-LDL induced macrophages. We found that AZD0530 induction did not alter the expression of KDM2A and FYN but significantly reversed the increased p-FYN (Figure 8A-B). Levels of inflammatory markers (TNF-α, IL-1β, and iNOS) exhibited a dramatic reduction after inhibition of FYN phosphorylation (Figure 8A-B). Recent evidence has suggested a link between FYN and the oxidative response, which plays a critical role in driving macrophage M1 phenotypic transformation, thereby contributing to the development of atherosclerosis [68-70].
KDM2A-FYN axis exacerbates macrophage inflammatory response. (A-D) BMDMs were treated with the FYN activation inhibitor (AZD0530) for 24 hours after incubation with ox-LDL. Expression of inflammation (TNF-α, IL-1β, iNOS), oxidative stress (NRF2, NOX2, SOD2, NQO1, and AC-SOD2), and apoptosis (BAX and BCL2) was measured by immunoblotting and presented as bar plots together with group mean ± SEM (n = 6 per group). (E-H) BMDMs were treated with a KDM2A overexpression plasmid (OE-KDM2A) and rescued by AZD0530. The expression levels of inflammatory markers (TNF-α, IL-1β, iNOS), oxidative stress markers (NOX2, SOD2, and AC-SOD2), and apoptotic markers (BAX and BCL2) were measured by immunoblotting and presented as bar plots together with group mean ± SEM (n = 7 per group). (L) Oil-red O staining determined the lipid accumulation in RAW264.7 cells treated with OE-KDM2A and reversed by AZD0530, quantified by (M) bar plot (n=5 per group). The expressions were plotted together with the group mean ± SEM. data were compared by one-way ANOVA test.
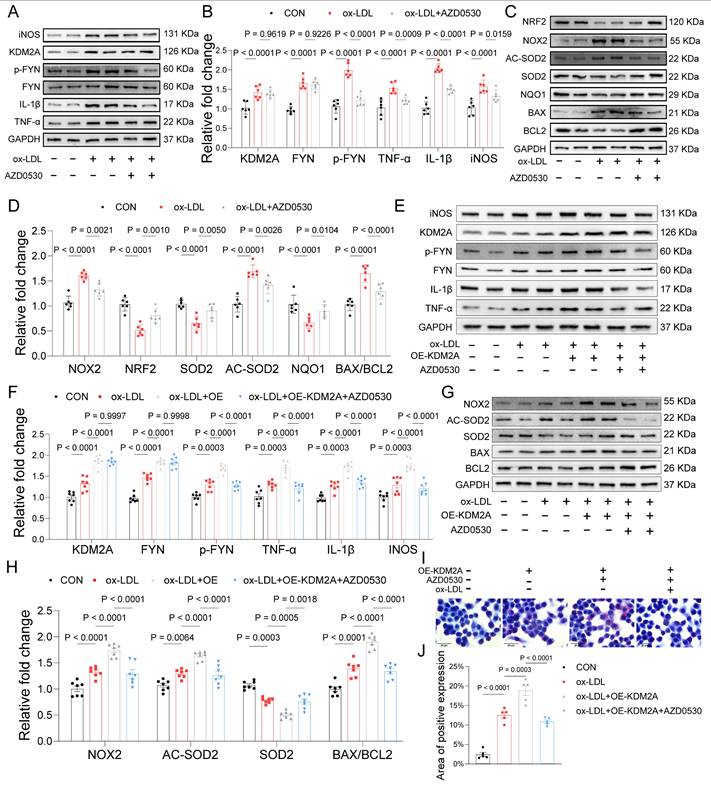
In vitro analyses further validated that FYN upregulates NOX2 and negatively regulates NRF2, the key TF in maintaining redox homeostasis (Figure 8C-D). Consistently, its downstream antioxidant regulators, SOD2 and NQO1, were also inhibited by AZD0530. Additionally, the expression of AC-SOD2 and BAX/BCL2 was downregulated upon inhibition of FYN activation (Figure 8C-D). Therefore, we presumed that KDM2A induces inflammatory response and oxidative stress via transcriptional activation of FYN in macrophages. Furthermore, overexpression of KDM2A in macrophages treated with ox-LDL exacerbated the expression of inflammatory markers (TNF-α, IL-1β, and iNOS), oxidative factors (NOX2, SOD2, and AC-SOD2) and apoptotic factors (BAX and BCL2). Conversely, inhibition of FYN largely rescued the functional changes in macrophages incubated with ox-LDL and the OE-KDM2A plasmid (Figure 8E-H). Oil-red O staining images revealed a significant increase in intracellular lipid droplet accumulation in macrophages after KDM2A overexpression, whereas the accumulation decreased in response to AZD0530 induction (Figure 8I-J).
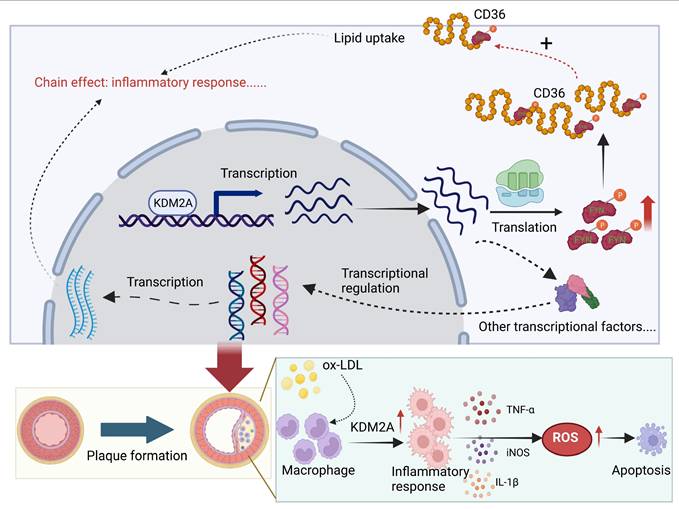
Schematic illustration of the role of KDM2A in the macrophage inflammatory response during atherosclerosis development. Graphic summary was generated with BioRender (https://app.biorender.com/).
Macrophage KDM2A knockdown prevents atherosclerosis progression
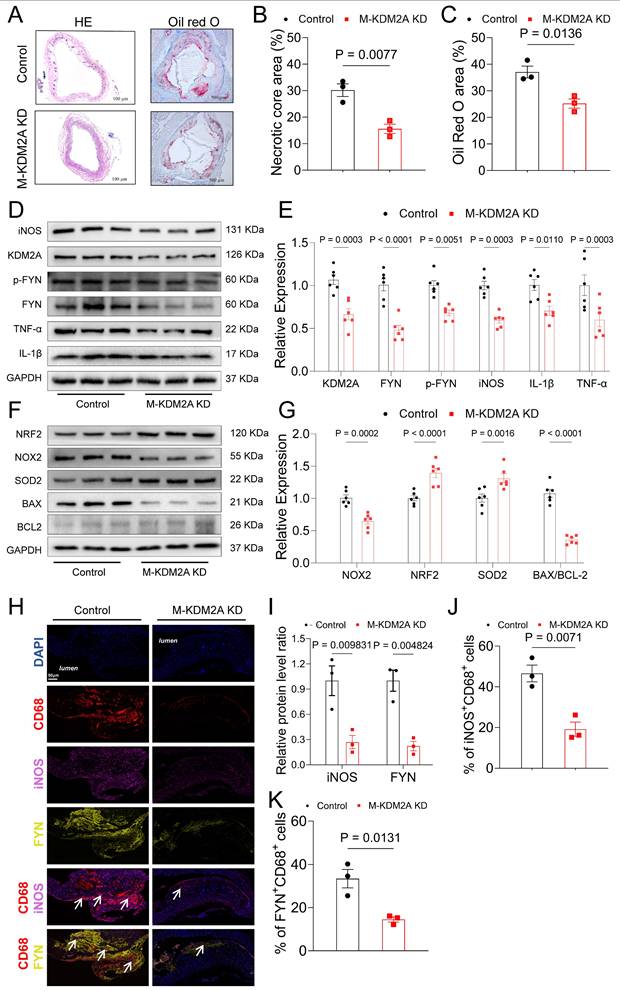
To verify the atherogenic role of KDM2A in vivo, we generated macrophage-specific KDM2A knockdown mice using AAV9-F4/80-si-KDM2A (M-KDM2A KD) via tail vein injection in ApoE-/- mice. This strategy facilitated the specific knockdown of KDM2A in macrophages, as it encoded KDM2A siRNA under the control of the macrophage-specific marker (F4/80) expression (Supplementary figure 9). Macrophage knockdown of KDM2A significantly alleviated the endothelial swelling in the carotid artery (Figure 9A). Oil-Red O staining of aortic roots further demonstrated that macrophage KDM2A knockdown reduced the atherosclerotic lesion area and necrotic area (Figure 9A-C). Immunodetection in aortic root revealed a significant reduction in KDM2A expression within CD68+ cells by AAV9-F4/80-si-KDM2A (Supplementary figure 10A-C). Consistently, WB analysis confirmed the downregulation of KDM2A, p-FYN, FYN, and associated inflammatory and oxidative stress markers in aortic tissue from the M-KDM2A KD group (Figure 9D-G). The decrease in KDM2A+ macrophage proportion within the plaque of M-KDM2A-KO group was accompanied by reduced inflammation (iNOS+CD68+ cells), as well as its direct target FYN content (FYN+CD68+ cells) (Figure 9H-K). These findings indicated that the inhibition of KDM2A in macrophages reduced the progression of atherosclerosis by reducing macrophage inflammatory response and FYN upregulation.
Inhibition of Macrophage KDM2A attenuates atherosclerotic progression. (A) HE staining of carotid arteries in ApoE-/- mice treated with adeno-associated virus serotype 9 (AAV9) of negative control (HBAAV2/9-F4/80-mcherry, Control) or si-KDM2A (HBAAV2/9-F4/80-mir30-m-KDM2A-mcherry, M-KDM2A KD). (B) Quantitative analysis of the area of necrotic core (upper panel) and atherosclerotic lesion (lower panel) in aortic roots (n=3 per group). (C) Oil-red O staining of aortic roots from ApoE-/- mice treated with AAV-NC or AAV-si-KDM2A. (D-G) Aortic tissue samples from control and M-KDM2A KD group were used to validate the dysregulation of KDM2A, p-FYN/FYN ratios, and associated pathways The expression levels of inflammatory markers (TNF-α, IL-1β, iNOS), oxidative stress markers (NRF2, NOX2, SOD2), and apoptosis-related proteins (BAX and BCL2) were assessed by immunoblotting and presented as bar plots (n=6 per group). (I) Representative immunofluorescence analysis of cross-sections of the aortic root stained with iNOS, FYN, and CD68. Quantification of the relative intensity iNOS/FYN (I) and percentages of iNOS+ (J) and FYN+ (K) macrophages (CD68+ cells). Values are presented as group mean ± SEM. Data were compared by Mann-Whitney U-test.
KDM2A genetically causes atherosclerosis and intervention compounds
The study flowchart for identifying a genetic association between KDM2A and atherosclerosis is shown in Figure 10A. Using the IVW method, genetically predicted higher levels of KDM2A were suggestively associated with atherosclerosis (Figure 10B). Additionally, sensitivity analysis demonstrated a robust genetic relationship (Supplementary figure 11A-B, Supplementary table 22-23). To assess whether KDM2A expression and atherosclerosis were consistently sharing the true casual variant instead of confounding of linkage disequilibrium, KDM2A was supported by suggestive evidence (PPH4 > 50%) through colocalization analysis, indicating promising probability for a shared casual variant between gene expression and atherosclerosis risk (Figure 10C and Supplementary table 24). We also investigated the potential effect of KDM2A on other cardiovascular phenotypes (such as lipids, atrial fibrillation, etc.). The strong association of HDL cholesterol with KDM2A and moderate associations of other lipid parameters (total cholesterol, LDL cholesterol, serum apolipoprotein A, and non-HDL cholesterol) were observed in the CVDKP platform (Figure 10D).
KDM2A casually predicts atherosclerosis. (A) The study flowchart shows the genetic association analysis of KDM2A with atherosclerosis; (B) Forest plot illustrating the association of KDM2A with risk of atherosclerosis using the random effects inverse-variance weighted (IVW) method across different databases (UK Biobank and FinnGen). (C) Regional association plot for the colocalization analysis of KDM2A expression with atherosclerosis risk, with the lead SNP shown as a purple diamond. (D) HuGE (Human Genetic Evidence) scores quantify the genetic support for the involvement of KDM2A in various diseases and traits available in the CVDKP platform. (E) Electrostatic potential diagram of KDM2A (PDB ID: 4BBQ) interacting with the five good candidates (Kisspeptin-1: blue, NF-449: pink, Colistin: purple, Micafungin: orange, and TRV-120027: cyan). Predicted binding models of Kisspeptin-1 (F), NF-449 (G), Colistin (H), Micafungin (I), and TRV-120027 (J) with the Zinc finger of KDM2A. KDM2A was shown as a green cartoon, and the critical residues in binding were colored in red. The five compounds were shown as pink sticks. Yellow dashed lines represented the potential hydrogen bonds.
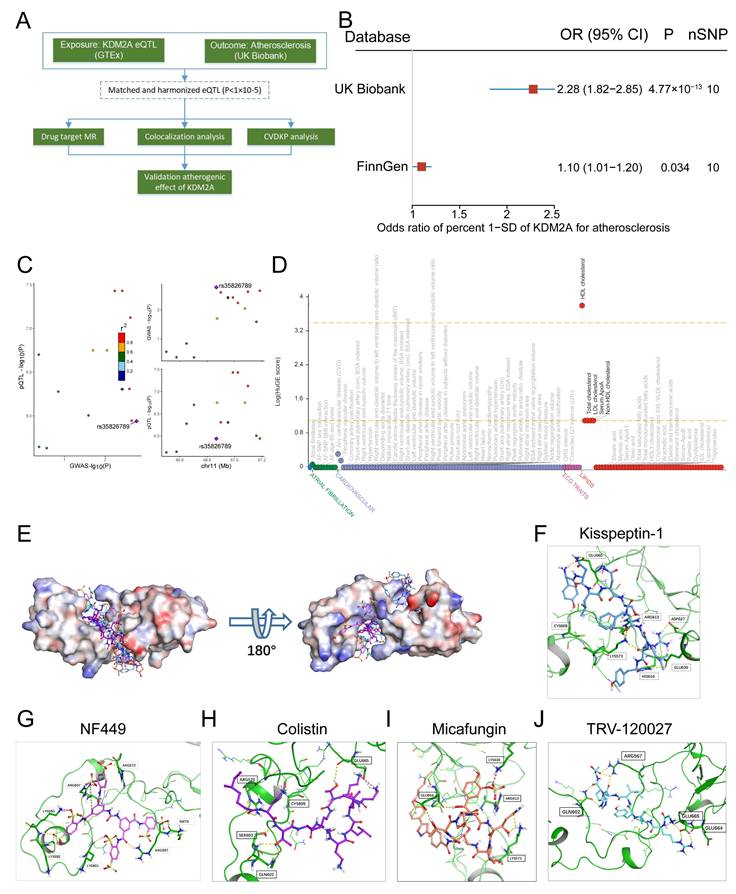
Through virtual screening, the top 5 small molecules (Kisspeptin-1, NF-449, Colistin, Micafungin, and TRV-120027) that directly target KDM2A based on its 3-dimensional structure were selected according to the docking score (Figure 10E and Supplementary table 25). According to the docking structure, all of the 5 compounds are predicted to bind the CXXC-type and PHD-type domain of KDM2A (Figure 10F-J and Supplementary figure 11C-G).
Discussion
In this study, we reported for the first time the detrimental role of KDM2A in the development and progression of atherosclerosis through an unbiased screening pipeline. KDM2A induces abnormal lipid metabolism, oxidative stress, and inflammatory response in macrophages by activating FYN transcription. The pro-atherogenic role of KDM2A in macrophages has also been validated by in vivo studies (Figure 10).
Transcriptional activation is the initial process in cell phenotypic alteration, in which transcriptional regulators play a critical role. Previous art-of-review summarized several TFs that had been found to be associated with phenotypic alteration of macrophages in atherosclerosis [12]. However, these TFs showed less specificity among different diseases and cell types, making them difficult to define as therapeutic targets. We first explored TRs during the development of atherosclerosis by constructing regulatory networks with regulon activity. With the advancement of scRNA-seq technology, we had uncovered that KDM2A is specifically involved in altering the functional state of macrophage. Additionally, we had also excluded the potential effect of KDM2A in other cell types (including T cells, VSMCs, and HUVECs). To date, there has been limited research establishing the association between KDM2A and macrophages. Longmin et al. showed that myeloid Kdm2a-/- mice were protected from HFD-induced injury (including obesity, insulin resistance, hepatic steatosis, and reduced macrophage accumulation in adipose), the underlying mechanism attributed to increased H3K36me2 levels of Pparg and subsequently M2 polarization by Kdm2a knockout [18]. However, the difference should be noted in our study. Kdm2a-/- BMDMs showed unaltered in M1-program related gens (Il1b and Nos2) by RT-qPCR under lipopolysaccharide treatment in their study. While, we observed an obvious downregulation of pro-inflammatory markers (Il1b, Tnfa, Nos2) after Kdm2a knockdown after ox-LDL stimulation (Figure 4E-F), which revealed the specific role of KDM2A in macrophages during atherosclerosis. Furthermore, they focus on the rewiring effect of KDM2A on M2 macrophage transition instead of M1 reprogramming. We found the novel regulatory role of KDM2A in oxidative stress, and apoptosis under ox-LDL treatment, not only in the inflammatory response. Therefore, we thought that our study may shed the light on the novel regulatory effect of KDM2A on atherosclerosis.
Macrophage inflammatory response is persistent and plays a critical pathogenic role from plaque formation, growth and to rupture [3, 71-73]. As macrophages are recruited from peripheral blood and undergo locally proliferation, the uptake of lipoproteins is typically recognized as the initial process of the inflammatory response [74-76]. Upon stimulation with lipoproteins (such as ox-LDL), metabolic reprogramming can induce the secretion of cytokines and chemokines [77, 78]. For instance, signals from CD36-mediated recognition with ox-LDL transduce to Toll-like receptor (TLR) heterodimers, specifically TLR2/4, leading to the formation of a heterotrimeric complex (CD36/TLR2/4) and activation of TLR signaling [79]. Moreover, increased cellular cholesterol, characterized by enhanced cholesterol uptake via LDL receptor (LDLR) and reduced cholesterol efflux via ATP-binding cassette transporters ABCA1 and ABCG1, can activate NLRP3 inflammasome assembly and subsequent secretion of IL-1 family cytokines [80, 81]. Excessive ROS production is another key feature of the macrophage inflammatory response to ox-LDL incubation [48, 82]. ROS further promote the mitochondrial DNA (mtDNA) damage and release, as well as activation of pro-inflammatory transcription factors (such as NF-κB) in macrophages and necrotic core formation [63, 83, 84]. Interestingly, we found that KDM2A not only regulates cytokines and chemokines secretion (IL-1β, TNF-α, etc.), but also influences lipid uptake (CD36 and LDLR), cholesterol efflux (ABCA1 and ABCG1), and oxidative stress (NOX2 and NRF2) in macrophages. And the underlying mechanism can be partly explained by FYN. FYN is a member of the Src family of protein kinases [85]. FYN, primarily localized in cytoplasmic leaflets, facilitates the transport of various cell surface receptors (such as CD36) from the cytoplasm, thereby inducing an inflammatory response in macrophages [86, 87]. In addition, a recent study shown that Fyn phosphonates c-Cbl at Tyr731, triggering the polyubiquitination of Sirt1 and subsequently increasing intracellular ROS levels in glomerular mesangial cells [88]. Elisabetta's study also observed increased activation of Nrf2 in Fyn-/- mouse erythroblasts compared to WT cells, although the underlying mechanism remains unclear [69]. In conclusion, our finding suggests that KDM2A regulates phenotypic alterations in macrophages through the transcriptional activation of FYN during the development of atherosclerosis.
Anti-inflammation is increasingly recognized as a promising approach to atherosclerosis prevention, with agents such as canakinumab (IL-1β inhibitor) and sodium-glucose co-transporter-2 inhibitors, though their anti-inflammatory effects [89-92]. However, careful evaluation of potential target proteins remains crucial, particularly when considering novel targets that play a significant role in atherosclerosis. In our study, we identified several small molecules as potential candidate for targeting KDM2A in the context of atherosclerosis. For instance, NF449 serves as a P2X1 receptor antagonist, which prevents fibrin generation and thrombus formation in previous study [93]. Our findings suggest its potential role as a KDM2A antagonist in treatment for patients with CAD.
Although we identified a novel transcriptional regulator KDM2A involved in macrophage inflammatory response and atherosclerosis, several limitations should be noted. Firstly, incorporation of FYN macrophage-specific overexpression mice can further rescue atherogenic and inflammatory role of KDM2A. Secondly, the efficacy and safety of potential KDM2A-targeting compounds must be thoroughly assessed through in vivo experiments.
Supplementary Material
Supplementary figures.
Supplementary tables.
Acknowledgements
This present study was supported by grants from National Natural Science Foundation of China (31400985, 82400477), Sichuan Science and Technology Program (No. 2024NSFSC0622). We also express our gratitude to Qiaoqiao Li PhD (The second affiliated hospital of Chongqing Medical University), Xuliang Wang PhD (Peking University Third Hospital), and Prof. Ming Xu (NHC Key Laboratory of Cardiovascular Molecular Biology and Regulatory Peptides, State Key Laboratory of Vascular Homeostasis and Remodeling, Peking University Third Hospital) for their selfless support and guidance.
Data availability
All data and materials needed to conduct the conclusions are available in the manuscript. Additional data related to this paper may be requested from the authors.
Author contributions
Y.C.P and Y.Z.X performed the experiments and wrote the manuscript; L.X.H, J.Y.L and M.H.L raised the conception of the study; Y.C.P, L.L, X.F.Y, W.M.Z, and J.Y.W performed the in vitro experiments; Y.Z.X, L.J and Y.C.P performed ChIP assays; L.J and Y.C.P conducted patient validation; Y.C.P and M.H.L performed the immunofluorescence assays. Y.Z.X, L.X.H and S.X.L designed the experiments, interpreted the data, wrote the manuscript, and supervised.
Competing Interests
The authors have declared that no competing interest exists.
References
1. Ala-Korpela M. The culprit is the carrier, not the loads: cholesterol, triglycerides and apolipoprotein B in atherosclerosis and coronary heart disease. International journal of epidemiology. 2019;48:1389-92
2. Tamargo IA, Baek KI, Kim Y, Park C, Jo H. Flow-induced reprogramming of endothelial cells in atherosclerosis. Nature reviews Cardiology. 2023;20:738-53
3. Hou P, Fang J, Liu Z, Shi Y, Agostini M, Bernassola F. et al. Macrophage polarization and metabolism in atherosclerosis. Cell death & disease. 2023;14:691
4. Miano JM, Fisher EA, Majesky MW. Fate and State of Vascular Smooth Muscle Cells in Atherosclerosis. Circulation. 2021;143:2110-6
5. Bycroft C, Freeman C, Petkova D, Band G, Elliott LT, Sharp K. et al. The UK Biobank resource with deep phenotyping and genomic data. Nature. 2018;562:203-9
6. Lusis AJ. Atherosclerosis. Nature. 2000;407:233-41
7. Tousoulis D, Oikonomou E, Economou EK, Crea F, Kaski JC. Inflammatory cytokines in atherosclerosis: current therapeutic approaches. European heart journal. 2016;37:1723-32
8. Moore KJ, Tabas I. Macrophages in the pathogenesis of atherosclerosis. Cell. 2011;145:341-55
9. Vallejo J, Cochain C, Zernecke A, Ley K. Heterogeneity of immune cells in human atherosclerosis revealed by scRNA-Seq. Cardiovascular research. 2021;117:2537-43
10. Cochain C, Vafadarnejad E, Arampatzi P, Pelisek J, Winkels H, Ley K. et al. Single-Cell RNA-Seq Reveals the Transcriptional Landscape and Heterogeneity of Aortic Macrophages in Murine Atherosclerosis. Circulation research. 2018;122:1661-74
11. Zernecke A, Winkels H, Cochain C, Williams JW, Wolf D, Soehnlein O. et al. Meta-Analysis of Leukocyte Diversity in Atherosclerotic Mouse Aortas. Circulation research. 2020;127:402-26
12. Kuznetsova T, Prange KHM, Glass CK, de Winther MPJ. Transcriptional and epigenetic regulation of macrophages in atherosclerosis. Nature reviews Cardiology. 2020;17:216-28
13. Lambert SA, Jolma A, Campitelli LF, Das PK, Yin Y, Albu M. et al. The Human Transcription Factors. Cell. 2018;172:650-65
14. Liu X, Guo JW, Lin XC, Tuo YH, Peng WL, He SY. et al. Macrophage NFATc3 prevents foam cell formation and atherosclerosis: evidence and mechanisms. European heart journal. 2021;42:4847-61
15. Xie B, Tian LW, Liu C, Li J, Tian X, Zhang R. et al. Disruption of the eEF1A1/ARID3A/PKC-δ Complex by Neferine Inhibits Macrophage Glycolytic Reprogramming in Atherosclerosis. Advanced science (Weinheim, Baden-Wurttemberg, Germany). 2025: e2416158.
16. Ma C, Li Y, Tian M, Deng Q, Qin X, Lu H. et al. Gsα Regulates Macrophage Foam Cell Formation During Atherosclerosis. Circulation research. 2024;134:e34-e51
17. Vacík T, Lađinović D, Raška I. KDM2A/B lysine demethylases and their alternative isoforms in development and disease. Nucleus (Austin, Tex). 2018;9:431-41
18. Chen L, Zhang J, Zou Y, Wang F, Li J, Sun F. et al. Kdm2a deficiency in macrophages enhances thermogenesis to protect mice against HFD-induced obesity by enhancing H3K36me2 at the Pparg locus. Cell death and differentiation. 2021;28:1880-99
19. Wagner KW, Alam H, Dhar SS, Giri U, Li N, Wei Y. et al. KDM2A promotes lung tumorigenesis by epigenetically enhancing ERK1/2 signaling. The Journal of clinical investigation. 2013;123:5231-46
20. Kong Y, Zou S, Yang F, Xu X, Bu W, Jia J. et al. RUNX3-mediated up-regulation of miR-29b suppresses the proliferation and migration of gastric cancer cells by targeting KDM2A. Cancer letters. 2016;381:138-48
21. Lu B, Wei J, Zhou H, Chen J, Li Y, Ye L. et al. Histone H3K36me2 demethylase KDM2A promotes bladder cancer progression through epigenetically silencing RARRES3. Cell death & disease. 2022;13:547
22. Wang J, Zhang ZY, Jiang J, Tang L, Wang XY, Wang Z. et al. KDM2A plays a dual role in regulating the expression of malignancy-related genes in esophageal squamous cell carcinoma. Biochemical and biophysical research communications. 2022;624:53-8
23. Li F, Wang Y, Hwang I, Jang JY, Xu L, Deng Z. et al. Histone demethylase KDM2A is a selective vulnerability of cancers relying on alternative telomere maintenance. Nature communications. 2023;14:1756
24. Spangler CJ, Skrajna A, Foley CA, Nguyen A, Budziszewski GR, Azzam DN. et al. Structural basis of paralog-specific KDM2A/B nucleosome recognition. Nature chemical biology. 2023;19:624-32
25. Gautier L, Cope L, Bolstad BM, Irizarry RA. affy-analysis of Affymetrix GeneChip data at the probe level. Bioinformatics (Oxford, England). 2004;20:307-15
26. Xue Y, Hu Y, Yu S, Zhu W, Liu L, Luo M. et al. The lncRNA GAS5 upregulates ANXA2 to mediate the macrophage inflammatory response during atherosclerosis development. Heliyon. 2024;10:e24103
27. Xue Y, Jian S, Zhou W, Zhou Q, Xiang J, Zhu Y. et al. Associations of Lipoprotein(a) With Coronary Atherosclerotic Burden and All-Cause Mortality in Patients With ST-Segment Elevation Myocardial Infarction Treated With Primary Percutaneous Coronary Intervention. Frontiers in cardiovascular medicine. 2021;8:638679
28. Castro MA, de Santiago I, Campbell TM, Vaughn C, Hickey TE, Ross E. et al. Regulators of genetic risk of breast cancer identified by integrative network analysis. Nature genetics. 2016;48:12-21
29. Ritchie ME, Phipson B, Wu D, Hu Y, Law CW, Shi W. et al. limma powers differential expression analyses for RNA-sequencing and microarray studies. Nucleic acids research. 2015;43:e47
30. Sanz H, Valim C, Vegas E, Oller JM, Reverter F. SVM-RFE: selection and visualization of the most relevant features through non-linear kernels. BMC bioinformatics. 2018;19:432
31. Ravi S, Schuck RN, Hilliard E, Lee CR, Dai X, Lenhart K. et al. Clinical Evidence Supports a Protective Role for CXCL5 in Coronary Artery Disease. The American journal of pathology. 2017;187:2895-911
32. Liu Y, Reynolds LM, Ding J, Hou L, Lohman K, Young T. et al. Blood monocyte transcriptome and epigenome analyses reveal loci associated with human atherosclerosis. Nature communications. 2017;8:393
33. Wu T, Hu E, Xu S, Chen M, Guo P, Dai Z. et al. clusterProfiler 4.0: A universal enrichment tool for interpreting omics data. Innovation (Cambridge (Mass)). 2021;2:100141
34. Barbie DA, Tamayo P, Boehm JS, Kim SY, Moody SE, Dunn IF. et al. Systematic RNA interference reveals that oncogenic KRAS-driven cancers require TBK1. Nature. 2009;462:108-12
35. Aran D, Hu Z, Butte AJ. xCell: digitally portraying the tissue cellular heterogeneity landscape. Genome biology. 2017;18:220
36. Becht E, Giraldo NA, Lacroix L, Buttard B, Elarouci N, Petitprez F. et al. Estimating the population abundance of tissue-infiltrating immune and stromal cell populations using gene expression. Genome biology. 2016;17:218
37. Alsaigh T, Evans D, Frankel D, Torkamani A. Decoding the transcriptome of calcified atherosclerotic plaque at single-cell resolution. Communications biology. 2022;5:1084
38. Xue Y, Luo M, Hu X, Li X, Shen J, Zhu W. et al. Macrophages regulate vascular smooth muscle cell function during atherosclerosis progression through IL-1β/STAT3 signaling. Communications biology. 2022;5:1316
39. Mocci G, Sukhavasi K, Örd T, Bankier S, Singha P, Arasu UT. et al. Single-Cell Gene-Regulatory Networks of Advanced Symptomatic Atherosclerosis. Circulation research. 2024;134:1405-23
40. Kurki MI, Karjalainen J, Palta P, Sipilä TP, Kristiansson K, Donner KM. et al. FinnGen provides genetic insights from a well-phenotyped isolated population. Nature. 2023;613:508-18
41. Hemani G, Zheng J, Elsworth B, Wade KH, Haberland V, Baird D. et al. The MR-Base platform supports systematic causal inference across the human phenome. eLife. 2018;7:e34408
42. Giambartolomei C, Vukcevic D, Schadt EE, Franke L, Hingorani AD, Wallace C. et al. Bayesian test for colocalisation between pairs of genetic association studies using summary statistics. PLoS genetics. 2014;10:e1004383
43. Navarro E, Udine E, de Paiva Lopes K, Parks M, Riboldi G, Schilder BM. et al. Dysregulation of mitochondrial and proteolysosomal genes in Parkinson's disease myeloid cells. Nature aging. 2021;1:850-63
44. Costanzo MC, Roselli C, Brandes M, Duby M, Hoang Q, Jang D. et al. Cardiovascular Disease Knowledge Portal: A Community Resource for Cardiovascular Disease Research. Circulation Genomic and precision medicine. 2023;16:e004181
45. Chen Y, Chen Y, Shi C, Huang Z, Zhang Y, Li S. et al. SOAPnuke: a MapReduce acceleration-supported software for integrated quality control and preprocessing of high-throughput sequencing data. GigaScience. 2018;7:1-6
46. Love MI, Huber W, Anders S. Moderated estimation of fold change and dispersion for RNA-seq data with DESeq2. Genome biology. 2014;15:550
47. Tabas I, Bornfeldt KE. Intracellular and Intercellular Aspects of Macrophage Immunometabolism in Atherosclerosis. Circulation research. 2020;126:1209-27
48. Koelwyn GJ, Corr EM, Erbay E, Moore KJ. Regulation of macrophage immunometabolism in atherosclerosis. Nature immunology. 2018;19:526-37
49. Saigusa R, Winkels H, Ley K. T cell subsets and functions in atherosclerosis. Nature reviews Cardiology. 2020;17:387-401
50. Wolf D, Ley K. Immunity and Inflammation in Atherosclerosis. Circulation research. 2019;124:315-27
51. Winkels H, Ehinger E, Vassallo M, Buscher K, Dinh HQ, Kobiyama K. et al. Atlas of the Immune Cell Repertoire in Mouse Atherosclerosis Defined by Single-Cell RNA-Sequencing and Mass Cytometry. Circulation research. 2018;122:1675-88
52. Jaitin DA, Adlung L, Thaiss CA, Weiner A, Li B, Descamps H. et al. Lipid-Associated Macrophages Control Metabolic Homeostasis in a Trem2-Dependent Manner. Cell. 2019;178:686-98.e14
53. Kim K, Shim D, Lee JS, Zaitsev K, Williams JW, Kim KW. et al. Transcriptome Analysis Reveals Nonfoamy Rather Than Foamy Plaque Macrophages Are Proinflammatory in Atherosclerotic Murine Models. Circulation research. 2018;123:1127-42
54. Willemsen L, de Winther MP. Macrophage subsets in atherosclerosis as defined by single-cell technologies. The Journal of pathology. 2020;250:705-14
55. Holland CH, Tanevski J, Perales-Patón J, Gleixner J, Kumar MP, Mereu E. et al. Robustness and applicability of transcription factor and pathway analysis tools on single-cell RNA-seq data. Genome biology. 2020;21:36
56. Zhang P, Cao L, Zhou R, Yang X, Wu M. The lncRNA Neat1 promotes activation of inflammasomes in macrophages. Nature communications. 2019;10:1495
57. Luo S, Rubinsztein DC. BCL2L11/BIM: a novel molecular link between autophagy and apoptosis. Autophagy. 2013;9:104-5
58. Santos-Gallego CG. MafB and the role of macrophage apoptosis in atherosclerosis: A time to kill, a time to heal. Atherosclerosis. 2016;252:194-6
59. Harman JR, Thorne R, Jamilly M, Tapia M, Crump NT, Rice S. et al. A KMT2A-AFF1 gene regulatory network highlights the role of core transcription factors and reveals the regulatory logic of key downstream target genes. Genome research. 2021;31:1159-73
60. Hsieh TH, Hsu CY, Wu CW, Wang SH, Yeh CH, Cheng KH. et al. Vorinostat decrease M2 macrophage polarization through ARID1A(6488delG)/HDAC6/IL-10 signaling pathway in endometriosis-associated ovarian carcinoma. Biomedicine & pharmacotherapy = Biomedecine & pharmacotherapie. 2023;161:114500
61. Hu Y, Wang X, Song J, Wu J, Xu J, Chai Y. et al. Chromatin remodeler ARID1A binds IRF3 to selectively induce antiviral interferon production in macrophages. Cell death & disease. 2021;12:743
62. Yu G, Li J, Zhang H, Zi H, Liu M, An Q. et al. Single-cell analysis reveals the implication of vascular endothelial cell-intrinsic ANGPT2 in human intracranial aneurysm. Cardiovascular research. 2024: cvae186.
63. Wang Y, Wang GZ, Rabinovitch PS, Tabas I. Macrophage mitochondrial oxidative stress promotes atherosclerosis and nuclear factor-κB-mediated inflammation in macrophages. Circulation research. 2014;114:421-33
64. Wang Y, Liu XY, Wang Y, Zhao WX, Li FD, Guo PR. et al. NOX2 inhibition stabilizes vulnerable plaques by enhancing macrophage efferocytosis via MertK/PI3K/AKT pathway. Redox biology. 2023;64:102763
65. Liu J, Sun Q, Sun M, Lin L, Ren X, Li T. et al. Melatonin alleviates PM(2.5)-triggered macrophage M1 polarization and atherosclerosis via regulating NOX2-mediated oxidative stress homeostasis. Free radical biology & medicine. 2022;181:166-79
66. Weinberg DN, Papillon-Cavanagh S, Chen H, Yue Y, Chen X, Rajagopalan KN. et al. The histone mark H3K36me2 recruits DNMT3A and shapes the intergenic DNA methylation landscape. Nature. 2019;573:281-6
67. Yano S, Ishiuchi T, Abe S, Namekawa SH, Huang G, Ogawa Y. et al. Histone H3K36me2 and H3K36me3 form a chromatin platform essential for DNMT3A-dependent DNA methylation in mouse oocytes. Nature communications. 2022;13:4440
68. Chen G, An N, Shen J, Chen H, Chen Y, Sun J. et al. Fibroblast growth factor 18 alleviates stress-induced pathological cardiac hypertrophy in male mice. Nature communications. 2023;14:1235
69. Beneduce E, Matte A, De Falco L, Mbiandjeu S, Chiabrando D, Tolosano E. et al. Fyn kinase is a novel modulator of erythropoietin signaling and stress erythropoiesis. American journal of hematology. 2019;94:10-20
70. Förstermann U, Xia N, Li H. Roles of Vascular Oxidative Stress and Nitric Oxide in the Pathogenesis of Atherosclerosis. Circulation research. 2017;120:713-35
71. Mauriello A, Sangiorgi GM, Virmani R, Trimarchi S, Holmes DR Jr, Kolodgie FD. et al. A pathobiologic link between risk factors profile and morphological markers of carotid instability. Atherosclerosis. 2010;208:572-80
72. Tomaniak M, Katagiri Y, Modolo R, de Silva R, Khamis RY, Bourantas CV. et al. Vulnerable plaques and patients: state-of-the-art. European heart journal. 2020;41:2997-3004
73. Tesauro M, Mauriello A, Rovella V, Annicchiarico-Petruzzelli M, Cardillo C, Melino G. et al. Arterial ageing: from endothelial dysfunction to vascular calcification. Journal of internal medicine. 2017;281:471-82
74. Robbins CS, Chudnovskiy A, Rauch PJ, Figueiredo JL, Iwamoto Y, Gorbatov R. et al. Extramedullary hematopoiesis generates Ly-6C(high) monocytes that infiltrate atherosclerotic lesions. Circulation. 2012;125:364-74
75. Moore KJ, Sheedy FJ, Fisher EA. Macrophages in atherosclerosis: a dynamic balance. Nature reviews Immunology. 2013;13:709-21
76. Randolph GJ. Proliferating macrophages prevail in atherosclerosis. Nature medicine. 2013;19:1094-5
77. Xue S, Su Z, Liu D. Immunometabolism and immune response regulate macrophage function in atherosclerosis. Ageing research reviews. 2023;90:101993
78. Yan J, Horng T. Lipid Metabolism in Regulation of Macrophage Functions. Trends in cell biology. 2020;30:979-89
79. Stewart CR, Stuart LM, Wilkinson K, van Gils JM, Deng J, Halle A. et al. CD36 ligands promote sterile inflammation through assembly of a Toll-like receptor 4 and 6 heterodimer. Nature immunology. 2010;11:155-61
80. Duewell P, Kono H, Rayner KJ, Sirois CM, Vladimer G, Bauernfeind FG. et al. NLRP3 inflammasomes are required for atherogenesis and activated by cholesterol crystals. Nature. 2010;464:1357-61
81. Grebe A, Hoss F, Latz E. NLRP3 Inflammasome and the IL-1 Pathway in Atherosclerosis. Circulation research. 2018;122:1722-40
82. Mathew AV, Pennathur S. Macrophages, Oxidative Stress, and Atherosclerosis. In: Mackay IR, Rose NR, Diamond B, Davidson A, editors. Encyclopedia of Medical Immunology: Autoimmune Diseases. New York, NY: Springer New York. 2014 p. 693-703
83. Sun L, Yang X, Yuan Z, Wang H. Metabolic Reprogramming in Immune Response and Tissue Inflammation. Arteriosclerosis, thrombosis, and vascular biology. 2020;40:1990-2001
84. Yu EPK, Reinhold J, Yu H, Starks L, Uryga AK, Foote K. et al. Mitochondrial Respiration Is Reduced in Atherosclerosis, Promoting Necrotic Core Formation and Reducing Relative Fibrous Cap Thickness. Arteriosclerosis, thrombosis, and vascular biology. 2017;37:2322-32
85. Semba K, Nishizawa M, Miyajima N, Yoshida MC, Sukegawa J, Yamanashi Y. et al. yes-related protooncogene, syn, belongs to the protein-tyrosine kinase family. Proceedings of the National Academy of Sciences of the United States of America. 1986;83:5459-63
86. Zhao L, Zhang C, Luo X, Wang P, Zhou W, Zhong S. et al. CD36 palmitoylation disrupts free fatty acid metabolism and promotes tissue inflammation in non-alcoholic steatohepatitis. Journal of hepatology. 2018;69:705-17
87. Huang MM, Bolen JB, Barnwell JW, Shattil SJ, Brugge JS. Membrane glycoprotein IV (CD36) is physically associated with the Fyn, Lyn, and Yes protein-tyrosine kinases in human platelets. Proceedings of the National Academy of Sciences of the United States of America. 1991;88:7844-8
88. Li S, Lin Z, Xiao H, Xu Z, Li C, Zeng J. et al. Fyn deficiency inhibits oxidative stress by decreasing c-Cbl-mediated ubiquitination of Sirt1 to attenuate diabetic renal fibrosis. Metabolism: clinical and experimental. 2023;139:155378
89. Everett BM, MacFadyen JG, Thuren T, Libby P, Glynn RJ, Ridker PM. Inhibition of Interleukin-1β and Reduction in Atherothrombotic Cardiovascular Events in the CANTOS Trial. Journal of the American College of Cardiology. 2020;76:1660-70
90. Soehnlein O, Libby P. Targeting inflammation in atherosclerosis - from experimental insights to the clinic. Nature reviews Drug discovery. 2021;20:589-610
91. McGuire DK, Zinman B, Inzucchi SE, Wanner C, Fitchett D, Anker SD. et al. Effects of empagliflozin on first and recurrent clinical events in patients with type 2 diabetes and atherosclerotic cardiovascular disease: a secondary analysis of the EMPA-REG OUTCOME trial. The lancet Diabetes & endocrinology. 2020;8:949-59
92. Zuo Q, He L, Ma S, Zhang G, Zhai J, Wang Z. et al. Canagliflozin Alleviates Atherosclerosis Progression through Inflammation, Oxidative Stress, and Autophagy in Western Diet-fed ApoE-/- Mice. J CVIA. 2024 9
93. Darbousset R, Delierneux C, Mezouar S, Hego A, Lecut C, Guillaumat I. et al. P2X1 expressed on polymorphonuclear neutrophils and platelets is required for thrombosis in mice. Blood. 2014;124:2575-85
Author contact
![]() Corresponding authors: Yuanjing Li, Minghao Luo, and Longxiang Huang. Corresponding address: Department of Cardiovascular Medicine, Cardiovascular Research Center, The First Affiliated Hospital of Chongqing Medical University, No.1 Youyi Road, Yuzhong District, Chongqing, China (400016). E-mail: huanglongxiangcqmu.edu.cn.
Corresponding authors: Yuanjing Li, Minghao Luo, and Longxiang Huang. Corresponding address: Department of Cardiovascular Medicine, Cardiovascular Research Center, The First Affiliated Hospital of Chongqing Medical University, No.1 Youyi Road, Yuzhong District, Chongqing, China (400016). E-mail: huanglongxiangcqmu.edu.cn.