Impact Factor ISSN: 1449-2288




Int J Biol Sci 2027; 23(1):19-41. doi:10.7150/ijbs.133788 This issue Cite
Research Paper
Mitochondria-encoded circRNA mecciRNR2 promotes hepatocellular carcinoma progression by stabilizing HNRNPA1 and suppressing IGFBP3 expression
Juzheng Sui1,*, Jingxin Li1,*, Kang Xie2,*, Liang Shi3, Ge Shan1  , Xu Liu1
1. Department of Obstetrics and Gynecology, The First Affiliated Hospital of USTC, The RNA Institute, School of Basic Medical Sciences, Center for Advanced Interdisciplinary Science and Biomedicine of IHM, Division of Life Science and Medicine, University of Science and Technology of China, Hefei 230027, China.
2. Department of Neurosurgery, Affiliated Lianyungang Hospital of Xuzhou Medical University, Lianyungang, Jiangsu, 222000, China.
3. Department of General Surgery, Sir Run Run Shaw Hospital, School of Medicine, Zhejiang University, Hangzhou, 310016, China.
*Authors contributed equally to this work.
Received 2026-3-2; Accepted 2026-9-17; Published 2027-1-1
Abstract
Circular RNAs (circRNAs) are covalently closed RNA molecules derived from both nuclear and mitochondrial genomes. Mitochondria-encoded circRNAs (mecciRNAs) have been reported to regulate mitochondrial homeostasis and play important roles in physiological and pathological processes. However, their functional significance in hepatocellular carcinoma (HCC) remains largely unknown. Here, we identified mecciRNR2, a mecciRNA derived from the mitochondrial MT-RNR2 gene, which was significantly upregulated in HCC tissues. We provide lines of evidence to show that mecciRNR2 promoted HCC cell proliferation in vitro and tumor growth in vivo. Knockdown of mecciRNR2 expression significantly suppressed HCC growth in nude mice. Mechanistically, mecciRNR2 is predominantly localized in the cytosol, where it directly interacts with the RNA-binding protein HNRNPA1. Binding of mecciRNR2 to HNRNPA1 attenuated the interaction between HNRNPA1 and the E3 ligase TRIM21, thereby preventing TRIM21-mediated ubiquitination and degradation of HNRNPA1. HNRNPA1 bound the 3' untranslated region and promoted the instability of IGFBP3 mRNA, leading to decreased IGFBP3 protein levels and accelerated G1/S cell cycle progression in HCC cells. Our findings reveal a novel cytoplasmic function of mecciRNAs in HCC and identify the mecciRNR2-HNRNPA1-IGFBP3 axis as a novel regulatory pathway driving HCC progression, which may also be a potential therapeutic target for HCC.
Keywords: HCC, circRNA, mitochondria-encoded circRNA, mecciRNR2, HNRNPA1, IGFBP3, proliferation
Introduction
Hepatocellular carcinoma (HCC) is the most prevalent type of primary liver cancer and is associated with high mortality and poor prognosis [1, 2]. Although various therapeutic options for treating HCC are available, the recurrence and metastasis rates are still high, as approximately 80% of HCC patients are diagnosed at an advanced stage [3]. Moreover, the molecular pathogenesis of HCC and effective therapeutic targets are not fully understood. Elucidating the molecular and cellular regulatory mechanisms of HCC will facilitate improved diagnosis, treatment, and prognosis.
Circular RNAs (circRNAs) are a class of single-stranded RNAs generated from both nuclear and mitochondrial genomes [4-6]. Mitochondria-encoded circular RNAs (mecciRNAs) constitute a unique subclass of circRNAs derived from the mitochondrial genome and have been identified across animal species [4-7]. Previous studies have shown that mecciRNAs may be generated independently of canonical splicing and undergo rapid turnover by the SUPV3L1/ELAC2 complex [5-8]. Emerging evidence has implicated specific mecciRNAs in the development and progression of human pathological conditions [6, 8-14]. For instance, mecciND1, mecciND5, and mcPGK1 facilitate mitochondrial protein import and are upregulated in HCC. Moreover, mcPGK1 has been shown to drive hepatocarcinogenesis [6, 9]. SCAR mitigates nonalcoholic steatohepatitis (NASH) by suppressing the release of mitochondrial reactive oxygen species (mROS) [10]. MecciND2 inhibits mROS release and has protective effects on cardiomyocytes and cardiac tissue under heart failure conditions [8]. Despite these findings, the functions and molecular mechanisms of mecciRNAs in HCC remain largely elusive, and their clinical potential as diagnostic biomarkers and therapeutic targets has not been fully explored.
Heterogeneous nuclear ribonucleoproteins (HNRNPs) are a family of RNA-binding proteins (RBPs) that regulate RNA abundance and function and are implicated in multiple diseases, including cancer [15, 16]. Accumulating evidence indicates that circRNAs can exert their biological functions by interacting with diverse HNRNPs. For example, circLARP1B directly binds cytoplasmic HNRNPD, thereby modulating the interaction of HNRNPD with target transcripts such as LKB1 mRNA, leading to reduced mRNA stability and altered downstream pathways involved in HCC metastasis and lipid accumulation [17]. circURI1 suppresses gastric cancer metastasis by directly interacting with hnRNPM and modulating the alternative splicing of genes involved in cell migration [18]. mecciATP6 modulates HNRNPA3 protein abundance to maintain mitochondrial homeostasis [14]. HNRNPA1 is a highly abundant RBP that shuttles between the nucleus and cytoplasm and is involved in multiple aspects of RNA metabolism, including splicing, transcription, translation, and RNA stability [19-21]. HNRNPA1 is upregulated in human HCC tissues and cell lines, and high HNRNPA1 expression is correlated with high recurrence rates and short overall survival [22]. However, the molecular mechanisms underlying the dysregulation of HNRNPA1 expression in HCC remain largely unknown. In an effort to explore the roles of mecciRNAs in HCC, we identified a mecciRNA, mecciRNR2, which is encoded by the mitochondrial gene MT-RNR2 and is significantly upregulated in HCC tissues. High levels of mecciRNR2 promoted HCC cell proliferation in vitro and xenograft tumor growth in mice. mecciRNR2 is predominantly localized in the cytosol and interacts with HNRNPA1. The binding of mecciRNR2 to HNRNPA1 inhibited its ubiquitin-mediated degradation. Stabilized HNRNPA1 bound the 3' untranslated region of IGFBP3 mRNA and decreased its stability, leading to reduced IGFBP3 protein levels and accelerated G1/S cell cycle progression in HCC cells.
Materials and Methods
Clinical samples and RNA isolation
HCC and adjacent tissue samples used for determining the expression levels of mecciRNR2, HNRNPA1, and IGFBP3 were obtained from The First Affiliated Hospital of USTC (2024KY567). An independent cohort of HCC tumor tissues with 5-year follow-up information was obtained from Sir Run Run Shaw Hospital (SRRSHLS2022Y0312). Written informed consent was obtained from all patients included in this study. After surgical resection, tissue samples were washed twice with ice-cold PBS and immediately immersed in RNAlater solution (Invitrogen, AM7021). The samples were incubated overnight at 4℃ to allow complete penetration of the reagent. The RNAlater solution was then removed, and the tissues were stored at -80℃ until RNA extraction. Total RNA was isolated using TRIzol reagent (Invitrogen, 15596018CN) according to the manufacturer's protocol. RNA concentration and purity were determined using a NanoDrop spectrophotometer, and only RNA with an A260/A280 ratio of approximately 2.0 was used for subsequent RT-qPCR analysis. An Agilent Bioanalyzer 2100 was also used to examine the RNA, and RNA samples with an RNA integrity number (RIN) score of 8.0 or higher were used for further studies.
Mice
All animal procedures were approved by the Animal Care and Use Committee of the University of Science and Technology of China (USTCACUC25070124041) and were conducted following the National Institutes of Health Guidelines for the Care and Use of Laboratory Animals. All male BALB/c nude mice were housed under standard conditions in an enriched environment with a 12-h light/dark cycle (lights on from 08:00 to 20:00). The temperature was maintained at 23-25℃, and the relative humidity was maintained between 40 and 60%. The mice were maintained in specific pathogen-free (SPF) housing facilities during the experiments. The mice were randomly grouped for experiments.
Cell culture and transfection
HepG2, PLC/PRF/5 (PLC), and HEK293T cells were obtained from ATCC. All the cell lines were cultured at 37℃ and 5% CO2. All cells were cultured in DMEM supplemented with 10% fetal bovine serum (FBS) and 1% penicillin/streptomycin. All the cell lines were tested by PCR to ensure that there was no mycoplasma contamination.
All plasmids were transfected using Lipofectamine 2000 (Invitrogen, 11668027), and RNA was transfected using Lipofectamine RNAiMAX (Invitrogen, 13778075) according to the manufacturers' instructions.
Mitochondrial isolation from cultured cells and tissue
Mitochondrial isolation from cultured cells was performed according to a previously described method with some modifications [6]. Cells were harvested and washed with PBS, collected by centrifugation, and resuspended in ice-cold isolation buffer 1(225 mM mannitol, 75 mM sucrose, 0.1 mM EGTA, and 20 mM HEPES-KOH, pH 7.4). The suspension was transferred to a Dounce homogenizer and homogenized with 25-35 strokes. The homogenate was subsequently centrifuged at 1 500 × g for 5 min at 4 °C to remove the nuclei. The supernatant was carefully collected and further centrifuged at 12 000 × g at 4 °C to pellet the mitochondria. At this step, a yellow mitochondrial pellet was visible at the bottom of the tube. The pellet was subsequently washed once with IB-2 buffer (225 mM mannitol, 75 mM sucrose, and 20 mM HEPES-KOH, pH 7.4). The pellet was then resuspended in 200 μL of IB-2 buffer for the subsequent experiments.
Mitochondrial isolation from tissues was performed according to a previously described method with some modifications [6]. The tissues were subsequently washed with ice-cold IB-1 buffer (225 mM mannitol, 75 mM sucrose, 0.5% BSA, 0.5 mM EGTA, and 20 mM HEPES-KOH, pH 7.4). The samples were then cut into small pieces in ice-cold IB-3 buffer (225 mM mannitol, 75 mM sucrose, and 20 mM HEPES-KOH, pH 7.4). After mincing, the tissues were washed once more with 10 mL of fresh ice-cold IB-1 buffer. The tissue fragments were resuspended in IB-1 buffer at a ratio of 4 mL per gram of tissue and then transferred to a glass tissue homogenizer for homogenization. The resulting homogenate was further homogenized in a Dounce homogenizer with 25-35 strokes. All subsequent centrifugation steps were performed as described for isolation of mitochondria from cultured cells.
PCR
RNA was extracted using TRIzol reagent according to the manufacturer's instructions. For RT-PCR analysis, cDNA was synthesized from total RNA using the ABScript II cDNA First-Strand Synthesis Kit (ABclonal, RK20400) following the manufacturer's protocol. For PCR assays using genomic DNA (gDNA) as a template, gDNA was isolated by phenol-chloroform extraction. Real-time quantitative PCR (RT-qPCR) was performed using Genious 2× SYBR Green Fast qPCR Mix (ABclonal, RM21204) on a QuantStudio 3 Real-time PCR system (Thermo Scientific) according to standard procedures. For semi-quantitative RT-PCR, PCR amplification was performed for 30-40 cycles. All the PCR products were confirmed by Sanger sequencing. The primer sequences are listed in Table S4.
RNA-sequencing (RNA-seq) and bioinformatics analysis
RNA-seq library construction was conducted using the VAHTS Universal V10 RNA-seq Library Prep Kit for Illumina (Vazyme, NR606). Briefly, total RNA or mitochondrial RNA was extracted with TRIzol reagent, and ribosomal RNA (rRNA) was depleted using a Ribo-off rRNA Depletion Kit (Vazyme, N406-01). The rRNA-depleted RNA was fragmented at 95 °C and subsequently subjected to first-strand cDNA synthesis with random primers. Strand specificity was achieved by the incorporation of dUTP into the dNTP mixture during second-strand cDNA synthesis. Following end repair, dA-tailing, and adaptor ligation, the final RNA-seq libraries were generated by PCR amplification coupled with USER enzyme (NEB, M5505S) treatment. The libraries were then subjected to 150-nt paired-end sequencing, generating approximately 30 million read pairs with an Illumina NextSeq 500 system (Novogene, China).
For mecciRNA prediction, clean reads trimmed with Cutadapt (v4.4) were aligned to the human genome (hg38), and back-splicing events were identified using find_circ [23]. CircRNAs derived from chrM were annotated as mecciRNAs. For the identification of linear transcripts, clean reads were aligned to the reference genome using HISAT2 (v2.2.1) and read counts for each gene were calculated with featureCounts (v2.0.3). Differentially expressed candidates of mecciRNAs and linear transcripts were identified using DESeq2 with the criteria of |log2 (fold change)| > 1 and P < 0.05.
Northern blotting
Northern blotting was performed as previously described [24]. DIG-labeled RNA probes targeting the circular junction of mecciRNR2 were synthesized in vitro using a DIG Northern Starter Kit (Roche, 12039672910) following the manufacturer's instructions. Total RNA (5 µg), with or without RNase R treatment, was loaded onto an 8% urea-PAGE gel. The RiboRuler Low Range RNA Ladder (NEB, N0364S) was used as the size marker. Electrophoresis was conducted in 1× TBE buffer for 1 h. Following separation, RNA was transferred onto Hybond-N+ membranes (cytiva, RPN303B) by electroblotting. The membranes were subsequently UV-crosslinked and hybridized with specific DIG-labeled probes according to the protocol of the DIG Northern Starter Kit (Roche, 12039672910). Images were captured using an ImageQuant LAS4000 Biomolecular Imager (GE Healthcare).
RNase R treatment
For RNase R treatment, 5 µg of total RNA was incubated with 8 U of RNase R (Epicenter, RNR07250) at 37 °C for 40 min. The reaction was terminated by the addition of 0.5 M EDTA followed by incubation at 70 °C for 5 min. The RNA was then purified via alcohol precipitation.
Single molecule fluorescence in situ hybridization (smFISH)
smFISH was performed as previously described with minor modifications [25]. A pair of probes spanning the junction of mecciRNR2 was designed for smFISH analysis in cultured cells and tissue sections. Cells or tissues were fixed with 4% PFA for 10 min at 25 °C and permeabilized with ice-cold 70% ethanol for 8 h at -20 °C. For hybridization, cells or tissues were washed twice with 2× SSC and then prehybridized for 30 min at 37 °C in hybridization buffer (30% formamide, 5× SSC, 9 mM citric acid (pH 6.0), 0.1% Tween-20, 50 µg/mL heparin, 1× Denhardt's solution, and 10% dextran sulfate). The samples were subsequently hybridized with 2 pmol of probes in hybridization buffer at 37 °C overnight. For the amplification step, 18 pmol of hairpins was heated at 95 °C for 90 s and then cooled to room temperature for 30 min in the dark. Denatured hairpins were incubated with the samples overnight at room temperature. After incubation, the samples were washed three times for 5 min each with 2× SSC buffer. The sections were then stained with DAPI for 10 min, followed by three 5-min washes with 2× SSC buffer. Images were captured using a Zeiss LSM980 laser confocal microscope, and signal intensity was quantified with ImageJ. Probe sequences are listed in Table S4.
Quantification of mecciRNR2 copy number per cell
PCR products spanning the junction site of mecciRNR2 were amplified using divergent primers, purified by gel extraction, and quantified using a NanoDrop spectrophotometer. Serial dilutions of the purified PCR products were subjected to quantitative PCR to generate a standard curve correlating DNA mass with Ct values. Total RNA from 1×10⁶ HepG2 or PLC cells was isolated and subjected to reverse transcription. cDNA was subsequently analyzed by RT-qPCR using the same divergent primers. The DNA-equivalent mass of mecciRNR2 in each sample was determined according to the standard curve and converted to an RNA copy number using the following formula: Copies per cell = (DNA mass (g) × 6.022 × 10²³) / (amplicon length (bp) × 660 × cell number).
Construction of plasmids and stable cell lines
All plasmids were constructed via restriction enzyme digestion and ligation (Promega, A3600) or recombinant cloning (Vazyme, C113-02). MecciRNR2 overexpression is mediated by inverted complementary flanking sequences [26]. The HNRNPA1-binding motif mutant mecciRNR2 (mecciRNR2mut) was generated by PCR-based site-directed mutagenesis using the wild-type mecciRNR2 overexpression plasmid as the template, in which the predicted HNRNPA1-binding motif "CGAGGG" was substituted with "ATGTTT". The pCDH-EF1-FHC vector (Addgene, 64874) was used to generate HNRNPA1 and IGFBP3 overexpression plasmids. Short hairpin RNAs (shRNAs) targeting the junction site of mecciRNR2 were cloned and inserted into the pLKO.1 puro vector (Addgene, 8453). shRNAs targeting HNRNPA1, IGFBP3, and a nontargeting negative control (shNC, MFCD07785395) were obtained from the Sigma MISSION shRNA Library. The primer and shRNA sequences are listed in Table S4.
Stable cell lines were subsequently established via lentiviral infection. Briefly, knockdown or overexpression plasmids were cotransfected into HEK293T cells with the packaging plasmids psPAX2 and pMD2.G at a ratio of 4:3:1 using Lipofectamine 2000 according to the manufacturer's instructions. After 48 h of transfection, the culture supernatant was collected, centrifuged to remove cell debris, and filtered through a 0.45 μm filter to obtain the lentiviral suspension. PLC or HepG2 cells were infected with a lentiviral suspension supplemented with 5 μg/mL polybrene. Stable cell lines were then selected with 2 μg/mL puromycin for 2 weeks.
Nascent RNA pulldown
The enrichment of nascent RNA was performed according to the previously described method [8]. In brief, newly synthesized RNA was labeled with 0.25 mM 5-ethynyluridine (EU) for 8 h. The cells were subsequently washed three times with cold DPBS, fixed with 90% ice-cold ethanol for 30 min on ice, and permeabilized with cold DPBS containing 0.5% Triton X-100 on ice. Newly synthesized RNA was subsequently conjugated to azide-labeled biotin in click reaction solution (DPBS containing 2.5 mM biotin-azide, 3 mM CuSO4, 6 mM THPTA, 10 mM aminoguanidine, and 50 mM sodium L-ascorbate) under cold conditions. The cells were then washed three times with cold 0.5% Triton X-100 in PBS containing 2 mM EDTA to terminate the click reaction. Cells were then lysed in lysis buffer (20 mM Tris-HCl (pH 7.5), 500 mM LiCl, 1 mM EDTA, 0.5% lithium dodecyl sulfate, 5 mM DTT, 1× protease inhibitor mixture, and 0.1 U/μL RNase inhibitor) and homogenized using a 0.4-mm-diameter needle. The lysate was centrifuged at 12,000 × g for 10 min at 4 °C, and the supernatant was collected and incubated with streptavidin-conjugated magnetic beads (Invitrogen) under rotation for 4 h at 4 °C. The magnetic beads were subsequently washed five times, and the enriched RNA was isolated using TRIzol reagent.
In vitro synthesis of circRNAs
A specialized DNA template for circular RNA production was designed by inserting a self-splicing intron from the T4 td gene downstream of the T7 promoter. In vitro transcription was performed using a TranscriptAid T7 High Yield Transcription Kit (Thermo Scientific, K0441), which included 5 μL of T7 RNA polymerase, 1 mM ATP, 1 mM CTP, 1 mM UTP (UTP/biotin-UTP mixture for biotin-labeled transcription), 0.25 mM GTP, 2 mM GMP, 4 μL of transcription buffer, and 0.5 μL of RNA inhibitor. The mixture was incubated at 37 °C for 4 hours. After DNase I treatment, the transcribed linear precursor RNA was purified using TRIzol Reagent. The purified linear RNA was incubated in 1× circularization buffer (15 mM MgCl2, 1 mM DTT, 50 mM Tris-HCl; pH 7.5) at 55 °C for 20 minutes for circularization. The reaction products were treated with RNase R (5 U/µg RNA) at 37 °C for 30 minutes to remove linear RNA intermediates. The size and quality of the purified circRNAs were verified using 8% urea-denaturing polyacrylamide gels.
Electrophoretic mobility shift assay (EMSA)
The EMSA was performed as previously described with a few modifications. RNA was incubated at 90 °C for 3 min and then cooled to room temperature for 10 min. MgCl₂ and Na-HEPES buffer (final concentrations: 10 mM MgCl₂ and 50 mM Na-HEPES, pH 8.0) were added to the solution, followed by incubation at 50 °C for 20 min. The RNA was then cooled to room temperature for 10 min. HNRNPA1 protein was mixed with 10 pmol of folded RNA at protein-to-RNA molar ratios of 0:1, 1:1, and 10:1 in incubation buffer (10 mM Tris-HCl, pH 7.5, 50 mM KCl, 1 mM MgCl₂, 1 mM DTT, 0.1% Triton X-100, and 5% glycerol) and incubated at 37 °C for 15 min. Finally, the samples were analyzed on a nondenaturing polyacrylamide gel.
Cell proliferation, colony formation, and cell cycle analysis
For cell proliferation assays, the indicated cells were plated in 96-well plates at an initial density of 1000 cells per well, with six replicates per treatment group. Cell viability was subsequently measured using a Cell Counting Kit-8 (BIOMIKY, MK001B) in accordance with the manufacturer's instructions.
For the colony formation assays, the cells were plated in 6-well plates at a density of 500 cells per well. After two weeks of culture, the cells were fixed and stained for 10 minutes at room temperature using a 0.1% crystal violet solution (Sigma, C3886) prepared in methanol. The stained colonies were then photographed, and the colony formation efficiency was determined by quantifying the number of viable colonies.
The cell-cycle distribution of the indicated cells was analyzed using a Cell Cycle Analysis Kit (KeyGEN BioTECH, KGA9101) in accordance with the manufacturer's instructions. Briefly, cells were collected and fixed in 80% ethanol at -20 °C overnight, followed by RNase A treatment and propidium iodide (PI) staining. Flow cytometry analysis (BECKMAN, CytoFLEX) was subsequently performed, and the percentage of cells in the G0/G1, S, and G2/M phases was calculated using the cell cycle analysis tool of CytExpert software (v2.4).
Western blotting
For Western blotting, the samples were separated on SDS-PAGE gels and then transferred to a nitrocellulose membrane. The membranes were processed according to the ECL Western blotting protocol (Thermo, 32106). The following antibodies were used for Western blotting: anti-HNRNPA1 (Sigma‒Aldrich, R4528), anti-ERp70 (Proteintech Group, 14712-1-AP), anti-TIM23 (Proteintech Group, 11123-1-AP), anti-histone H3 (Signalway Antibody, 21137), anti-CHK1 (Proteintech Group, 25887-1-AP), anti-CDK1 (Proteintech Group, 19532-1-AP), anti-CCND1 (Proteintech Group, 60186-1-Ig), anti-P21 (Proteintech Group, 10355-1-AP) and anti-ACTB (TransGen, HC201). Signal intensity quantification and grayscale analysis were performed using ImageJ.
ELISA
ELISA was performed using the Human HNRNPA1 ELISA Kit (FineTest, EH9162) in accordance with the manufacturer's instructions. The tissues were placed on ice and washed with PBS (pH = 7.4). The tissues were disrupted by ultrasonication to obtain tissue lysates, and the protein concentration was adjusted to 1 mg/mL. One hundred microliters of test sample or diluted standard was added to the ELISA plate and incubated at 37 °C for 90 min. After washing the plate twice, 100 μL of the biotin-antibody working solution was added and incubated at 37 °C for 60 min. After the plate was washed three times, 100 μL of the SABC working solution was added and incubated at 37 °C for 30 min. After the plate was washed five times, 90 μL of TMB substrate was added and incubated at 37 °C in the dark for 10 min, followed by the addition of 50 μL of stop solution. The absorbance at 450 nm was measured using a microplate reader. A standard curve was generated using the OD values of the diluted standards, and the sample concentrations were calculated according to the standard curve.
Nude mouse xenograft model
A modified in vivo xenograft model was established on the basis of a previously reported protocol [27]. Male nude mice (purchased from Beijing Biotechnology Co. Ltd., SPF grade) were group-housed and allowed a one-week acclimatization period in the SPF animal facility. Throughout the experiment, the mice had free access to standard chow and drinking water. HepG2 cells were subjected to different experimental manipulations, including mecciRNR2 knockdown (and its corresponding control), mecciRNR2 overexpression, and mecciRNR2mut overexpression (and their controls). For each treatment group, 5×10⁶ cells were resuspended in 100 μL of PBS supplemented with 20% Matrigel (BD Biosciences, 356234) and subcutaneously injected into 4-week-old male nude mice, which were randomly allocated to each experimental group. Tumor measurements were performed every four days beginning 15 days post-injection, and tumor volume was computed using the formula: V = 1/2 × longer diameter × (shorter diameter)2. Approximately 47 days after subcutaneous injection, the mice were euthanized in strict accordance with ACUC guidelines.
Immunohistochemistry (IHC)
For IHC staining, paraffin sections from murine tissues were first deparaffinized with xylene. The sections were then rehydrated through a graded series of ethanol (100%, 95%, 80%, and 70%) for 5 min each. The samples were incubated with primary antibodies against Ki-67 (Proteintech, 27309-1-AP) and HNRNPA1 (Sigma, R4528) at 4 °C overnight. After being washed, the samples were incubated with secondary antibodies at room temperature for 1 h. The nuclei were counterstained with hematoxylin. Images were captured using an inverted microscope (Olympus, IX73). Immunoreactivity was evaluated using a semiquantitative scoring system. The immunoreactive scores were calculated as follows: immunoreactive score = intensity score × proportion score [28]. Intensity scores were defined as 0 (negative), 1 (weak), 2 (moderate), and 3 (strong). The proportion scores were as follows: 1 (0-25%), 2 (25%-50%), 3 (50%-75%), 4 (75%-100%). The final IHC scores ranged from 0 to 12. The IHC scores of the tumor tissue were calculated by two experienced researchers.
Hematoxylin and eosin (H&E) staining
The subcutaneous xenograft tumor tissues were soaked in 10% formalin, dehydrated with graded alcohols, and then embedded in paraffin wax for sectioning. The paraffin sections were deparaffinized and rehydrated after being immersed in xylene. An H&E Staining Kit (Abcam, ab245880) was used for H&E staining. Images were captured using an Olympus IX73 inverted fluorescence microscope.
APEX
APEX was performed as previously described with minor modifications [8]. For mitochondrial matrix labeling, PLC cells were incubated with 500 μM biotin-phenol (APExBIO, A8011) at 37 °C for 30 min. Labeling was initiated by adding 1 mM H₂O₂ and incubating at room temperature for 1 min. The reaction was quenched by treating the samples with 2 mL of quenching solution (10 mM ascorbate and 5 mM Trolox in PBS) for 1 min. The cells were then lysed in 1 mL of strong RIPA buffer (50 mM Tris-HCl (pH 8.0), 150 mM NaCl, 5 mM EDTA, 1% NP-40, 0.1% SDS, and 0.5% sodium deoxycholate), and 50 µL of M-280 Streptavidin Dynabeads (Invitrogen, 11206D) was added to the lysates. The mixture was incubated at room temperature for 2 h with gentle rotation. After three washes with RIPA buffer, the beads were resuspended in 60 µL of 2 × SDS loading buffer containing 20 mM DTT and 2 mM biotin. The samples were boiled at 95 °C for 15 min. The protein samples were then subjected to Western blotting analysis.
Immunofluorescence (IF) combined with fluorescence in situ hybridization (FISH)
IF combined with FISH was performed as previously described with minor modifications [17]. PLC and HepG2 cells were washed twice with PBS and fixed with methanol/glacial acetic acid (3:1, v/v) for 10 min at room temperature. The cells were then permeabilized on ice for 20 min with freshly prepared PBS supplemented with 0.01% Triton X-100 (v/v) and 0.1 U/µL RNase inhibitor (Promega, N2615). After blocking with 1% BSA for 30 min at room temperature, the samples were incubated with an anti-HNRNPA1 antibody (Sigma‒Aldrich, R4528; 1:200 dilution in 1% BSA) for 3 h at room temperature. Following three 5-min washes with PBST buffer (PBS containing 0.1% Tween-20), the samples were incubated with Alexa Fluor 488-conjugated goat anti-mouse IgG secondary antibody (Invitrogen, A10040; 1:200 dilution in 1% BSA) for 2 h at room temperature in the dark. For additional RNA FISH, RNA probes generated with the Transcript Aid T7 High Yield Transcription Kit (Thermo Fisher Scientific, K0441) and subsequently labeled with Alexa Fluor 546 using the ULYSIS Nucleic Acid Labeling Kit were denatured at 80 °C for 5 min and immediately placed on ice. After two washes with PBST buffer and one wash with 2× SSC in the dark, the samples were incubated with an RNA hybridization mixture containing 0.1 μg/μL RNA probes, 20 ng/μL human Cot-1 DNA (Invitrogen, 15279011), 500 ng/μL yeast total RNA (Invitrogen, AM7118) and 0.1 U/µL RNase inhibitor in 2× hybridization buffer (4× SSC, 40% dextran sulfate) at 37 °C for 12 h. The slides were subsequently washed with 2× SSC containing 0.1% Triton X-100 at 45 °C. Nuclei were counterstained with DAPI, and images were captured using a Zeiss LSM980 laser confocal microscope. Signal intensity was quantified using ImageJ, and the colocalization efficiency of the HNRNPA1 protein and mecciRNR2 was quantified using the Coloc2 plugin of ImageJ.
RNA pulldown
An RNA pulldown assay with 5'-biotinylated antisense oligos was performed as previously described with minor modifications [17]. Briefly, cells were cross-linked for 2 min in a UV cross-linker (UVP) at an energy of 120 mJ/cm2. The cross-linked cells were lysed on ice for 10 min in RIPA buffer (50 mM Tris-HCl (pH 8.0), 150 mM NaCl, 5 mM EDTA, 1% NP-40, and 0.1% SDS) supplemented with 2 mM DTT, 1× protease inhibitor cocktail (TransGen, DI111), and 200 units/mL RNase inhibitor. The lysates were sonicated on ice for 10 min using a Sonics Vibra-Cell (3 s on, 6 s off, 30%), and the supernatant was collected after centrifugation at 12 000 × g for 5 min at 4 °C. One hundred pmol of biotinylated antisense (AS) oligonucleotides was added to the supernatants, and the mixtures were incubated with end-to-end rotation at room temperature for 2 h. M-280 streptavidin Dynabeads (50 μL) preblocked with 500 ng/µL yeast tRNA and 500 ng/µL BSA for 1 h at room temperature were added to each sample. The mixtures were further rotated for 2 h at room temperature. Beads were captured using magnetic stands (Life Technologies) and washed twice with RIPA buffer, followed by two washes with high-salt RIPA buffer (50 mM Tris-HCl (pH 8.0), 500 mM NaCl, 5 mM EDTA, 1% NP-40, and 0.1% SDS). The purified RNAs were analyzed by RT‒qPCR. Purified proteins were subjected to silver staining using a Protein Stains K kit (Sangon Biotech, C500021), followed by mass spectrometry (MS) analysis or direct Western blotting. The mecciRNR2 antisense oligonucleotide probe was designed to hybridize specifically to the junction of mecciRNR2. The probe sequences are listed in Table S4.
RNA immunoprecipitation (RIP) and RIP-seq
The RIP assay was performed as previously described with a few modifications [6]. Cell lysates were prepared using the same protocol as for the RNA pulldown assay. After centrifugation at 12 000 × g for 5 min at 4 °C, the supernatant was incubated with an anti-HNRNPA1 antibody (Sigma-Aldrich, R4528) or isotype-matched IgG (Proteintech Group, B900620) for at least 4 h at room temperature. Dynabeads Protein G (Thermo Fisher Scientific, 10004D) were blocked with 500 ng/µL yeast tRNA and 500 ng/µL BSA at room temperature for more than 30 min. The blocked beads were then added to the lysate-antibody mixture and incubated for 2 h at room temperature with gentle rotation. The beads were collected following two washes with RIPA buffer and two additional washes with high-salt RIPA buffer. Purified proteins were subjected to Western blotting, and coimmunoprecipitated RNA was purified using TRIzol reagent.
For RIP-seq cDNA library construction, the purified RNAs were ligated to sequencing adapters, reverse-transcribed, and PCR-amplified, followed by paired-end high-throughput sequencing on an Illumina NovaSeq platform with a 150-nt read length. For data analysis, sequencing adapters were first trimmed to obtain clean reads, which were subsequently mapped to the human genome (hg38) using Bowtie2. After alignment, duplicate reads were removed, and MACS2 was used for peak calling. The genomic distribution of HNRNPA1 RIP-seq signals was annotated on the basis of the gene transfer format (GTF) file from the UCSC database.
Treatment of cells with MG132 and CHX
For the MG132 treatment, the cells were grown to approximately 80% confluence and then treated with 50 μM MG132 for 8 h at 37 °C and 5% CO2 before they were harvested. For CHX treatment, the cells were grown to approximately 80% confluence and then treated with 50 μg/mL CHX for the indicated time point before being harvested.
Examination of ubiquitination
To explore the level of protein ubiquitination, the cells were treated with 50 μM MG132 for 8 h. The cells were harvested, lysed, and incubated with an anti-HNRNPA1 (Sigma-Aldrich, R4528) antibody at room temperature for 4 h. After incubation, protein G Dynabeads were added and rotated at room temperature for 2 h. The immunoprecipitation products were used for Western blotting to measure the level of protein ubiquitination (HA antibody, Proteintech, 51064-2-AP). All quantifications of ubiquitination were normalized to those of immunoprecipitated HNRNPA1.
Dual luciferase reporter assay
The full-length IGFBP3 3′ UTR sequence was inserted as the 3′ UTR of firefly luciferase into the pGL3 vector (Promega, HG-VQP0122). A vector expressing Renilla luciferase was used as a loading control. At 48 h post-transfection, the cells were washed three times with PBS and lysed with 100 μL of cell lysis buffer (Promega, E1910) for 10 min at 25 °C. The lysate was then centrifuged at 12 000 × g for 10 min at 4 °C, and 10 μL of the supernatant from each sample was used to determine firefly and Renilla luciferase activities using the Dual-Luciferase Reporter Assay System (Promega, E1910) on a GloMax detection system (Promega), according to the manufacturer's instructions.
KEGG pathway enrichment analysis
KEGG pathway enrichment analysis was performed using the Metascape online platform (https://www.metascape.org), and the results were visualized with the bioinformatics online toolkit (https://www.bioinformatics.com.cn).
Image processing
All IF and FISH images were taken by an LSM 980 confocal microscope (Zeiss) with a 63×1.40 NA oil-immersion objective. All images of the IHC and H&E staining were taken with an inverted fluorescence microscope IX73 (Olympus). Image processing and quantification were performed using ImageJ.
Statistical analysis
Statistical analyses were performed using GraphPad Prism 9.0 software. Student's t-test or two-way ANOVA was used to calculate P values, as specified in the figure legends. For the Student's t-test, the data are presented as the mean±standard deviation (SD) in the graphs. Statistical significance was set at P < 0.05. Detailed statistical methods applied to each experiment, as well as the sample size (n), are provided in the corresponding figure legends.
Results
Identification and characterization of mecciRNR2 in HCC
To investigate the expression landscape of mecciRNAs in HCC, we isolated mitochondria from three paired HCC tissues and adjacent nontumorous tissues (paraHCC) to enrich mitochondrial RNA and then performed RNA sequencing (RNA-seq). The purity of the isolated mitochondria was confirmed by RT-qPCR analysis of ACTIN (indicating cytoplasmic enrichment) and U6 (indicating nuclear enrichment), which revealed minimal cytoplasmic and nuclear contamination (Fig. S1A). A total of 68 mecciRNAs were detected by RNA-seq and subsequent analysis, of which seven were significantly upregulated (fold change > 2, P-value < 0.05) in HCC tissues, and no significantly downregulated mecciRNAs were detected (Fig. 1A). Only a small subset exhibited differential regulation, possibly due to interpatient heterogeneity in clinical samples. Among the upregulated mecciRNAs, mecciRNR2 showed the greatest fold change and the most significant difference between HCC and paraHCC (Fig. 1A). We therefore focused on mecciRNR2 for further investigation.
Characterization of mecciRNR2 in HCC cells and tissues. A Volcano plot illustrating differential changes of mecciRNAs in the mitochondria of three HCC tissues and three adjacent non-tumor tissues (paraHCC). Red dots represent significantly upregulated (P < 0.05 and log2foldchange > 1) mecciRNAs. B PCR with divergent and convergent primers for the verification of mecciRNAs using total cellular RNA from HepG2 cells. GAPDH mRNA, negative control; g+mtDNA, nuclear and mitochondrial DNA; RT, reverse transcription. The genomic position of mecciRNR2 is shown. The junction site of mecciRNR2 is confirmed by Sanger sequencing. C Northern blotting of mecciRNR2 using total cellular RNA from PLC and HepG2 cells with or without RNase R treatment. ACTIN serves as a loading control. D, E RT-qPCR analysis of mecciRNR2 using total cellular RNA from PLC (D) and HepG2 (E) cells treated with actinomycin D for the indicated period. n=3 independent experiments. F, G RT-qPCR analysis of the cellular distributions of mecciRNR2 and MT-RNR2 in PLC (F) and HepG2 (G) cells. ACTIN, cytoplasmic marker. n=3 independent experiments. H, I Representative single-molecule fluorescence in situ hybridization (smFISH) images of mecciRNR2 in PLC (H) and HepG2 (I) cells. The enlarged areas showed the distribution of mecciRNR2 in the cytoplasm (labeled by number 1) and in the mitochondria (labeled by number 2). Mitochondria are labeled by MitoTracker. Scale bar, 10 μm and 2 μm (enlarged areas). J Representative smFISH image and quantification of mecciRNR2 in HCC specimens. Scale bar, 20 μm. n=20 views. K Northern blotting analysis of mecciRNR2 in total RNA isolated from HCC and paired paraHCC tissues. ACTIN serves as a loading control. L RT-qPCR detecting mecciRNR2 levels from 16 pairs of HCC and paraHCC tissues. M, N Kaplan-Meier analysis of overall survival (M) and disease-free survival (N) for 100 patients with HCC. Patients were separated by the median expression level of mecciRNR2. O Multivariate Cox regression analysis of overall survival for 95 patients (because TNM stage information was unavailable for five of the 100 HCC patients) with HCC with available follow-up data. Variables included mecciRNR2 expression status, age, sex, HBV infection status, and TNM stage (III-IV vs. I-II). In D, E, F, G, J, and L, data are shown as mean±SD. P-values are from two-tailed Student's t-tests (F, G, J, L), the log-rank test (M, N), and Wald test (O). ns, not significant; **P < 0.01; ***P < 0.001.
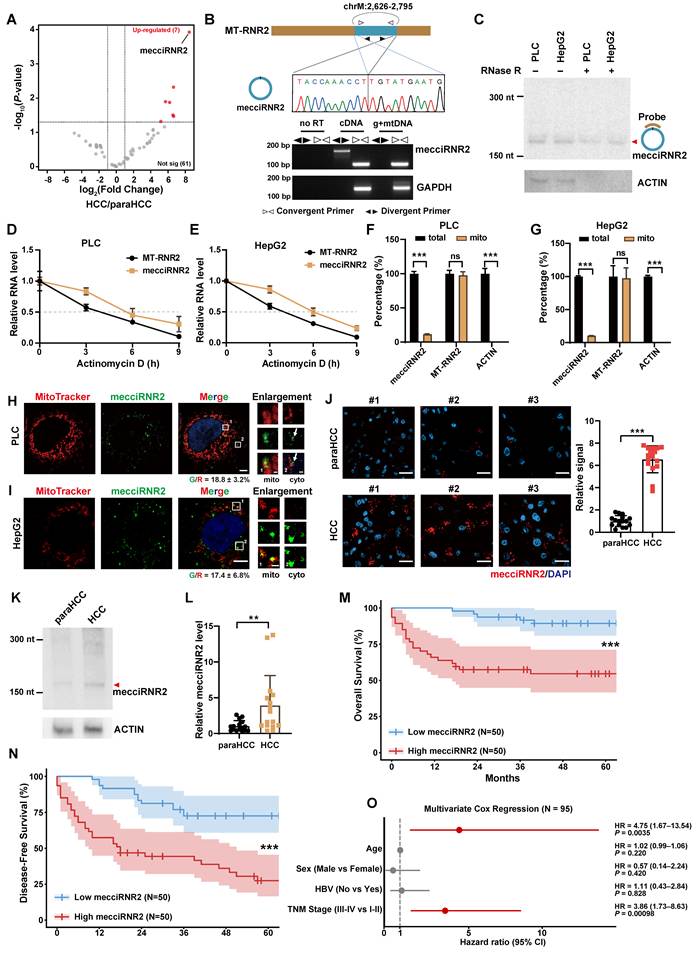
MecciRNR2 is derived from an internal region of the MT-RNR2 gene and corresponds to the mitochondrial heavy-strand sequence. The putative junction fragment of mecciRNR2 was verified by PCR amplification with divergent primers and further confirmed by Sanger sequencing (Fig. 1B). RNase R digestion and Northern blotting confirmed the circular nature and full length of mecciRNR2 in PLC and HepG2 cells (Fig. 1C, Fig. S1B and C). For comparison, the delta-Ct value of mecciRNR2 (Ct-mecciRNR2 minus Ct-ACTIN) from RT-qPCR was approximately 6 in both HepG2 and PLC cells. Approximately 156 and 101 copies of mecciRNR2 per cell were detected in HepG2 and PLC cells, respectively (Fig. S1D). Circular RNAs with copy numbers exceeding 100 per cell are generally considered highly abundant, suggesting that mecciRNR2 is a high-abundance circRNA [29]. Following transcriptional inhibition with actinomycin D (a compound that suppresses transcription in both mitochondria and the nucleus) [29], the half-life of mecciRNR2 was determined to be approximately 6 h (Fig. 1D and E). In contrast to the linear counterpart MT-RNR2, which was confined to mitochondria, mecciRNR2 was detected both within and outside mitochondria, with only 10-20% of the mecciRNR2 localized to mitochondria and the majority present in the cytosol of both PLC and HepG2 cells (Fig. 1F and G; Fig. S1E and F). Furthermore, single-molecule RNA fluorescence in situ hybridization (smFISH) demonstrated that the signals of mecciRNR2 partially colocalized with those of mitochondria in both HCC cell lines (Fig. 1H and I), and a substantial fraction of mecciRNR2 was located outside of the mitochondria, predominantly in the cytosol (Fig. 1H and I).
To investigate the clinical relevance of mecciRNR2, we performed smFISH, Northern blotting, and RT-qPCR analyses on clinical HCC samples and observed that mecciRNR2 expression was significantly upregulated in HCC tissues compared with adjacent nontumor tissues (Fig. 1J-L). In contrast, no significant difference in MT-RNR2 expression was observed between HCC tissues and adjacent nontumor tissues (Fig. S1G). To further evaluate the prognostic value of mecciRNR2, its expression was assessed by RT-qPCR in a cohort of 100 patients with HCC with available follow-up data (Table S1), and patients were stratified into high- and low-expression groups according to their mecciRNR2 levels. A Kaplan-Meier survival analysis revealed that patients with higher mecciRNR2 expression levels in tumors had significantly shorter overall survival (OS) and disease-free survival (DFS) than those with low mecciRNR2 expression levels (Fig. 1M and N). Because TNM stage information was unavailable for five of the 100 HCC patients, Cox regression analyses were performed for the remaining 95 patients. High mecciRNR2 expression was associated with poorer overall survival in univariate analysis and remained an independent predictor in multivariable analysis (Fig. 1O and Fig. S1H). Collectively, these results indicate that mecciRNR2 is highly expressed in HCC and may serve as a potential prognostic biomarker for HCC.
MecciRNR2 promotes HCC cell proliferation
To further elucidate the function of mecciRNR2 in HCC, we used shRNAs targeting the mecciRNR2 junction region to generate stable mecciRNR2-knockdown cell lines (Fig. 2A and B). The steady-state and nascent transcript levels of the linear counterpart MT-RNR2 remained unchanged following mecciRNR2 knockdown (Fig. S2A and B). CCK-8 assays revealed that knockdown of mecciRNR2 reduced the proliferation of both PLC and HepG2 cells (Fig. 2C and D). Consistently, colony formation assays in PLC cell lines demonstrated a marked impairment in long-term clonogenic capacity following mecciRNR2 knockdown (Fig. S2C). Furthermore, cell cycle analysis by flow cytometry revealed a significant increase in the G0/G1 population, which was accompanied by a corresponding reduction in the S and G2/M populations, indicating that G1/S phase arrest occurred upon mecciRNR2 knockdown (Fig. 2E and F).
Knockdown of mecciRNR2 suppresses HCC cell proliferation. A, B RT-qPCR validation of mecciRNR2 expression in total RNA from stable mecciRNR2-knockdown PLC (A) and HepG2 (B) cells. Stable mecciRNR2-knockdown cells are constructed with short hairpin RNA (shRNA). shNC, shRNA with scrambled sequences; shmecciRNR2-1, shmecciRNR2-2, two shRNAs against the junction sites of mecciRNR2. C, D CCK-8 assays showing cell proliferation in PLC (C) and HepG2 (D) cells upon mecciRNR2 knockdown. E, F Cell-cycle distribution determined by flow cytometry for PLC (E) and HepG2 (F) cells upon mecciRNR2 knockdown. G Stable mecciRNR2-knockdown or control HepG2 cells were subcutaneously injected into 4-week-old male nude mice. Tumor growth was monitored by measuring tumor volumes starting 15 days after tumor inoculation. H Images and weight of xenograft tumors after subcutaneous injection of stable mecciRNR2-knockdown HepG2 cells into nude mice. I Representative smFISH image and quantification of mecciRNR2 in xenograft tumors. Scale bar, 20 μm. J Representative immunohistochemistry (IHC) images of Ki-67 protein and the quantification of IHC in xenograft tumors. The details for IHC score calculation are included in the Methods. Scale bar, 50 μm. In A-J, data are shown as mean±SD. n=3 independent sample (A, B, E, F), n=6 experimental replicates for each cell line (C, D), n=5 mice for each group (G-J). P-values are from two-tailed Student's t-tests (A, B, E, F, H-J) and two-way ANOVA (C, D, G); ns, not significant; *P < 0.05; **P < 0.01; ***P < 0.001.
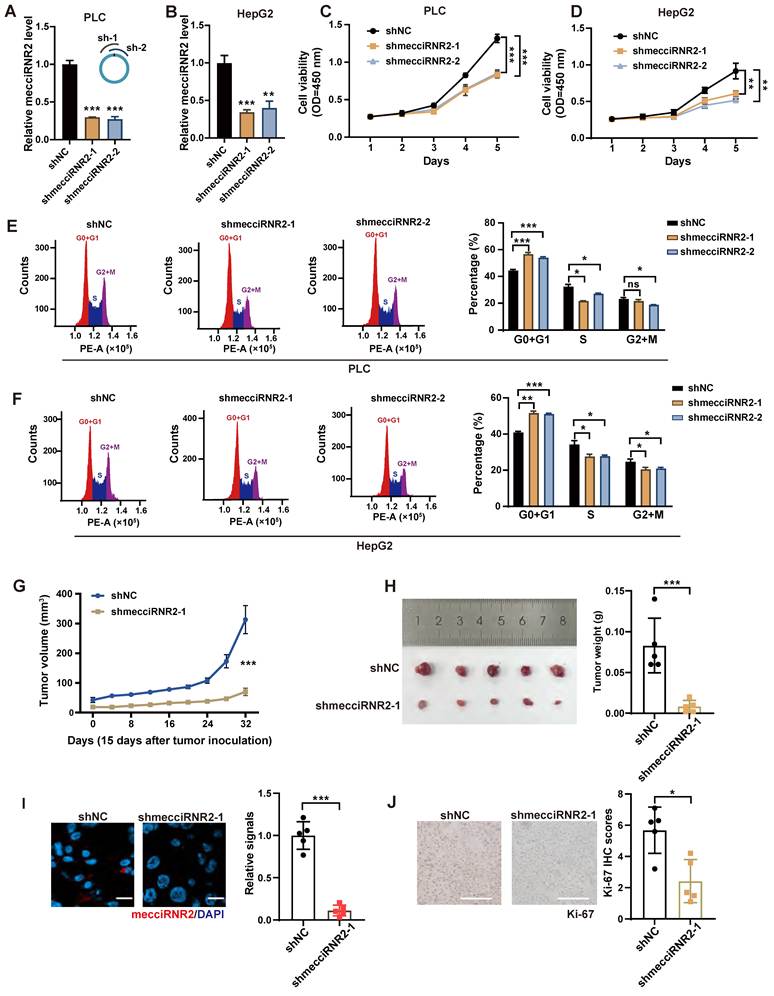
To assess the role of mecciRNR2 in tumor growth, stable mecciRNR2-knockdown or control HepG2 cells were subcutaneously injected into 4-week-old male nude mice. Compared with control tumors, tumors derived from mecciRNR2-knockdown cells exhibited significantly slower growth and lower tumor weight (Fig. 2G and H, Fig. S2D). smFISH analysis confirmed that the expression of mecciRNR2 remained low in xenograft tumors from the mecciRNR2 knockdown group (Fig. 2I). Immunohistochemical (IHC) staining for the proliferation marker Ki-67 revealed a markedly reduced Ki-67 signal in tumors derived from mecciRNR2-knockdown cells compared with control tumors (Fig. 2J). In summary, these data indicate that mecciRNR2 promotes HCC cell proliferation both in vivo and in vitro by regulating cell-cycle progression.
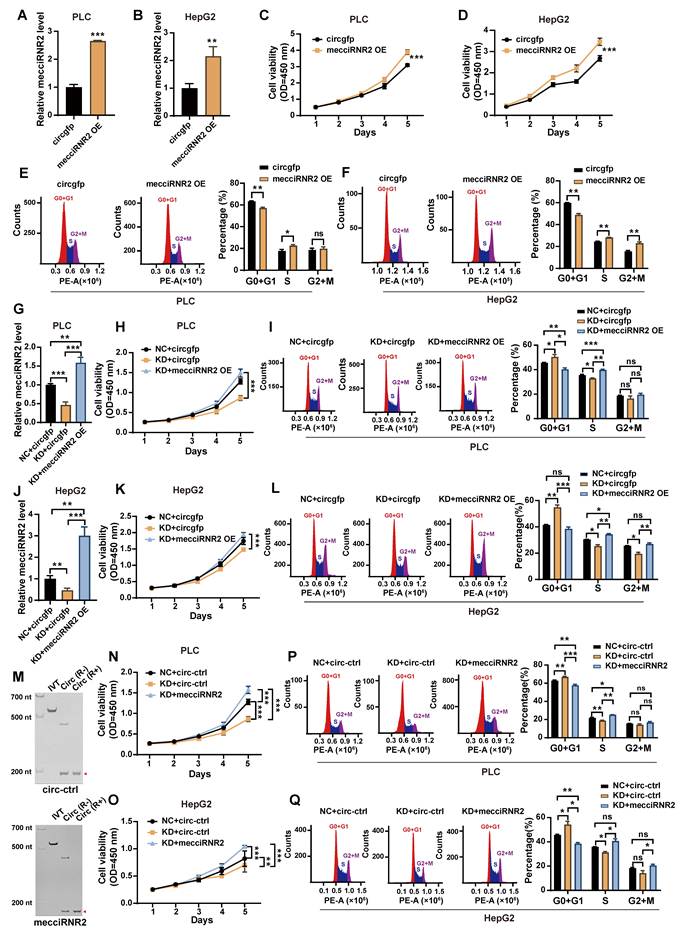
To further investigate the function of mecciRNR2, we constructed stable mecciRNR2-overexpressing PLC and HepG2 cell lines (Fig. 3A and B). Cells expressing circRNA with a gfp sequence were used as a negative control. CCK-8 and colony formation experiments demonstrated that overexpression of mecciRNR2 increased the proliferative capacity and clonogenic capacity of liver cancer cells (Fig. 3C and D, Fig. S2E). Cell cycle analysis revealed a significant decrease in the G0/G1 population, accompanied by a corresponding increase in the S and G2/M populations, suggesting enhanced cell cycle progression upon mecciRNR2 overexpression (Fig. 3E and F). Restoration of the mecciRNR2 level in mecciRNR2-knockdown cells with a mecciRNR2 overexpression plasmid rescued the proliferative defects and G1/S arrest in both PLC and HepG2 cells (Fig. 3G-L). We then transfected in vitro-synthesized mecciRNR2 into mecciRNR2-knockdown cells, with a circRNA containing partial gfp sequences used as a negative control (Fig. 3M, Fig. S2F and G). The exogenous mecciRNR2 transfection of mecciRNR2-knockdown cells effectively rescued the impaired proliferative capacity and reversed G1/S phase arrest (Fig. 3N-Q). Notably, the introduction of exogenous mecciRNR2 in knockdown cells restored cell proliferation to levels comparable to, or even exceeding, those of control cells (Fig. 3N-Q). These results support the conclusion that mecciRNR2 regulates cell cycle progression and promotes HCC cell proliferation.
Overexpression of mecciRNR2 promotes HCC cell proliferation. A, B RT-qPCR validation of mecciRNR2 expression in total RNA from stable mecciRNR2-overexpression PLC (A) and HepG2 (B) cells. mecciRNR2 overexpression was achieved using constructs containing reverse complementary flanking sequences to promote circularization. circgfp, cells transfected with a plasmid expressing circRNA containing the gfp sequence, served as a negative control. C, D CCK-8 assays showing cell proliferation in PLC (C) and HepG2 (D) cells with mecciRNR2 overexpression. E, F Cell cycle assays for PLC (E) and HepG2 (F) cells with mecciRNR2 overexpression. G-I The mecciRNR2 level (G), cell proliferation (H), and cell-cycle distribution (I) after restoration of mecciRNR2 level in mecciRNR2-knockdown PLC cells. NC+circgfp, overexpressing circgfp in shNC cells. KD+circgfp, overexpressing circgfp in mecciRNR2 knockdown cells. KD+mecciRNR2 OE, overexpressing mecciRNR2 in mecciRNR2 knockdown cells. J-L The mecciRNR2 level (J), cell proliferation (K), and cell-cycle distribution (L) after restoration of mecciRNR2 level in mecciRNR2-knockdown HepG2 cells. NC+circgfp, overexpressing circgfp in shNC cells. KD+circgfp, overexpressing circgfp in mecciRNR2 knockdown cells. KD+mecciRNR2 OE, overexpressing mecciRNR2 in mecciRNR2 knockdown cells. M Gel validation of in vitro synthesized mecciRNR2 and control circRNA. The circRNAs were confirmed by RNase R digestion (R+). IVT, in vitro transcription. R-, without RNase R digestion. circ-ctrl, a circularized fragment (≈150 nt) of gfp. N, O Cell proliferation measured by CCK-8 assay in mecciRNR2 knockdown PLC (N) and HepG2 (O) cells following transfection with in vitro synthesized mecciRNR2 or circ-ctrl. KD, mecciRNR2 knockdown. NC, negative control for mecciRNR2 knockdown. P, Q Cell-cycle distribution determined by flow cytometry for mecciRNR2 knockdown PLC (P) and HepG2 (Q) cells following transfection with in vitro synthesized mecciRNR2 or circ-ctrl. In A, B, E-G, I, J, L, P, Q, data are shown as mean±SD from n=3 independent experiments; P-values are from two-tailed Student's t-tests. In C, D, H, K, N, O, data are shown as mean±SD from n=6 experimental replicates for each cell line; P-values are from two-way ANOVA. ns, not significant; *P < 0.05; **P < 0.01; ***P < 0.001.
MecciRNR2 interacts with HNRNPA1
To identify the potential protein partner of mecciRNR2 in HCC cells, we performed RNA pulldown with a biotin-labeled oligo against the junction site of mecciRNR2. RT-qPCR indicated the effective and specific capture of mecciRNR2 in PLC and HepG2 cells (Fig. S3A and B). The proteins co-pulled down with mecciRNR2 were separated by SDS-PAGE and visualized by silver staining. Specific protein bands consistently detected in both HepG2 and PLC cells were excised and subjected to mass spectrometry (MS) analysis (Fig. 4A and B). Among the proteins identified by MS, HNRNPA1 was consistently identified as one of the top enriched proteins in both HepG2 and PLC cells, ranking first in HepG2 cells and second in PLC cells. A total of 16 and 30 unique peptides were detected, corresponding to sequence coverages of 65.3% and 37.63%, respectively (Table S2). HNRNPA1 was therefore selected for further investigation. The interaction between mecciRNR2 and HNRNPA1 was further confirmed by RNA pulldown coupled with Western blotting as well as RNA immunoprecipitation (RIP) followed by RT-qPCR (Fig. 4C-F). FISH for mecciRNR2 together with immunofluorescence (IF) staining of HNRNPA1 under mild permeabilization conditions to preferentially detect cytoplasmic HNRNPA1 revealed that approximately 55% and 60% of the mecciRNR2 signals colocalized with HNRNPA1 in PLC and HepG2 cells, respectively (Fig. 4G and H).
mecciRNR2 interacts with HNRNPA1, and this interaction is essential for mecciRNR2 to promote the proliferation of HCC cells. A, B Pulldown of mecciRNR2 with biotin-labelled antisense oligos in PLC (A) and HepG2 (B) cells. Proteins that were co-pulled down with mecciRNR2 were subjected to silver staining. Red triangles indicate the bands identified as HNRNPA1 by mass spectrometry. Scr, oligos with scrambled sequences. oligo, oligos antisense to the mecciRNR2 junction. C, D HNRNPA1 co-pulled down with mecciRNR2 in PLC (C) and HepG2 (D) cells were verified by Western blotting; ACTB, negative control. E, F RNA immunoprecipitation (RIP) against HNRNPA1 (α-HNRNPA1) with PLC (E) and HepG2 (F) cell lysates. Successful IP of the protein was detected by Western blotting; ACTB, negative control. RNAs from RIP were quantified by RT-qPCR; ACTIN and MT-RNR2 serve as negative controls; mecciND5, a known HNRNPA1 binding mecciRNA, serves as a positive control. G, H Representative images of mecciRNR2 smFISH combined with HNRNPA1 immunofluorescence (IF) in fixed PLC (G) and HepG2 (H) cells. Mild permeabilization conditions were used to minimize nuclear disruption and reduce the dominant nuclear signal of HNRNPA1. R/G: percentage of mecciRNR2 signals that co-localize with HNRNPA1. G/R: percentage of HNRNPA1 signals that co-localize with mecciRNR2. Boxed areas are enlarged; scale bar, 5 µm and 2 µm (enlarged areas). I Putative HNRNPA1 binding sites in mecciRNR2 predicted by the RBPmap website (http://rbpmap.technion.ac.il/). The HNRNPA1-binding motif is located 4 nt from the junction site and is highlighted in pink. mecciRNR2mut represents an HNRNPA1-binding motif mutant of mecciRNR2, in which the predicted “CGAGGG” motif was mutated to “ATGTTT”. J RIP against HNRNPA1 (α-HNRNPA1) was performed with whole-cell lysates from PLC cells overexpressing wild-type (WT OE) or HNRNPA1-binding motif mutant mecciRNR2 (MUT OE). circgfp, negative control. Successful IP of the protein was detected by Western Blotting. ACTB, negative control. The enrichment of mecciRNR2 from RIP was quantified by RT-qPCR. K in vitro synthesized biotinylated mecciRNR2 or HNRNPA1-binding motif mutant mecciRNR2 (mecciRNR2mut) were transfected into PLC cells, respectively. A biotin pulldown assay was then performed. biotin-circ-ctrl, a biotin-labeled circularized fragment (≈150 nt) of gfp. L Electrophoretic mobility shift assay (EMSA) with purified HNRNPA1 protein and in vitro transcribed mecciRNR2 or mecciRNR2mut with indicated molar ratio. Arrowheads indicate the shift band and the free band, respectively. M, N Cell proliferation measured by CCK-8 assays in PLC (M) and HepG2 (N) cells overexpressing wild-type (WT OE) or HNRNPA1-binding motif mutant mecciRNR2 (MUT OE). circgfp, negative control. O, P Cell-cycle distribution determined by flow cytometry of PLC (O) and HepG2 (P) cells overexpressing wild-type (WT OE) or motif mutant mecciRNR2 (MUT OE). Q Stable mecciRNR2-overexpression, mecciRNR2mut-overexpression, or control HepG2 cells were subcutaneously injected into 4-week-old male nude mice, respectively. Tumor growth was monitored by measuring tumor volumes starting 15 days after tumor inoculation. R Images and weight of xenograft tumors after subcutaneous injection of Stable mecciRNR2-overexpression, mecciRNR2mut-overexpression, or control HepG2 cells into nude mice. S Representative smFISH image and quantification of mecciRNR2 in xenograft tumors. Scale bar, 20 μm. T Representative IHC images of Ki-67 protein and the quantification of IHC in xenograft tumors. Scale bar, 100 μm. In E, F, J, O, P, data are shown as mean±SD, n=3 independent experiments. In M, N, data are shown as mean±SD, n=6 experimental replicates for each cell line. In Q-T, data are shown as mean±SD, n=6 mice for each group. P-values are from two-tailed Student's t-tests (E, F, K, O, P, R-T) and two-way ANOVA (M, N, Q); ns, not significant; *P < 0.05; **P < 0.01; ***P < 0.001.
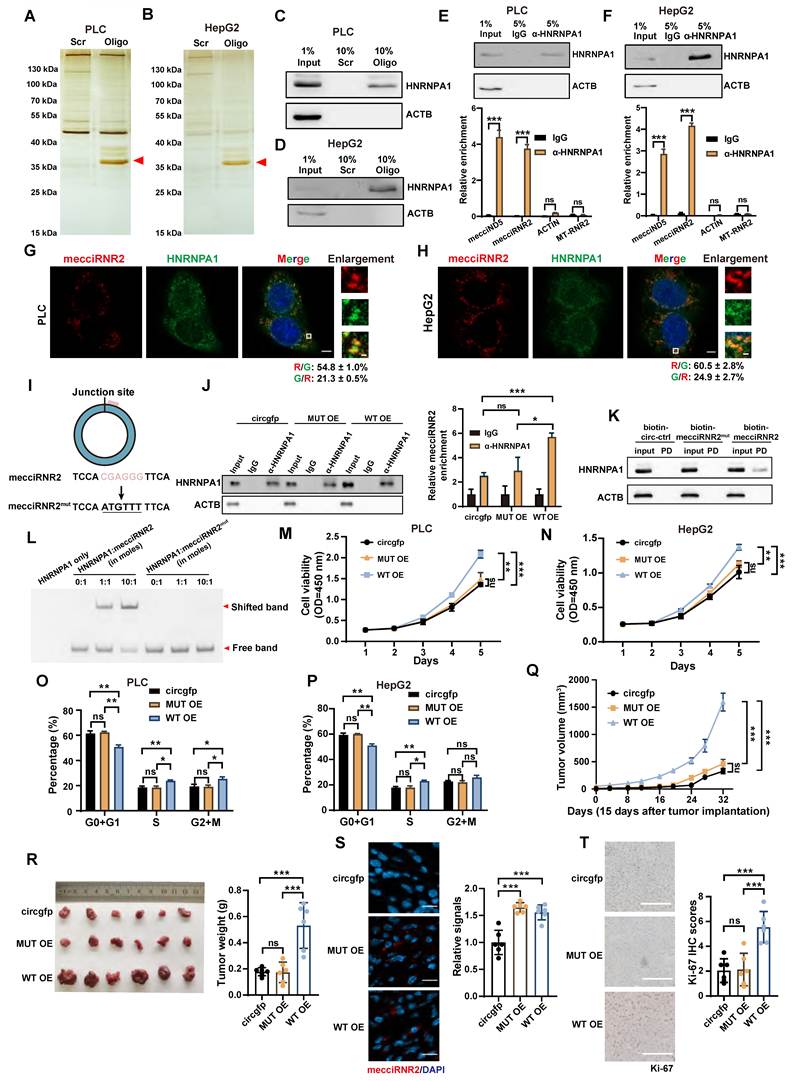
To further investigate the interaction between mecciRNR2 and HNRNPA1, we predicted their potential binding sites using the RBPmap website. We identified a putative HNRNPA1-binding motif, “CGAGGG”, located near the junction of mecciRNR2 (4 nt downstream of the junction site) (Fig. 4I). To determine whether this HNRNPA1-binding motif is essential for the interaction, we generated a motif-mutant mecciRNR2 expression construct (mecciRNR2mut) in which the predicted “CGAGGG” motif was substituted with “ATGTTT” using site-directed mutagenesis (Fig. 4I). RIP assays using an HNRNPA1 antibody in PLC cells overexpressing wild-type or motif-mutant mecciRNR2 (mecciRNR2mut) revealed strong enrichment of wild-type mecciRNR2 but not mecciRNR2mut (Fig. 4J). RNA pulldown using in vitro synthesized biotinylated mecciRNR2 and mecciRNR2mut further confirmed that mutation of this motif substantially reduced the interaction with HNRNPA1 (Fig. 4K). Furthermore, an electrophoretic mobility shift assay (EMSA) confirmed a direct interaction between mecciRNR2 and HNRNPA1 in vitro, which was markedly weakened by mutation of the predicted HNRNPA1-binding site in mecciRNR2 (Fig. 4L).
Unlike wild-type mecciRNR2, expression of mecciRNR2mut failed to promote cell proliferation or enhance cell cycle progression in PLC and HepG2 cells (Fig. 4M-P, Fig. S3C and D). HepG2 cells stably overexpressing mecciRNR2 or mecciRNR2mut were subcutaneously injected into 4-week-old male nude mice. Tumors derived from cells overexpressing wild-type mecciRNR2 exhibited significantly increased tumor growth and greater tumor weight compared with those derived from cells expressing mecciRNR2mut (Fig. 4Q and R). Notably, tumors from the mecciRNR2mut group were comparable to those from the control group expressing a circRNA containing the gfp sequence (Fig. 4Q and R). smFISH confirmed that the expression of mecciRNR2 or mecciRNR2mut remained high in the xenograft tumors (Fig. 4S). IHC staining revealed markedly increased Ki-67 signaling in tumors derived from mecciRNR2-overexpressing cells (Fig. 4T). In contrast, compared with control tumors, tumors derived from mecciRNR2mut-expressing cells did not significantly increase in Ki-67 expression (Fig. 4T). Collectively, these results demonstrate that mecciRNR2 directly interacts with HNRNPA1 through the "CGAGGG" motif and that this interaction is essential for the mecciRNR2-mediated promotion of HCC cell proliferation in vitro and tumor growth in vivo.
MecciRNR2 promotes HCC cell proliferation through regulation of HNRNPA1 protein levels
HNRNPA1 has been reported to be upregulated in human HCC tissues and cell lines and is correlated with shorter overall survival [22]. Consistently, Kaplan-Meier survival analysis using a web-based survival analysis tool [30] indicated that high HNRNPA1 expression was significantly associated with poor overall survival in patients with HCC (Fig. S4A). Both ELISA analysis of 16 paired HCC and adjacent nontumor tissues in our cohort and analysis of a public HCC proteomic dataset from the CPTAC database demonstrated that HNRNPA1 protein levels were significantly elevated in HCC tissues (Fig. 5A, Fig. S4B). Consistent with these observations in clinical samples, HNRNPA1 protein levels were markedly decreased in xenograft tumors derived from mecciRNR2-knockdown cells. In contrast, HNRNPA1 protein levels were significantly increased in tumors derived from mecciRNR2-overexpressing cells but not in those overexpressing the HNRNPA1 binding-deficient mecciRNR2 mutant (Fig. 5B and C).
mecciRNR2 positively regulates HNRNPA1 protein levels. A ELISA analysis of HNRNPA1 protein levels from 16 pairs of HCC and paraHCC tissues. B Representative IHC images of HNRNPA1 protein and the quantification of IHC in xenograft tumors from mecciRNR2 knockdown HepG2 cells. Scale bar, 100 μm. n=5 mice in each group. C Representative IHC images of HNRNPA1 protein and the quantification of IHC in xenograft tumors from mecciRNR2 or mecciRNR2mut (HNRNPA1 binding site abolished) overexpressing HepG2 cells. Scale bar, 100 μm. n=6 mice in each group. D, E The protein levels of HNRNPA1 were examined by Western blotting in PLC (D) and HepG2 (E) cells after mecciRNR2 knockdown. Quantification of HNRNPA1 protein levels is shown. ACTB, loading control. F, G The protein levels of HNRNPA1 were examined by Western blotting in PLC (F) and HepG2 (G) cells after mecciRNR2 (WT OE) or mecciRNR2mut (MUT OE) overexpression. Quantification of HNRNPA1 protein levels is shown. ACTB, loading control. H, I HNRNPA1 was overexpressed in mecciRNR2 knockdown PLC (H) and HepG2 (I) cells. The protein levels of HNRNPA1 were examined by Western blotting. sh-1, sh-2, two independent stable mecciRNR2-knockdown cell lines. EV, empty vector. J, K Cell proliferation measured by CCK-8 assay in PLC (J) and HepG2 (K) cells under the indicated treatment. L, M Cell-cycle distribution determined by flow cytometry in PLC (L) and HepG2 (M) cells under the indicated treatment. Data are shown as mean±SD. In D-I, L, M, n=3 independent experiments. In J, K, n=6 experimental replicates for each cell line. P-values are from two-tailed Student's t-tests (A-G, L, M) and two-way ANOVA (J, K). ns, not significant; *P < 0.05; **P < 0.01; ***P < 0.001.
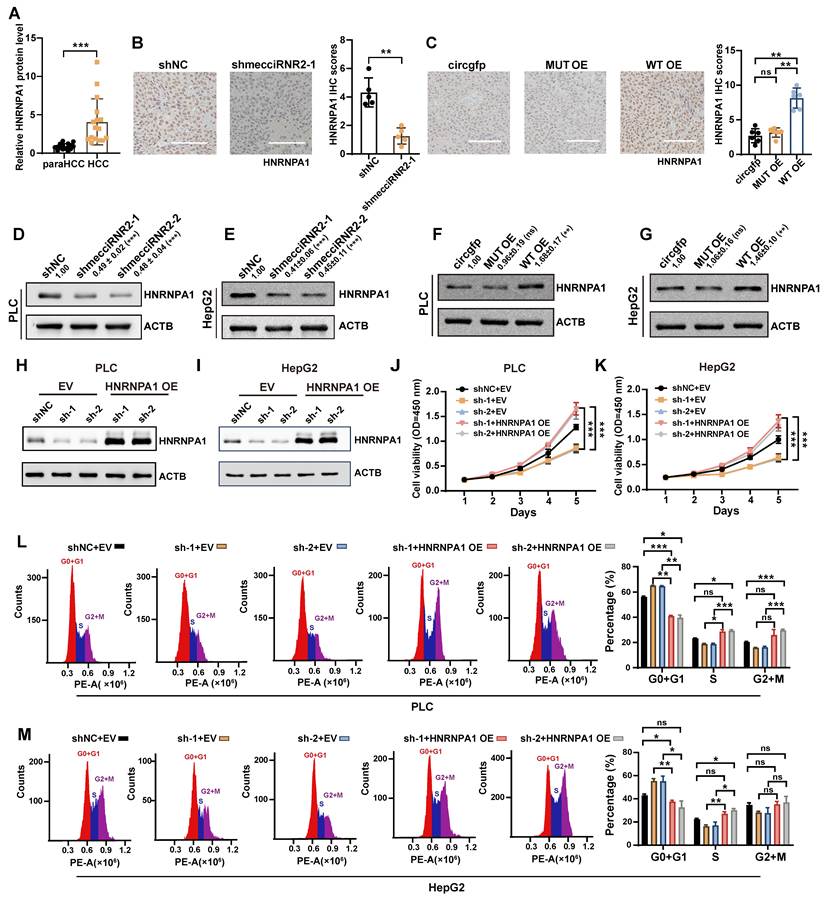
We then investigated the regulatory relationship between HNRNPA1 and mecciRNR2. HNRNPA1 knockdown suppressed HCC cell growth but did not alter mecciRNR2 expression (Fig. S4C-K). Interestingly, the protein level of HNRNPA1 decreased significantly in response to mecciRNR2 knockdown in PLC and HepG2 cells (Fig. 5D and E). The mRNA level of HNRNPA1 remained unchanged (Fig. S4L and M). Conversely, overexpression of wild-type mecciRNR2, but not mecciRNR2mut, increased HNRNPA1 protein abundance in both PLC and HepG2 cells, with the mRNA level unchanged (Fig. 5F and G, Fig. S4N and O). These findings suggest that mecciRNR2 regulates HNRNPA1 protein abundance through direct interaction. To determine whether mecciRNR2 plays a regulatory role through HNRNPA1, we ectopically expressed HNRNPA1 in mecciRNR2-knockdown PLC and HepG2 cells. (Fig. 5H and I). The elevated level of HNRNPA1 in mecciRNR2-knockdown cells effectively rescued the impaired proliferative capacity and reversed G1/S phase arrest (Fig. 5J-M). HNRNPA1 overexpression restored the proliferation of mecciRNR2-knockdown cells to levels comparable to, or even exceeding, those of control cells (Fig. 5J-M). Collectively, these findings reveal that HNRNPA1 is a critical downstream effector of mecciRNR2 in promoting HCC cell proliferation.
Additionally, to determine whether the motif alone is sufficient for binding to HNRNPA1 and regulating HNRNPA1 protein levels, the wild-type motif or its mutant counterpart was inserted into the gfp sequence of a circular RNA expression vector, which produces circularized gfp transcripts (circgfp) (Fig. S5A). Following transfection into PLC cells, RIP assays demonstrated that HNRNPA1 interacted with circgfp containing the “CGAGGG” motif, whereas circgfp harboring the mutant motif failed to bind HNRNPA1 (Fig. S5B and C). However, the expression of circgfp harboring either the wild-type or mutant motif did not alter HNRNPA1 protein levels compared with those in control cells (Fig S5D). These results suggest that while the motif is essential for HNRNPA1 binding, additional sequence elements or structural features of mecciRNR2 are required to modulate HNRNPA1 protein levels.
MecciRNR2 regulates the TRIM21-mediated ubiquitination and degradation of HNRNPA1
We next investigated how mecciRNR2 regulates HNRNPA1 protein levels. HepG2 and PLC cells, with or without mecciRNR2 knockdown, were treated with the protein synthesis inhibitor cycloheximide (CHX) for the indicated times. We observed that the downregulation of mecciRNR2 accelerated HNRNPA1 degradation following CHX treatment (Fig. 6A and B). Conversely, overexpression of mecciRNR2 delayed HNRNPA1 degradation in both HepG2 and PLC cells (Fig. 6C and D). HNRNPA1 protein levels were restored upon treatment with MG132, a proteasome inhibitor, in HepG2 and PLC cells with mecciRNR2 knockdown (Fig. 6E and F), indicating that mecciRNR2 modulates the proteasomal degradation of HNRNPA1. The ubiquitin-proteasome system (UPS) is a major intracellular protein degradation pathway responsible for the turnover of most soluble proteins. We observed that knockdown of mecciRNR2 expression significantly increased the ubiquitination of endogenous HNRNPA1 in PLC and HepG2 cells (Fig. 6G and H). Conversely, overexpression of mecciRNR2 inhibited the ubiquitination of endogenous HNRNPA1 in both types of HCC cells (Fig. 6I and J).
mecciRNR2 inhibits the TRIM21-mediated ubiquitination and degradation of HNRNPA1. A, B Western blotting analysis of HNRNPA1 protein levels in PLC (A) and HepG2 (B) cells with mecciRNR2 knockdown following cycloheximide (CHX, 50 μg/mL) treatment for the indicated times. Quantification of HNRNPA1 protein levels in each cell line was normalized to the 0 h time point. ACTB, loading control. C, D Western blotting analysis of HNRNPA1 protein levels in PLC (C) and HepG2 (D) cells with mecciRNR2 overexpression following CHX (50 μg/mL) treatment for the indicated time periods. Quantification of HNRNPA1 protein levels in each cell line was normalized to the 0 h time point. ACTB, loading control. E, F Western blotting analysis of HNRNPA1 protein levels in PLC (E) and HepG2 (F) cells with mecciRNR2 knockdown following MG132 (50 μM) treatment for 8 h. Quantification of HNRNPA1 is shown. ACTB, loading control. G, H IP followed by Western blotting showing HNRNPA1 ubiquitination in PLC (G) and HepG2 (H) cells upon mecciRNR2 knockdown. Cells were co-transfected with HNRNPA1 and HA-tagged ubiquitin (HA-Ub) expression plasmids. HNRNPA1 was immunoprecipitated using an anti-HNRNPA1 antibody, and ubiquitinated HNRNPA1 was detected by immunoblotting with an anti-HA antibody. Quantification of ubiquitination levels was normalized to immunoprecipitated HNRNPA1 (Ub-HNRNPA1/HNRNPA1). I, J IP followed by Western blotting showing HNRNPA1 ubiquitination in PLC (I) and HepG2 (J) cells upon mecciRNR2 overexpression. Cells were co-transfected with HNRNPA1 and HA-tagged ubiquitin (HA-Ub) expression plasmids. HNRNPA1 was immunoprecipitated using an anti-HNRNPA1 antibody, and ubiquitinated HNRNPA1 was detected by immunoblotting with an anti-HA antibody. Quantification of ubiquitination levels was normalized to immunoprecipitated HNRNPA1 (Ub-HNRNPA1/HNRNPA1). K, L Co-immunoprecipitation (co-IP) analysis showing the interaction between HNRNPA1 and TRIM21 upon mecciRNR2 knockdown in PLC (K) and HepG2 (L) cells. Cell lysates were immunoprecipitated with an anti-HNRNPA1 antibody, followed by immunoblotting with an anti-TRIM21 antibody. Quantification of co-immunoprecipitated TRIM21 is shown. Immunoprecipitated HNRNPA1 serves as the IP control. M, N Co-IP analysis showing the interaction between HNRNPA1 and TRIM21 upon overexpression of mecciRNR2 or mecciRNR2mut in PLC (M) and HepG2 (N) cells. mecciRNR2mut represents an HNRNPA1-binding motif mutant of mecciRNR2, in which the predicted “CGAGGG” motif was substituted with “ATGTTT” by site-directed mutagenesis. Cell lysates were immunoprecipitated with an anti-HNRNPA1 antibody, followed by immunoblotting with an anti-TRIM21 antibody. Quantification of co-immunoprecipitated TRIM21 is shown. Immunoprecipitated HNRNPA1 serves as the IP control. All data are shown as mean±SD from n=3 independent experiments. P-values are from two-tailed Student's t-tests. ns, not significant; *P < 0.05; **P < 0.01; ***P < 0.001.
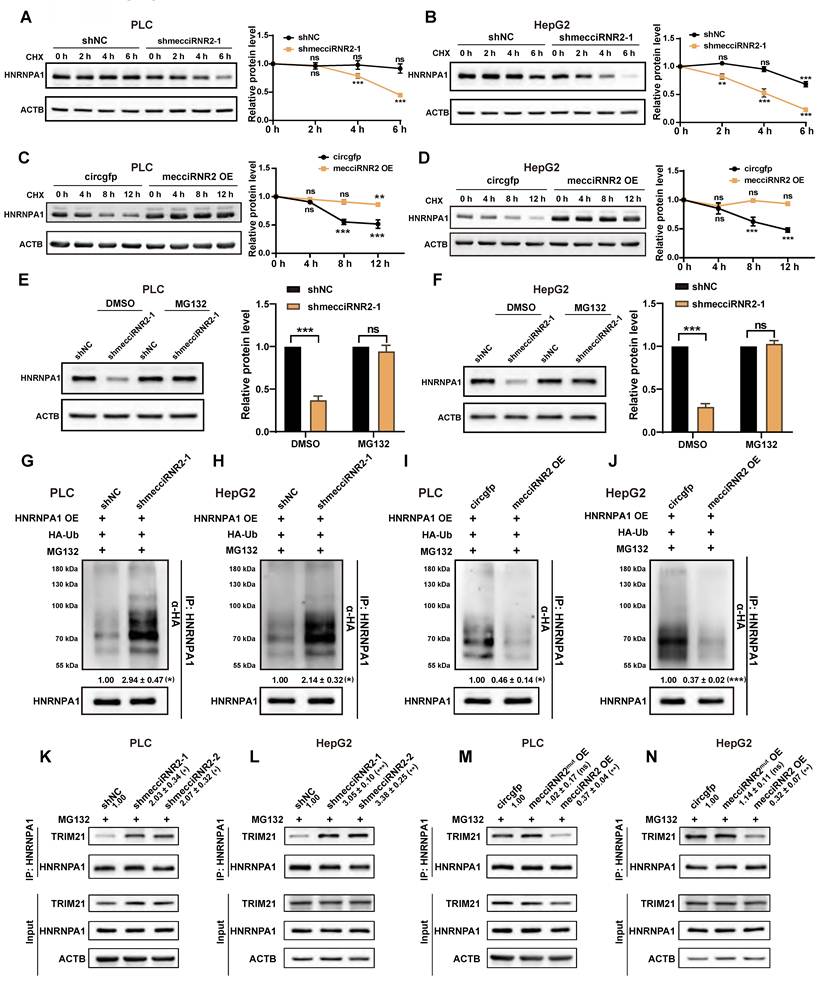
Previous studies have reported that two E3 ubiquitin ligases, TRIM21 and ZFP91, are involved in HNRNPA1 ubiquitination-mediated degradation [31, 32]. TRIM21 is distributed mostly in the cytosol; however, ZFP91 is predominantly expressed in the nucleus [31, 33]. Due to the cytoplasmic localization of mecciRNR2, we focused on TRIM21 for further investigation. After knockdown of TRIM21 using shRNA in PLC cells, we observed an increase in HNRNPA1 protein levels (Fig. S6A). Coimmunoprecipitation assays confirmed the interaction between HNRNPA1 and TRIM21, which was markedly enhanced following mecciRNR2 knockdown but weakened upon mecciRNR2 overexpression (Fig. 6K-N). To further determine whether direct binding of mecciRNR2 to HNRNPA1 is essential for this regulatory effect, an overexpression construct carrying the HNRNPA1-binding motif mutant of mecciRNR2 (mecciRNR2mut), in which the “CGAGGG” motif was substituted with “ATGTTT” by site-directed mutagenesis (Fig. 4I), was transfected into both PLC and HepG2 cells. Overexpression of wild-type mecciRNR2 markedly reduced the association between TRIM21 and HNRNPA1, whereas expression of mecciRNR2mut did not significantly affect the HNRNPA1-TRIM21 interaction (Fig. 6M and N). These results indicate that mecciRNR2 interferes with the binding of TRIM21 and HNRNPA1. Taken together, our findings revealed that mecciRNR2 regulates the ubiquitin-mediated degradation of HNRNPA1 by modulating the interaction between HNRNPA1 and its E3 ligase TRIM21. Given that HNRNPA1 has been reported to be imported into mitochondria, and this import is facilitated by mecciND5 [6], we next investigated whether the mitochondrial import of HNRNPA1 contributes to its stability. Using an APEX2 proximity-labeling system to selectively label mitochondrial matrix proteins [34], we found that mitochondrial HNRNPA1 levels decreased following mecciRNR2 knockdown in PLC cells (Fig. S6B). Overexpression of mecciRNR2 resulted in increased mitochondrial HNRNPA1 levels in PLC cells (Fig. S6C); however, the mecciRNR2 mutation lacking the HNRNPA1 binding motif did not affect mitochondrial HNRNPA1 protein levels, as determined by APEX (Fig. S6D). These observations suggest that mecciRNR2 may promote the mitochondrial import of HNRNPA1, thereby protecting it from cytosolic proteasomal degradation. PLC cells were then treated with the mitochondrial uncoupler carbonyl cyanide m-chlorophenyl hydrazone (CCCP), with or without cotreatment with cycloheximide (CHX). CCCP disrupts the mitochondrial membrane potential, thereby inhibiting mitochondrial protein transport [35]. CCCP treatment did not alter the protein level of HNRNPA1 (Fig. S6E and F), suggesting that mitochondrial import of HNRNPA1 does not significantly contribute to its protein stability.
MecciRNR2 promotes HCC cell proliferation through the HNRNPA1-IGFBP3 axis
To elucidate the downstream pathways regulated by the mecciRNR2-HNRNPA1 axis, we performed RNA-seq analysis in PLC cells following mecciRNR2 knockdown, together with RIP-seq using an HNRNPA1 antibody. RNA-seq analysis revealed that 523 genes were significantly dysregulated upon mecciRNR2 knockdown, whereas RIP-seq revealed 2,244 RNAs associated with HNRNPA1 (Fig. 7A). A total of 69 overlapping genes identified from the two datasets were considered potential targets regulated by the mecciRNR2-HNRNPA1 axis (Fig. 7A). KEGG pathway enrichment analysis revealed that these genes were involved in the p53 signaling pathway, cellular senescence, PI3K-Akt signaling, and other signaling pathways (Fig. 7B, Table S3). SERPINE1, CCND2, and IGFBP3 were associated with the p53 signaling pathway. RIP-qPCR further confirmed the interaction between HNRNPA1 and these 3 mRNAs. Notably, compared with the other two candidates, IGFBP3 mRNA exhibited a greater degree of enrichment in HNRNPA1 RIP (Fig. 7C). The knockdown of either HNRNPA1 or mecciRNR2 expression significantly increased IGFBP3 mRNA levels in PLC cells (Fig. 7D and E). Consistently, IGFBP3 protein levels were also elevated (Fig. S7A-D). Overexpression of mecciRNR2 inhibited the expression of IGFBP3, while disruption of the HNRNPA1-binding motif abolished this effect (Fig. 7F and G). Furthermore, knockdown of HNRNPA1 in mecciRNR2-overexpressing cells restored IGFBP3 expression in both types of HCC cells (Fig. 7H and I). Collectively, these findings demonstrate that mecciRNR2 suppresses IGFBP3 expression through its interaction with HNRNPA1.
MecciRNR2 promotes HCC cell proliferation by regulating HNRNPA1-IGFBP3 axis. A Venn diagram illustrating the overlap between differentially expressed RNAs following mecciRNR2 knockdown and RNAs enriched in HNRNPA1 RIP in PLC cells. B KEGG pathway enrichment analysis of overlapping genes identified from mecciRNR2-regulated genes and HNRNPA1-interacting genes in PLC cells. Gene Ratio is defined as the proportion of genes annotated to a given KEGG pathway among the total number of input genes. C RT-qPCR quantification of IGFBP3, CCND2, and SERPINE1 enrichment in the HNRNPA1 RIP assay. These genes are associated with the p53 signaling pathway shown in panel B. ACTIN, negative control. D, E RT-qPCR quantifying IGFBP3 mRNA levels after knockdown of HNRNPA1 (D) or mecciRNR2 (E) in PLC cells. F, G Western blotting detecting the protein levels of IGFBP3 in PLC (F) and HepG2 (G) cells upon mecciRNR2 or mecciRNR2mut overexpression. The quantification of IGFBP3 is shown. ACTB, loading control. H, I Western blotting analysis of IGFBP3 protein levels in mecciRNR2-overexpressing PLC (H) and HepG2 (I) cells with or without HNRNPA1 knockdown. The quantification of IGFBP3 is shown. ACTB, loading control. J IGV tracks showing HNRNPA1 binding peaks along the IGFBP3 mRNA locus identified by HNRNPA1 RIP-seq. The number of putative HNRNPA1 binding sites on IGFBP3 mRNA predicted by the RBPmap website is shown. K Dual-luciferase reporter assay using a construct containing the IGFBP3 3′ UTR downstream of the Firefly luciferase gene. PLC cells were co-transfected with the reporter and vectors expressing HNRNPA1, mecciRNR2 (WT OE), or mecciRNR2mut (MUT OE). The firefly luciferase activity was normalized to Renilla luciferase activity. EV, empty vector. L, M Western blot analysis of IGFBP3 protein levels in mecciRNR2-overexpressing PLC (L) and HepG2 (M) cells following IGFBP3 restoration. The quantification of IGFBP3 is shown. EV, empty vector, negative control for IGFBP3 overexpression. ACTB, loading control. N, O cell proliferation measured by CCK-8 assay in mecciRNR2-overexpressing PLC (N) and HepG2 (O) cells following IGFBP3 restoration. P, Q Cell-cycle distribution determined by flow cytometry in mecciRNR2-overexpressing PLC (P) and HepG2 (Q) cells following IGFBP3 restoration. R, S Western blotting examining the protein levels of cell cycle-related proteins in mecciRNR2-overexpressing PLC (R) and HepG2 (S) cells following IGFBP3 restoration. CCND1, a G1/S phase-promoting factor; P21, a G1/S phase cell cycle inhibitor; CDK1 and CHK1, G2/M phase-related proteins. T RT-qPCR detecting IGFBP3 mRNA levels from 16 pairs of HCC and paraHCC tissues. U Data in 1L, 5A, and 7T were replotted to analyze the correlation of mecciRNR2, HNRNPA1, and IGFBP3. Spearman's rank correlation analysis was used to calculate the correlation. For each patient, the HCC/paraHCC expression ratios of the three genes are connected by lines to illustrate their relative expression patterns. Spearman ρ and p values are indicated. Data are shown as mean±SD. P-values are from two-tailed Student's t-tests. In C-I, K-M, P-S, n=3 independent experiments; P-values are from two-tailed Student's t-tests. In N, O, n=6 experimental replicates for each cell line; P-values are from two-way ANOVA. ns, not significant; *P < 0.05; **P < 0.01; ***P < 0.001.
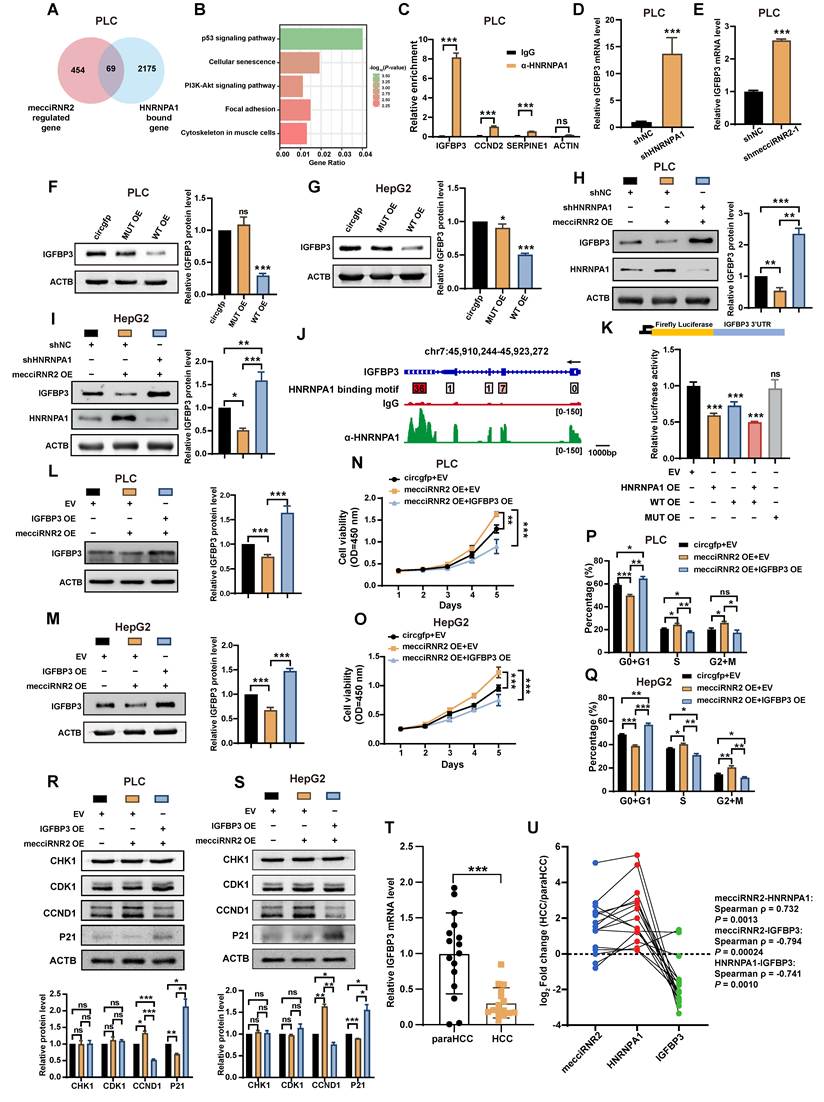
We next investigated how the mecciRNR2-HNRNPA1 axis regulates IGFBP3 expression. After transcription was blocked with actinomycin D in PLC and HepG2 cells, IGFBP3 mRNA expression was less stable in cells overexpressing HNRNPA1 than in control cells (Fig. S7E and F). RBPmap prediction revealed 36 putative HNRNPA1 binding sites distributed mainly in the 3′-UTR of the IGFBP3 transcript, suggesting a potential role for HNRNPA1 in the posttranscriptional regulation of IGFBP3 (Fig. 7J). Consistent with these findings, HNRNPA1 RIP-seq analysis revealed binding of HNRNPA1 across the IGFBP3 mRNA, with relative enrichment of the 3′-UTR (Fig. 7J). We then constructed a dual-luciferase reporter containing the 3′-UTR of IGFBP3 and transfected it into PLC cells. Overexpression of mecciRNR2 or HNRNPA1 significantly reduced luciferase activity, whereas disruption of the HNRNPA1-mecciRNR2 interaction abolished this effect (Fig. 7K). These findings demonstrate that the mecciRNR2-HNRNPA1 axis posttranscriptionally downregulates IGFBP3 expression by destabilizing its mRNA.
IGFBP3 has been implicated as a tumor suppressor in liver cancer and is involved in the induction of G1/S cell cycle arrest [36, 37]. To further explore the function underlying the regulation between mecciRNR2 and IGFBP3, we overexpressed IGFBP3 in cells overexpressing mecciRNR2 (Fig. 7L and M). Restoration of IGFBP3 expression significantly reversed the increase in cell proliferation and accelerated cell cycle progression caused by mecciRNR2 overexpression (Fig. 7N-Q). Cell cycle-related proteins, including CCND1 (a G1/S phase-promoting factor), P21 (a G1/S phase cell cycle inhibitor), and CDK1 and CHK1 (G2/M phase-related proteins), were examined by Western blotting [38, 39]. The overexpression of mecciRNR2 resulted in significant upregulation of CCND1 and concomitant downregulation of P21. Importantly, restoration of IGFBP3 expression in mecciRNR2-overexpressing cells reversed these changes, leading to reduced CCND1 levels and increased P21 expression (Fig. 7R and S). No significant changes in CDK1 or CHK1 expression were observed in mecciRNR2-overexpressing cells with or without IGFBP3 restoration (Fig. 7R and S), which is consistent with the role of IGFBP3 in regulating the G1/S phase transition. To further validate the clinical relevance of the mecciRNR2-HNRNPA1-IGFBP3 axis, RT-qPCR analysis of 16 paired HCC and paraHCC tissues showed that IGFBP3 mRNA levels were significantly reduced in HCC tissues (Fig. 7T). Consistently, analysis of the TCGA-LIHC dataset also demonstrated lower IGFBP3 mRNA expression levels in HCC tissues (Fig. S7I). Furthermore, mecciRNR2 expression was positively correlated with HNRNPA1 expression, whereas both mecciRNR2 and HNRNPA1 expression were negatively correlated with IGFBP3 expression (Fig. 7U) in the clinical samples.
Discussion
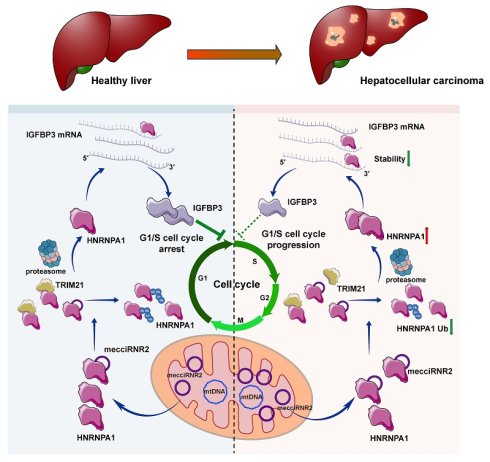
In this study, we identified mecciRNR2, a mecciRNA derived from the mitochondrial genome, which is expressed at significantly higher levels in HCC tissues than in paraHCC tissues. Functional studies demonstrated that mecciRNR2 promoted HCC cell proliferation in vitro and tumor growth in vivo. Mechanistically, mecciRNR2 interacts with HNRNPA1 and weakens its interaction with the E3 ubiquitin ligase TRIM21, thereby preventing TRIM21-mediated ubiquitination and degradation of HNRNPA1. Stabilized HNRNPA1 binds the 3'-UTR of IGFBP3 mRNA to reduce its stability, lowering IGFBP3 protein levels and thereby promoting G1/S cell cycle progression in HCC cells (Fig. 8).
A working model illustrating the role of mecciRNR2 in promoting HCC proliferation. Mitochondria-encoded circRNA mecciRNR2 is upregulated in HCC. In the cytosol, mecciRNR2 interacts with HNRNPA1 and weakens its interaction with the E3 ubiquitin ligase TRIM21, thereby preventing TRIM21-mediated ubiquitination and degradation of HNRNPA1. Stabilized HNRNPA1 binds to the 3′ UTR of IGFBP3 mRNA and reduces its stability, thereby decreasing IGFBP3 expression. Reduced IGFBP3 relieves G1/S cell-cycle arrest, thereby promoting G1/S cell-cycle progression and HCC cell proliferation.
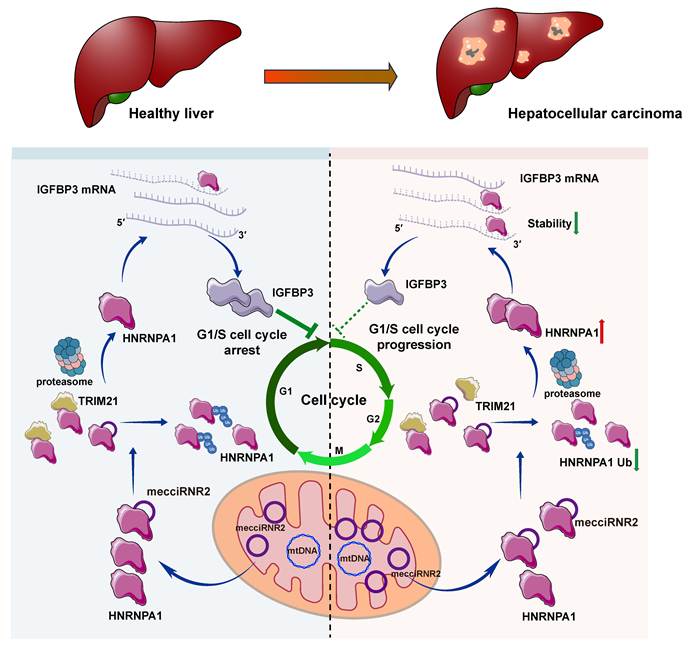
Emerging evidence indicates that mecciRNAs play important roles in diverse biological and pathological processes. For example, mecciND1, mecciND5, and mcPGK1 are distributed inside mitochondria and the cytosol and facilitate mitochondrial protein import. mecciND2 and mecciRNA SCAR regulate mitochondrial ROS release and have been implicated in heart failure and NASH, respectively. In addition, mecciATP6 regulates mitochondrial RNA homeostasis through interaction with HNRNPA3. Another MT-RNR2-derived mecciRNA, circMT-RNR2 (chrM: 1,690-2,240), has recently been reported to localize predominantly to mitochondria, where it protects human dermal fibroblasts against oxidative stress. In this study, we demonstrate that mecciRNR2 predominantly functions in the cytosol rather than within mitochondria, revealing a novel cytoplasmic role for mecciRNAs in regulating protein stability during HCC progression. Despite these findings, several important questions remain unresolved. The mechanisms regulating mecciRNA export from mitochondria are still poorly understood, and whether mecciRNR2 also performs functions within mitochondria or participates in mitochondria-to-nucleus communication needs further elucidation.
The mechanisms underlying mecciRNA biogenesis remain largely unclear, as the canonical spliceosome machinery required for splicing is absent in mammalian mitochondria. The biogenesis of some nuclear-encoded circRNAs from single-exon genes, which lack linear splicing, can be facilitated by ZC3H14 [40]. The knockdown of the mitochondrial-localized RBP hnRNPM increases the level of the mecciRNA SCAR [10]. These results suggested that RBPs may participate in mecciRNA biogenesis. In addition, compared with that of nuclear genes, the transcriptional activity of mitochondrial DNA is substantially greater, with an estimated transcriptional output of OXPHOS transcripts approximately 700-1,100-fold greater than that of nuclear genes [41]. Such robust mitochondrial transcription may contribute to the elevated abundance of mecciRNR2 and enable its rapid production to meet increased regulatory demands. In addition to biogenesis, mecciRNAs have been reported to be degraded by the SUPV3L1-ELAC2 complex in mitochondria. Nuclear-encoded circRNAs in the cytoplasm are primarily degraded through DIS3, RNase K, and lysosome-mediated pathways [42-44]. We observed an approximately 6 h half-life of mecciRNR2. Given its predominant cytosolic localization, whether mecciRNR2 is degraded through established cytosolic circRNA degradation pathways or via a distinct degradation mechanism remains to be determined. HNRNPA1 performs critical functions in cytoplasmic RNA metabolism by regulating mRNA translation and stability [20-22]. Our data indicate that HNRNPA1 binds to the 3′-UTR of IGFBP3 mRNA and reduces its stability. Consistent with our findings, HNRNPA1 has been reported to directly interact with AU-rich elements (AREs) within the 3′ UTR of cIAP1 mRNA and promote its destabilization upon UV exposure [20], highlighting the capacity of HNRNPA1 to regulate mRNA stability through 3′ UTR binding in distinct biological contexts. As a well-recognized RNA-binding protein with diverse posttranscriptional functions, HNRNPA1 is upregulated in various human cancers, including HCC, and is associated with poor prognosis [15, 19-22, 45-47]. Our findings support the clinical relevance of the mecciRNR2-HNRNPA1-IGFBP3 axis in HCC. Given the broad involvement of HNRNPA1 in tumor progression, it will be of interest to determine whether the pathway identified here is conserved in other cancer types.
Collectively, our data reveals a previously unrecognized function of mecciRNAs in cancer progression and contributes to a deeper understanding of the biological significance of mecciRNAs in human disease. The identification and functional characterization of mecciRNR2 in HCC supports the possibility that mecciRNR2 may serve as a potential prognostic biomarker and therapeutic target for HCC.
Abbreviations
CCK-8: Cell Counting Kit-8; CHX: cycloheximide; circRNA: circular RNA; DAPI: 4′,6-diamidino-2-phenylindole; FISH: fluorescence in situ hybridization; H&E: hematoxylin and eosin; HCC: hepatocellular carcinoma; HNRNPA1: heterogeneous nuclear ribonucleoprotein A1; IF: immunofluorescence; IHC: immunohistochemistry; IP: immunoprecipitation; KEGG: Kyoto Encyclopedia of Genes and Genomes; mecciRNA: mitochondria-encoded circRNA; shRNA: short hairpin RNA.
Supplementary Material
Supplementary figures and table legends.

Supplementary table 1.
Supplementary table 2.
Supplementary table 3.
Supplementary table 4.
Acknowledgements
The authors thank the Bioinformatics Center of the USTC, School of Life Sciences, for providing supercomputing resources and the Laboratory Animal Research Center of USTC for technical support. The authors thank Dr. Hanyuan Liu (USTC) and Dr. Yi Liu (USTC) for their assistance in the mouse experiments. This study was funded by the National Natural Science Foundation of China (U23A20164, 32400452, 32400567), the Fundamental Research Funds for the Central Universities (WK9100250096), USTC Research Funds of the Double First-Class Initiative (YD9100002049), Anhui Natural Science Foundation (2408085MC069), the Research Funds of the Center for Advanced Interdisciplinary Science and Biomedicine of IHM (QYZD20230012), Lianyungang Medical-Education Innovation and Research Center, Nanjing Medical University (LYGYB03).
Author contributions
X. L. and G. S. conceived of and designed this project. X. L., G. S., J. L., and K. X. provided funding and supervised the experiments. J. S., J. L., and K. X. performed the experiments. L. S. provided clinical specimens. X. L., G. S., J. S., J. L., and K. X. analyzed the data and wrote the article. All the authors have discussed the results and commented on the article. All the authors approved the final article.
Data availability
The RNA sequencing data has been deposited in the NCBI database with accession number GSE226253. The original mass spectrometry data have been deposited in the NGDC database under accession number OMIX017053. Any additional information required to reanalyze the data reported in this paper is available from the corresponding authors upon request.
Competing Interests
The authors have declared that no competing interest exists.
References
1. Llovet JM, Kelley RK, Villanueva A, Singal AG, Pikarsky E, Roayaie S. et al. Hepatocellular carcinoma. Nat Rev Dis Primers. 2021;7:6
2. Villanueva A. Hepatocellular Carcinoma. N Engl J Med. 2019;380:1450-1462
3. Forner A, Reig M, Bruix J. Hepatocellular carcinoma. Lancet. 2018;391:1301-1314
4. Kristensen LS, Andersen MS, Stagsted LVW, Ebbesen KK, Hansen TB, Kjems J. The biogenesis, biology and characterization of circular RNAs. Nat Rev Genet. 2019;20:675-691
5. Wang X, Shan G. Features and biomedical relevance of circular RNA biogenesis. Trends Genet. 2026;42:282-294
6. Liu X, Wang X, Li J, Hu S, Deng Y, Yin H. et al. Identification of mecciRNAs and their roles in the mitochondrial entry of proteins. Sci China Life Sci. 2020;63:1429-1449
7. Liu X, Xie K, Shan G. New insights into mitochondria-encoded circular RNAs and their functions. Trends Biochem Sci. 2026;51(3):217-220
8. Liu X, Wang Q, Li X, Yang Y, Deng Y, Wang X. et al. Fast Degradation of MecciRNAs by SUPV3L1/ELAC2 Provides a Novel Opportunity to Tackle Heart Failure with Exogenous MecciRNA. Circulation. 2025;151:1272-1290
9. Chen Z, He Q, Lu T, Wu J, Shi G, He L. et al. mcPGK1-dependent mitochondrial import of PGK1 promotes metabolic reprogramming and self-renewal of liver TICs. Nat Commun. 2023;14:1121
10. Zhao Q, Liu J, Deng H, Ma R, Liao JY, Liang H. et al. Targeting Mitochondria-Located circRNA SCAR Alleviates NASH via Reducing mROS Output. Cell. 2020;183:76-93
11. Wu Z, Sun H, Wang C, Liu W, Liu M, Zhu Y. et al. Mitochondrial Genome-Derived circRNA mc-COX2 Functions as an Oncogene in Chronic Lymphocytic Leukemia. Mol Ther Nucleic Acids. 2020;20:801-811
12. Ren B, Guan MX, Zhou T, Cai X, Shan G. Emerging functions of mitochondria-encoded noncoding RNAs. Trends Genet. 2023;39:125-139
13. Li J, Wang X. Functional roles of conserved lncRNAs and circRNAs in eukaryotes. Noncoding RNA Res. 2024;9:1271-1279
14. Cao X, Sui J, Shan G, Liu X. A conserved mammalian mecciRNA, mecciATP6, regulates mitochondrial homeostasis through interaction with HNRNPA3. Noncoding RNA Res. 2026;19:28-39
15. David CJ, Chen M, Assanah M, Canoll P, Manley JL. HnRNP proteins controlled by c-Myc deregulate pyruvate kinase mRNA splicing in cancer. Nature. 2010;463:364-368
16. Gallardo M, Lee HJ, Zhang X, Bueso-Ramos C, Pageon LR, McArthur M. et al. hnRNP K Is a Haploinsufficient Tumor Suppressor that Regulates Proliferation and Differentiation Programs in Hematologic Malignancies. Cancer Cell. 2015;28:486-499
17. Li J, Wang X, Shi L, Liu B, Sheng Z, Chang S. et al. A Mammalian Conserved Circular RNA CircLARP1B Regulates Hepatocellular Carcinoma Metastasis and Lipid Metabolism. Adv Sci (Weinh). 2024;11:e2305902
18. Wang X, Li J, Bian X, Wu C, Hua J, Chang S. et al. CircURI1 interacts with hnRNPM to inhibit metastasis by modulating alternative splicing in gastric cancer. Proc Natl Acad Sci U S A. 2021;118:e2012881118
19. Guil S, Caceres JF. The multifunctional RNA-binding protein hnRNP A1 is required for processing of miR-18a. Nat Struct Mol Biol. 2007;14:591-596
20. Zhao TT, Graber TE, Jordan LE, Cloutier M, Lewis SM, Goulet I. et al. hnRNP A1 regulates UV-induced NF-kappaB signalling through destabilization of cIAP1 mRNA. Cell Death Differ. 2009;16:244-252
21. Guil S, Long JC, Cáceres JF. hnRNP A1 relocalization to the stress granules reflects a role in the stress response. Mol Cell Biol. 2006;26:5744-5758
22. Zhou ZJ, Dai Z, Zhou SL, Fu XT, Zhao YM, Shi YH. et al. Overexpression of HnRNP A1 promotes tumor invasion through regulating CD44v6 and indicates poor prognosis for hepatocellular carcinoma. Int J Cancer. 2013;132:1080-1089
23. Memczak S, Jens M, Elefsinioti A, Torti F, Krueger J, Rybak A. et al. Circular RNAs are a large class of animal RNAs with regulatory potency. Nature. 2013;495:333-338
24. Liu X, Yang Y, Shan G. Identification and detection of mecciRNAs. Methods. 2021;196:147-152
25. Choi HMT, Schwarzkopf M, Fornace ME, Acharya A, Artavanis G, Stegmaier J. et al. Third-generation in situ hybridization chain reaction: multiplexed, quantitative, sensitive, versatile, robust. Development. 2018;145:dev165753
26. Wang Y, Wang Z. Efficient backsplicing produces translatable circular mRNAs. RNA. 2015;21:172-179
27. Chang S, Wang Y, Wang X, Liu H, Zhang T, Zheng Y. et al. HNRNPD regulates the biogenesis of circRNAs and the ratio of mRNAs to circRNAs for a set of genes. RNA Biol. 2024;21:1-15
28. Liu H, Deng S, Yao X, Liu Y, Qian L, Wang Y. et al. Ascites exosomal lncRNA PLADE enhances platinum sensitivity by inducing R-loops in ovarian cancer. Oncogene. 2024;43:714-728
29. Liu CX, Chen LL. Circular RNAs: Characterization, cellular roles, and applications. Cell. 2022;185:2016-2034
30. Kang YJ, Pan L, Liu Y, Rong Z, Liu J, Liu F. GEPIA3: Enhanced drug sensitivity and interaction network analysis for cancer research. Nucleic Acids Res. 2025;53:W283-W290
31. Xie R, Liu L, Lu X, He C, Yao H, Li G. N6-methyladenosine modification of OIP5-AS1 promotes glycolysis, tumorigenesis, and metastasis of gastric cancer by inhibiting Trim21-mediated hnRNPA1 ubiquitination and degradation. Gastric Cancer. 2024;27:49-71
32. Chen D, Wang Y, Lu R, Jiang X, Chen X, Meng N. et al. E3 ligase ZFP91 inhibits Hepatocellular Carcinoma Metabolism Reprogramming by regulating PKM splicing. Theranostics. 2020;10:8558-8572
33. Wu W, Nelson GM, Koch R, Donovan KA, Nowak RP, Heavican-Foral TB. et al. Overcoming IMiD resistance in T-cell lymphomas through potent degradation of ZFP91 and IKZF1. Blood. 2022;139:2024-2037
34. Lam SS, Martell JD, Kamer KJ, Deerinck TJ, Ellisman MH, Mootha VK. et al. Directed evolution of APEX2 for electron microscopy and proximity labeling. Nat Methods. 2015;12:51-54
35. Schäfer JA, Bozkurt S, Michaelis JB, Klann K, Münch C. Global mitochondrial protein import proteomics reveal distinct regulation by translation and translocation machinery. Mol Cell. 2022;82:435-446
36. Lin WH, Martin JL, Marsh DJ, Jack MM, Baxter RC. Involvement of insulin-like growth factor-binding protein-3 in the effects of histone deacetylase inhibitor MS-275 in hepatoma cells. J Biol Chem. 2011;286:29540-29547
37. Regel I, Eichenmüller M, Joppien S, Liebl J, Häberle B, Müller-Höcker J. et al. IGFBP3 impedes aggressive growth of pediatric liver cancer and is epigenetically silenced in vascular invasive and metastatic tumors. Mol Cancer. 2012;11:9
38. Barr AR, Cooper S, Heldt FS, Butera F, Stoy H, Mansfeld J. et al. DNA damage during S-phase mediates the proliferation-quiescence decision in the subsequent G1 via p21 expression. Nat Commun. 2017;8:14728
39. Matthews HK, Bertoli C, de Bruin RAM. Cell cycle control in cancer. Nat Rev Mol Cell Biol. 2022;23:74-88
40. Li Q, Yang G, Ren B, Liu X, Tang LQ, Shi Q. et al. ZC3H14 facilitates backsplicing by binding to exon-intron boundary and 3' UTR. Mol Cell. 2024;84:4314-4333
41. McShane E, Couvillion M, Ietswaart R, Prakash G, Smalec BM, Soto I. et al. A kinetic dichotomy between mitochondrial and nuclear gene expression processes. Mol Cell. 2024;84:1541-1555
42. Liu CX, Li X, Nan F, Jiang S, Gao X, Guo SK. et al. Structure and Degradation of Circular RNAs Regulate PKR Activation in Innate Immunity. Cell. 2019;177:865-880
43. Deng Y, Luo Y, Wu R, Han P, Wang B, Tang LQ. et al. Synergistic degradation of circular RNAs by RNAseK and lysosome. Cell Rep. 2026;45:117178
44. Kim SS, Ham S, Boo SH, Lee D, Min H, Kang E. et al. Ribonuclease κ promotes longevity by preventing age-associated accumulation of circular RNA in stress granules. Mol Cell. 2026;86:885-900
45. Babic I, Anderson ES, Tanaka K, Guo D, Masui K, Li B. et al. EGFR mutation-induced alternative splicing of Max contributes to growth of glycolytic tumors in brain cancer. Cell Metab. 2013;17:1000-1008
46. Eiring AM, Neviani P, Santhanam R, Oaks JJ, Chang JS, Notari M. et al. Identification of novel posttranscriptional targets of the BCR/ABL oncoprotein by ribonomics: requirement of E2F3 for BCR/ABL leukemogenesis. Blood. 2008;111:816-828
47. Siculella L, Giannotti L, Di Chiara Stanca B, Spedicato F, Calcagnile M, Quarta S. et al. A comprehensive understanding of hnRNP A1 role in cancer: new perspectives on binding with noncoding RNA. Cancer Gene Ther. 2023;30:394-403
Author contact
Corresponding author: shangeedu.cn (Ge Shan), liuxu00edu.cn (Xu Liu).