Impact Factor ISSN: 1449-2288




Int J Biol Sci 2027; 23(1):119-136. doi:10.7150/ijbs.135841 This issue Cite
Research Paper
Functional Genomic Screening Identifies FOXP1 as a Tumor-Intrinsic Mediator of Immune Evasion in Pancreatic Cancer
Bao Yingying1,2,3,4,5,#, Li Yini1,2,3,4,5,#, Zhao Yang1,2,3,4,5,#, Li Ting1,2,3,4,5, Huang Junming1,2,3,4,5, Yang Ze5,6, Li Xiangyang1,2,3,4,5, Yang Yixiao1,2,3,4,5, Zhao Shijun1,2,3,4,5, Lin Jian1,2,3,4,5, Li Shuaifeng1,2,3,4,5, 
1. Zhejiang Provincial Key Laboratory of Pancreatic Disease, the First Affiliated Hospital, Zhejiang University School of Medicine, Hangzhou, 310009, China.
2. Department of Hepatobiliary and Pancreatic Surgery, the First Affiliated Hospital, Zhejiang University School of Medicine, Hangzhou, 310003, China.
3. Zhejiang Clinical Research Center of Hepatobiliary and Pancreatic Diseases, Hangzhou, 310003, China.
4. The Innovation Center for the Study of Pancreatic Diseases of Zhejiang Province, Hangzhou, 310009, China.
5. Cancer Center, Zhejiang University, Hangzhou, 310058, China.
6. Liangzhu Laboratory, Zhejiang University Medical Center, Hangzhou 311121, China.
#These authors contributed equally to this work.
Received 2026-4-8; Accepted 2026-9-25; Published 2027-1-1
Abstract
Pancreatic cancer remains largely unresponsive to immune checkpoint blockade, yet the tumor-intrinsic transcriptional mechanisms that sustain immune evasion are not fully understood. Here, we performed an in vivo CRISPR/Cas9 screen targeting transcription factors in an orthotopic murine PDAC model and identified FOXP1 as a tumor-intrinsic mediator of immune evasion. FOXP1 deficiency markedly inhibited tumor growth in immunocompetent hosts, but not immunodeficient mice, accompanied by enhanced CD8⁺ T cell infiltration, activation, and cytotoxic function, rendering tumors more susceptible to antigen-specific T-cell killing and sensitizing PDAC to immune checkpoint blockade. Mechanistically, FOXP1 directly transcriptionally activates CMTM6, a post-translational regulator of PD-L1, thereby maintaining PD-L1 stability and promoting an immunosuppressive tumor microenvironment. Restoration of CMTM6 expression in FOXP1-deficient tumors rescued PD-L1 levels and largely reversed the enhanced antitumor immunity and tumor suppression induced by FOXP1 loss. Clinically, analyses of immunotherapy-treated patient cohorts, human PDAC specimens, and humanized patient-derived xenograft models consistently demonstrated that elevated FOXP1 expression is associated with reduced CD8⁺ T-cell infiltration and diminished responsiveness to immune checkpoint blockade. Collectively, these findings identify a transcriptional-post-translational pathway by which tumor-intrinsic FOXP1 sustains immune evasion in PDAC and provide a strong rationale for combining FOXP1-targeted strategies with PD-1/PD-L1 blockade to overcome resistance to immunotherapy.
Keywords: pancreatic cancer, in vivo CRISPR/Cas9 screen, immune evasion, FOXP1, CMTM6
Introduction
Pancreatic cancer remains one of the most aggressive and lethal malignancies, with an average 5-year overall survival (OS) rate of 13% [1]. Over the past decade, immune checkpoint blockade (ICB), particularly PD-1/PD-L1 blockade, has led to remarkable clinical breakthroughs in cancer immunotherapy, especially in advanced skin, lung, and colorectal cancer [2]. Unfortunately, pancreatic cancer remains largely refractory to ICB treatment due to its highly desmoplastic and profoundly immunosuppressive tumor microenvironment (TME) [3]. Despite increasing clinical interest in immunotherapy for PDAC, the majority of patients exhibit primary resistance, highlighting the urgent need to elucidate the molecular mechanisms that underlie tumor-intrinsic immune evasion.
CRISPR/Cas9 screening is a powerful and unbiased tool for identifying key genes involved in drug resistance and for discovering novel immune targets [4-6]. For example, in vitro studies based on PD-L1 or MHC-Ⅰ expression have identified multiple genes that may facilitate tumor cells to escape cytotoxic T cell-mediated killing [7-11]. However, in vitro cell culture systems cannot fully recapitulate the complex tumor-immune interactions within the endogenous TME. Consequently, a series of in vivo screens have uncovered conserved genes-such as PTPN2, SETDB1, PBRM1, COP1, and VDAC2-in the regulation of tumor immune evasion [12-16]. Notably, using orthotopic and subcutaneous pancreatic cancer models, RIPK2 and MED12 have been found to potentiate cancer immune evasion [17, 18]. As master regulators of gene expression, transcription factors play a pivotal role in oncogenesis by orchestrating oncogenic signaling pathways, rewiring cellular metabolism, reshaping the tumor immune microenvironment, and maintaining cancer stem cell properties [19]. However, a systematic screening approach to identify the key transcription factors that modulate the immune TME and influence the efficacy of ICB therapy is still lacking.
To address this gap, we conducted an in vivo screen using a focused library targeting 1511 murine transcription factors in an orthotopic pancreatic cancer model, we observed that multiple sgRNAs targeting forkhead box P1 (FOXP1) were significantly depleted in immunocompetent mice compared to immunodeficient mice. Genetic ablation of FOXP1 significantly suppressed tumor growth in an immune response-dependent manner, increased CD8+ T cell infiltration, and enhanced effector function, sensitizing tumors to PD-1 blockade. Mechanistically, FOXP1 directly drives transcription of CMTM6, a key post-translational stabilizer of PD-L1 that prevents lysosomal degradation and sustains immunosuppressive signaling. This transcriptional-post-translational axis establishes a mechanistic link between tumor-intrinsic transcriptional programs and adaptive immune resistance.
Material and Methods
Plasmid construction
FOXP1 and CMTM6 cDNAs were cloned into a pLVX-HA expression vector. The pLKO.1 vector was used to construct shRNA-expressing lentiviral plasmids. shRNAs against hFOXP1 cDNA (shhFOXP1#1: CCGGGCAGCAAGTTAGTGGATTAAACTCGAGTTTAATCCACTAACTTGCTGCTTTTTC; shhFOXP1#2: CCGGTGCGAAGATTTCCAATCATTTCTCGAGAAATGATTGGAAATCTTCGCATTTTTC), mFOXP1 cDNA (shmFOXP1#1: CCGGGGTTATCACTCCTCAACAAATCTCGAGATTTGTTGAGGAGTGATAACCTTTTTC, shmFOXP1#2: CCGGCGACTTCCCAGCCTTTCTAAACTCGAGTTTAGAAAGGCTGGGAAGTCGTTTTTC), hCM-TM6 cDNA (shhCMTM6#1: CCGGTTTCTTCTGAGTCTCCTTATACTCGAGTATAAGGAGACTCAGAAGAAATTTTTC; shhCMTM6#2: CCGGGCCCTCACTGAGCCACTTAATCTCGAGATTAAGTGGCTCAGTGAGGGCTTTTTC), mCMTM6 cDNA (shmCMTM6#1: CCGGGGCCTCTACTTCTTTGAATTTCTCGAGAAATTCAAAGAAGTAGAGGCCTTTTTC, shmCMTM6#2: CCGGGTGGAGGCCTCTACTTCTTTGCTCGAGCAAAGAAGTAGAGGCCTCCACTTTTTC), Non-targeting (CCGGCAACAAGATGAAGAGCACCAACTCGAGTTGGTGCTCTTCATCTTGTTGTTTTTC) were inserted into the pLKO.1 vector at the AgeI and EcoRI sites. The promoters were amplified by PCR and cloned into the pGL plasmid.
Tissue culture, transfection and viral infection
PANC1, BxPC3, PANC02 and HEK293T cells were cultured in Dulbecco's modified Eagle's medium (DMEM, Thermo Fisher) containing 10% FBS and 50 μg/mL penicillin/streptomycin (Thermo Fisher Scientific). KPC cells were cultured in McCoy's 5 A (Modified) Medium (Thermo Fisher Scientific) containing 10% FBS. All the cells were cultured at 37℃ in a humidified incubator with 5% CO2. Mycoplasma test for tissue culture was performed on monthly basis using a MycoPlasma Detection Kit (Vazyme Biotech). The cells used in experiments were within 10 passages of thawing.
Transfections were carried out using Lipofectamine (Thermo Fisher Scientific) following the manufacturer's protocol. Stable cell lines were established via lentiviral transduction. Briefly, HEK293T cells were co-transfected with the lentiviral expression construct and packaging plasmids. Viral supernatants were harvested 48 h post-transfection, filtered through a 0.45-μm filter, and applied to target cells in the presence of polybrene (5 μg/mL). Stable cells were selected with puromycin or blasticidin (Thermo Fisher Scientific) as indicated.
FOXP1 knockdown in murine KPC and PANC02 cells was achieved using a pLKO.1-based lentiviral shRNA system. Cells were transduced with the indicated lentiviruses and selected with puromycin to establish stable knockdown lines. For HA-FOXP1 or HA-CMTM6 rescue experiments, shFOXP1 cells were subsequently transduced with the corresponding lentiviruses for 48 h, followed by blasticidin selection.
For inducible FOXP1 silencing in human PANC1 cells, a pLKO-Tet-On system was employed. Cells were transduced and selected with puromycin, expanded, and then seeded into 6-well plates. Knockdown was induced by treatment with 1 μg/mL doxycycline for 48 h. Knockdown and overexpression efficiencies were validated by immunoblotting.
Colony formation assay
Colony formation assays were performed by seeding 1,000 cells per well in six-well plates, followed by a 2-week incubation with medium renewal every 2 days. Cells were fixed in 4% formalin for 15 min and stained with 1% crystal violet for 30 min. Each experiment was repeated for three times.
Human specimens
Paired human pancreatic cancer tissues were obtained from the Department of Hepatobiliary and Pancreatic Surgery, The First Affiliated Hospital, Zhejiang University School of Medicine. The study adhered to institutional ethical standards and received approval from the Institutional Review Board (Approval No. 1333).
PDX model
Tumor fragments from two patients with pancreatic ductal adenocarcinoma (PDAC) were used to establish xenograft models. Briefly, freshly resected specimens were trimmed and sectioned into 3-5 mm³ pieces, which were subcutaneously implanted into the bilateral flanks of 6-week-old male NCG mice within 5 h of surgery. To generate humanized mice, human peripheral blood mononuclear cells (PBMCs) were administered one day prior to implantation.
Once tumors reached approximately 150 mm³, mice bearing grafts derived from the same patient were randomly assigned to receive either IgG control or anti-PD-1 antibody every 3 days. Animals were monitored weekly for signs of graft-versus-host disease (GVHD), including body weight loss, posture, activity, and fur condition, and experiments were terminated before the onset of severe GVHD. Mice were euthanized 21 days post-implantation, and tumors were collected and weighed.
Western blotting and Co-immunoprecipitation
Western blotting was performed according to a standard protocol. Briefly, cells were homogenized in lysis buffer (20 mM Tris pH 7.5, 1 mM EDTA, 1 mM EGTA, 2% SDS, 150 mM NaCl, 0.1 mM DTT, 1 mM PMSF, 1 mM Na3VO4, 50 mM NaF, and protease inhibitor cocktail), separated by SDS-PAGE, and transferred onto PVDF membranes. After blocking with 5% milk, membranes were incubated with the indicated primary antibodies overnight at 4 °C. The primary antibodies against FOXP1 (Rabbit polyclonal anti-FOXP1, CST, Cat# 4402S), CMTM6 (Rabbit polyclonal anti-CMTM6, Abcam, Cat# ab264067), PD-L1 (Mouse polyclonal anti-PD-L1, Proteintech, Cat# 28076-1-AP; Rabbit polyclonal anti-PD-L1, Abcam, Cat# ab213480), β-actin (Mouse polyclonal anti-ACTB, Proteintech, Cat# 20536-1-AP). Membranes were washed prior to incubation with HRP-conjugated secondary antibodies for 1.5 h at room temperature, and protein signals were subsequently detected by ECL.
For co-immunoprecipitation analysis, cells were lysed on ice using CHAPS-based lysis buffer (100 mM NaCl, 10 mM Tris, pH 7.5, 10 mM EDTA, 1% CHAPS, 50 mM NaF, 1 mM Na₃VO₄, and 0.1 mM DTT) containing EDTA-free protease inhibitors. Following clarification by centrifugation (12,000 × g, 10 min, 4 °C), the lysates were subjected to immunoprecipitation with an anti-PD-L1 antibody for 2 h at 4 °C with gentle rotation. Protein A-Sepharose was then added for a further 1.5 h. After four washes with lysis buffer, the immunoprecipitates were denatured in 1× SDS sample buffer by boiling and subsequently examined by western blotting.
Real-time qPCR
Total RNA was extracted with TRIzol reagent (TaKaRa Bio), and cDNA was generated using the First-Strand Synthesis System (TaKaRa Bio) following standard protocols. Quantitative PCR was carried out with SYBR Green and gene-specific primers, and β-actin was used for normalization. Relative gene expression was determined using the 2^-ΔΔCt method. Gene specific primers (hCMTM6, forward 5'- TTTCCACACATGACAGGACTTC-3', reverse 5'- GGCTTCAGCCCTAGTGGTAT-3'; hCD274, forward 5'-CCGGCTGGACAAACTGACA-3', reverse 5'-GGTGCATCACATGGTCCTCTG-3'; mCD274, forward 5'-GCTCCAAAGGACTTGTACGTG-3', reverse 5'-TGATCTGAAGGGCAGCATTTC-3'). ChIP-qPCR Gene specific primers (hCMTM6, forward 5'-GCTCAGGAAATGCGTCGGAG-3', reverse 5'-GTATCGCAGGACTTTGTCCAGC-3'; hDNAJC10, forward 5'-GCGATTCTCTTGACTCC CGAG-3', reverse 5'-GTGGTGGCTCACGCTTGTA-3'; hMIEF1, forward 5'-GGCTCACACCTGTAATCCCAG-3', reverse 5'-GCGATCTTGGCTCACTGCAG-3').
Immunofluorescent staining and imaging
Cells were plated on glass coverslips, fixed with 4% paraformaldehyde, and permeabilized with 0.1% Triton X-100. After blocking, cells were incubated overnight at 4 °C with the specified primary antibodies, followed by three washes and staining with fluorophore-conjugated secondary antibodies (Thermo Fisher Scientific) for 1 h at room temperature. Coverslips were mounted with ProLong Gold antifade medium containing DAPI, and confocal images were captured using a ZEISS LSM 900 microscope.
T cell mediated tumor cell killing
CD8+ T cells were isolated from mouse spleen according to the instruction. Isolated CD8+ T cells were activated in 96 well plate coated with CD3/CD28 antibodies for 48h. KPC cell were seeded into 96 well plate, then activated CD8+ T cells were coculture with KPC cells at a ratio of 5:1 and 2:1 for another 24 h. Tumor cells number were measured by luciferase activity by Synergy Neo2 microplate reader (Bio Tek).
To assess OT-1 T cell-mediated killing, OT-1 T cells were isolated from mouse spleens according to the instruction, and activated with CD3/CD28 antibodies for 48 h. KPC tumor cells stable expressing ovalbumin peptides, with or without FOXP1 knockdown, were co-cultured with activated OT-1 T cells at ratio of 4:1 for 24 h. The tumor cell death was detected using LDH release assay.
CUT & Tag assay
CUT & Tag assay was conducted following the manufacturer's instructions (Hyperactive Universal CUT&Tag Assay Kit for Illumina Pro, Vazyme, Cat# TD904). Briefly, 50,000 PANC1 cells were collected from each sample. Cells were permeabilized and nuclei were isolated and incubated overnight at 4°C with FOXP1 antibody. After incubation with the secondary antibody and the pA-Tn5 transposon, fragmentation was performed at 37°C. DNA fragments were extracted, and libraries were prepared using the NEBNext® Ultra™ II DNA Library Prep Kit (New England Biolabs, Cat# E7645). Sequencing was carried out on an Illumina platform with paired-end 150 bp reads.
CUT & Tag analysis: Trim Galore (v0.6.10) was used to remove adapters and low-quality bases using default parameters. After trimming, the cleaned reads were aligned to the reference genome (GRCh38) using BWA (v0.7.17-r1188) [20] with mem algorithm. To minimize biases introduced by PCR amplification, duplicate reads were marked and removed optionally using Picard MarkDuplicates (v2.26.3). For visualization, the aligned reads were converted into the BigWig format using the bamCoverage (v3.5.4) function in deepTools [21]. A bin size of 10 bp was used for visualization, and the data were normalized to RPKM (Reads Per Kilobase per million mapped reads), allowing for consistent and comparative visualization of binding patterns across different regions of the genome.
RNA-sequencing
Total RNA from PANC1 cells, with or without FOXP1 knockdown, was extracted using TRIzol (Invitrogen) and subjected to rRNA depletion using the Ribo-Zero Gold Kit (Illumina). RNA-seq libraries were generated with the NEBNext Ultra II RNA Library Prep Kit for Illumina (NEB) following the manufacturer's instructions. Sequencing was performed in three independent biological replicates on an Illumina platform with paired-end 150 bp reads.
RNA-seq and gene expression analysis: After removing adapters and low quality bases by Cutadapt (v2.6), the FASTQ files were aligned to the reference genome (GRCh38) using Hisat2 (v2.2.1) [22]. Reads mapped to tRNA and rRNA were removed, and each sample yielded ~20 million useful reads for the following analysis. Stringtie (v2.2.3) [23] was used to calculate the FPKM of each gene to represent their mRNA expression level. Differential genes were identified by a negative binomial model using the R package DEseq2 (1.49.2) [24], combining information from all replicates. The significantly differentially expressed genes have to meet all following criteria: p-value ≤ 0.05, log2 (fold-change) ≥ 1 or log2 (fold-change) ≤ -1.
Promoter activity assay
HEK293T cells were co-transfected with the promoter reporter and pLVX-FOXP1 vectors. After 48 h, cells were lysed in lysis buffer (25 mM Tris-H3PO4, 2 mM EDTA, 2 mM DTT, 10% glycerol, 1% Triton X-100, 1 mg/mL BSA) and the luminescence was quantified with a microplate reader.
Flow cytometry analysis
Tumor tissues were mechanically dissociated and enzymatically digested in RPMI-1640 containing 2% FBS, DNase I, collagenase IV, and Dispase at 37 °C for 1 h. Single-cell suspensions were generated by filtering through 70 µm strainers and enriched for immune cells by centrifugation on 36% Percoll. Cells were incubated with anti-CD16/CD32 antibodies for 15 min at 4 °C to block Fc receptors, followed by 30 min staining at 4 °C with fluorochrome-conjugated antibody panels for surface markers. For intracellular cytokine analysis, cells were cultured in RPMI-1640 with 10% FBS and stimulated with Cell Stimulation Cocktail (including protein transport inhibitors) at 37 °C for 4 h. The antibodies used for flow cytometry analysis are: APC/Cyanine7 anti-mouse CD4 Antibody (Biolegend, Cat# 100414), Brilliant Violet 605™ anti-mouse CD8a Antibody (Biolegend, Cat#100744), Brilliant Violet 785™ anti-mouse CD45 Antibody (Biolegend, Cat# 103149), FITC anti-mouse CD3 Antibody (Biolegend, Cat# 100203), APC anti-mouse CD137 Antibody (Biolegend, Cat# 106110), PE/Cyanine5 anti-mouse CD69 Antibody (Biolegend, Cat# 104510), Brilliant Violet 421™ anti-mouse IL-2 Antibody (Biolegend, Cat# 503826), Brilliant Violet 510™ anti-mouse TNF-α Antibody (Biolegend, Cat# 506339). APC/Cyanine7 anti-mouse IFN-γ Antibody (Biolegend, Cat# 505850), Brilliant Violet 421™ anti-mouse/human Ki-67 Antibody (Biolegend, Cat# 151208), PE anti-mouse CD366 (Tim-3) Antibody (Biolegend, Cat# 119703), APC anti-mouse PD-1H (VISTA) Antibody (Biolegend, Cat# 143710), PE/Cyanine5 anti-mouse NK-1.1 Antibody (Biolegend, Cat# 108716). Cells were first stained for surface markers, then fixed, permeabilized, and stained for intracellular targets. Following washing and resuspension, samples were acquired on a BD LSRFortessa flow cytometer and analyzed with FlowJo software.
In vivo antibody depletion of CD8+ or CD4+ T cell
To deplete CD8+ or CD4+ T cells, mice were injected intraperitoneally with 200 µg of anti-CD8 monoclonal antibody (BE0061, Bio X Cell) or anti-CD4 monoclonal antibody (BE0003, Bio X Cell) 3 days prior to orthotopic pancreatic injection, and dosing was repeated every 3 days. Spleens were collected for analysis of CD8⁺ T cells by flow cytometry.
Animal and tumor model
Animal studies were conducted following approval by the Animal Care and Use Committee of Zhejiang University (Approval No. ZJU20210073). Six-week-old male C57BL/6 mice and BALB/c nude mice were purchased from Jiangsu GemPharmatech Company. KPC or PANC02 cells with stable FOXP1 or CMTM6 knockdown, with or without rescue constructs, were injected subcutaneously (5 × 10⁵ cells/mouse). Tumor size was measured by calipers, and tumors were harvested three weeks later for weighing, flow cytometry, or immunohistochemistry. For orthotopic implantation, cells were suspended in PBS, combined with Matrigel, and injected into the pancreas.
In vivo CRISPR screening
Screening library design: The screening library consisted of 1,511 transcription factor (TF) combinations, represented by the 9,166 gRNAs group. Additionally, 100 negative control combinations, including non-targeting gRNAs, were incorporated into the library.
In vivo CRISPR Screening: For in vivo CRISPR screening, Cas9-expressing KPC cells were transduced with a sgRNA library targeting 1,511 transcription factors at an MOI of 0.3, ensuring ≥ 500-fold coverage. Following puromycin selection, cells were either expanded in vitro or orthotopically implanted into BALB/c nude or C57BL/6 mice. Tumors were harvested 21 days after implantation. Twenty mice were implanted with tumor cells, fifteen mice successfully developed tumors, whereas five mice did not develop detectable tumors and were excluded from the screening analysis.
The fifteen tumors were ranked according to tumor size, tumor tissues from individual mice were minced and resuspended in PBS at 0.1 g/mL. Tissues were homogenized to near single-cell suspensions, and one-fifth of each homogenate from five tumors were combined to generate one pooled sample. This procedure generated three independently pooled tumor samples. Samples were lysed in 10 mL of lysis buffer (100 mM NaCl, 10 mM Tris-HCl pH 8.0, 25 mM EDTA pH 8.0, 0.5% SDS) overnight at 65 °C. Genomic DNA was extracted using phenol/chloroform/isoamyl alcohol (25:24:1), and remaining RNA was removed by treatment with 1 μg/mL DNase-free RNase at 37 °C for 30 min.
A two-step PCR was performed for DNA sequencing. Primer sequence: Lib-PCR-F, 5'-GGACTATCATATGCTTACCG-3', Lib-PCR-R, 5'-GTGGATGAATACTGCCATTT-3'. For the first-round of PCR (PCR1), in one 50 uL PCR1 reaction, in addition to add Q5 DNA polymerase and 5×buffer, 10 ug genomic DNA, 200 uM of dNTP mix, 0.5 uM of Lib-PCR-F and Lib-PCR-R primer were also added. 24 PCR cycles were performed for PCR1. 10 uL PCR1 was used as a template for the second round of PCR (PCR2). In one 100 uL PCR2 reaction, in addition to add Q5 DNA polymerase and 5×buffer, 10 uL PCR1 mix, 200 uM of dNTP mix, 0.5 uM of Lib-PCR-F and Lib-PCR-R primer were also added. 17 PCR cycles were performed for PCR2, followed by gel extraction. sgRNA abundance was analyzed using Illumina HiSeq. gRNAs were mapped and normalized, and significantly depleted or enriched sgRNAs were identified using the MAGeCK method.
In vivo CRISPR Screening data processing and analysis: Raw paired-end FASTQ files (Read1 and Read2) were processed using SeqKit (v2.10.0) [25], a tool for efficient manipulation of FASTQ files. Reads containing the primer sequence 5'- GGACTATCATATGCTTACCG -3' were retained, allowing for up to three mismatches. The filtered reads were then analyzed using MAGeCK (v0.5.9.5) [26], along with the corresponding reference gRNA library. The “mageck count” function was employed to quantify gRNA abundance across experimental conditions, generating a count matrix for downstream statistical analysis. The “mageck test” function was used to identify significantly depleted genes, and the Robust Rank Aggregation (RRA) score was calculated for each gene based on the behavior of its targeting gRNAs under the screening conditions.
Single-cell RNA-sequencing (scRNA-seq)
Mouse tumors were isolated and enzymatically dissociated into single-cell suspensions. Tumor-infiltrating leukocytes from shNT and shFOXP1 tumors were sorted using CD45- or CD3-conjugated antibodies via FACS. Cell viability was evaluated with Trypan Blue, and viable single cells were resuspended in PBS for single-cell RNA sequencing.
scRNA-seq data processing and analysis
Raw sequencing data were processed using the Cell Ranger software (v8.0.1) [27] provided by 10x Genomics. This included demultiplexing of cellular barcodes, alignment of reads to the GRCm39 reference genome and transcriptome, and downsampling to normalize read depth across samples. For each sample, a gene-by-cell expression matrix was generated. Subsequent downstream analysis was performed using the R package Seurat (v5.1.0) [28]. Cells were filtered based on quality control metrics: only those expressing between 200 and 9,000 genes and having < 5% mitochondrial transcript content were retained for analysis. The filtered expression matrix was normalized using the NormalizeData function with the "LogNormalize" method, which applies a global-scaling normalization to account for differences in sequencing depth. To identify biologically relevant patterns, highly variable genes (HVGs) were selected using the FindVariableFeatures function, retaining the top 2,000 genes. Principal component analysis (PCA) was then conducted using z-score transformed expression values of these HVGs. The top 20 principal components (PCs) were selected for subsequent clustering. Dimensionality reduction was performed using a Uniform Manifold Approximation and Projection (UMAP) via the RunUMAP function with default parameters. Clustering was conducted using the FindClusters function with a resolution parameter set to 0.4. Cell type annotations were assigned based on the expression profiles of canonical marker genes and differentially expressed genes (DEGs), as identified by the FindMarkers function.
Trajectory analysis of CD8+ T Cells using Monocle3
CD8⁺ T cells were selected based on CD8a expression level of > 1. Pseudotemporal trajectories were constructed using the R package Monocle3 (v1.3.1) [29]. The dataset was preprocessed by projecting onto the top 50 principal components via PCA. The dimensionality was then reduced using UMAP. Cells were clustered with the cluster_cells function and their developmental trajectory was inferred using a learning graph function. The Naïve T cell subset was designated as the root for pseudotime analysis using the order_cell function. Trajectories were visualized in two-dimensional UMAP space using plot_cells function.
IHC staining
Formalin-fixed, paraffin-embedded tumor tissues were sectioned and deparaffinized through graded ethanol series. Antigen retrieval was performed for 30 min prior to immunostaining. Sections were incubated with primary antibodies targeting CD8 (Rabbit anti-CD8 alpha, Abcam, Cat# ab217344), Granzyme B (Rabbit Anti-Granzyme B, D6E9W, CST, Cat# 46890S) using the avidin-biotin complex method (Vector Laboratories). 3,3'-Diaminobenzidine (DAB) was used for chromogenic detection, and hematoxylin was applied to counterstain nuclei.
Fluorescent multiplexed immunohistochemistry
Multiplex fluorescent IHC was carried out using the Opal 7-color Manual IHC Kit (Akoya Biosciences) following the manufacturer's protocol. Sections were deparaffinized and subjected to microwave antigen retrieval (45 s at 100% power and 15 min at 20% power). After blocking with Opal Antibody Diluent/Block, slides were incubated overnight at 4 °C with primary antibodies, followed by 10 min incubation with HRP-conjugated secondary antibodies and 10 min with the Opal fluorophore working solution. Slides were washed with 1× TBS-T between staining steps and stripped using microwave treatment in antigen retrieval buffer between rounds. Following the final staining, slides were mounted with mounting medium containing DAPI, and images were acquired on a Zeiss LSM 900 confocal microscope (Zeiss, jena, Germany).
Quantification and statistical analysis
GraphPad Prism was used for data analysis and visualization. Values are expressed as mean ± SD. Two-tailed unpaired Student's t tests were applied for comparisons between two groups. Kaplan-Meier curves were used to assess overall survival. Sample size was not pre-determined statistically.
Data availability
The scRNA-seq data, RNA-seq data and CUT&Tag data generated from this study can be obtained from NCBI GEO database with accession number GSE302622, GSE302624, GSE302623, GSE302625. Other data supporting the findings of this study are available from the corresponding authors upon reasonable request. To review GEO accession GSE302622: Go to https://www.ncbi.nlm.nih.gov/geo/query/acc.cgi?acc=GSE302622, Enter token izknaygetvaddun into the box; To review GEO accession GSE302624: Go to https://www.ncbi.nlm.nih.gov/geo/query/acc.cgi?acc=GSE302624, Enter token ifgbcqokhjsvrgb into the box; To review GEO accession GSE302623: Go to https://www.ncbi.nlm.nih.gov/geo/query/acc.cgi?acc=GSE302623, Enter token evefigoufzsftmh into the box; To review GEO accession GSE302625: Go to https://www.ncbi.nlm.nih.gov/geo/query/acc.cgi?acc=GSE302625, Enter token clyxiaosdzyxpal into the box.
Results
In vivo CRISPR/Cas9 screen identifies FOXP1 as a mediator of immune evasion in PDAC
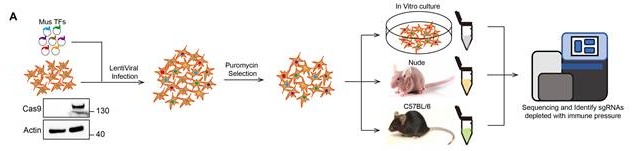
To systematically identify transcription factors regulating tumor-intrinsic immune evasion in pancreatic cancer, we constructed a murine lentiviral CRISPR/Cas9 knockout library targeting 1,511 transcription factors (six sgRNAs per gene) curated from the AnimalTFDB3 database [30]. This library was introduced into KPC pancreatic cancer cells, which were then implanted into immunocompetent C57BL/6 or immunodeficient nude mice for in vivo screening (Fig. 1A). After three weeks, tumors were harvested and the relative abundance of sgRNAs was analyzed to identify genes selectively depleted in immunocompetent hosts (Fig. 1B, Supplemental Fig. S1A, Supplementary Table 1 Additional). Remarkably, several transcription factors with known roles in immune regulation, including SMAD7 (TGFβ signaling), IRF1, and IRF3 (interferon response) [31-33], as well as established immune evasion mediators such as MYC, HIF1a, and FOXM1, were significantly depleted in tumors from C57BL/6 mice [34-36] (Fig. 1B). These findings validate the robustness of our screening. Notably, FOXP1 emerged as a top-ranked gene depleted under immune pressure (Fig. 1B), suggesting a potential role in tumor-intrinsic immune evasion.
In vivo CRISPR/Cas9 screen identifies FOXP1 as a mediator of immune evasion in PDAC. A Schematic of the in vivo CRISPR screening strategy. B Robust rank aggregation (RRA) ranking of the top depleted genes in immunocompetent versus immunodeficient mice. C Representative the image of KPC tumors with or without FOXP1 knockdown in nude and C57BL/6 mice. n = 6 per group. D-G Tumor growth and weight measurements for KPC cells in nude and C57BL/6 mice. H Representative images of PANC02 tumors with or without FOXP1 knockdown in nude and C57BL/6 mice. n = 6 per group. I-L Tumor growth and weight measurements for PANC02 cells in nude and C57BL/6 mice. M Kaplan-Meier survival analysis of C57BL/6 mice bearing shNT and shFOXP1 tumors, n = 10 per group, * p < 0.05, *** p < 0.0001.
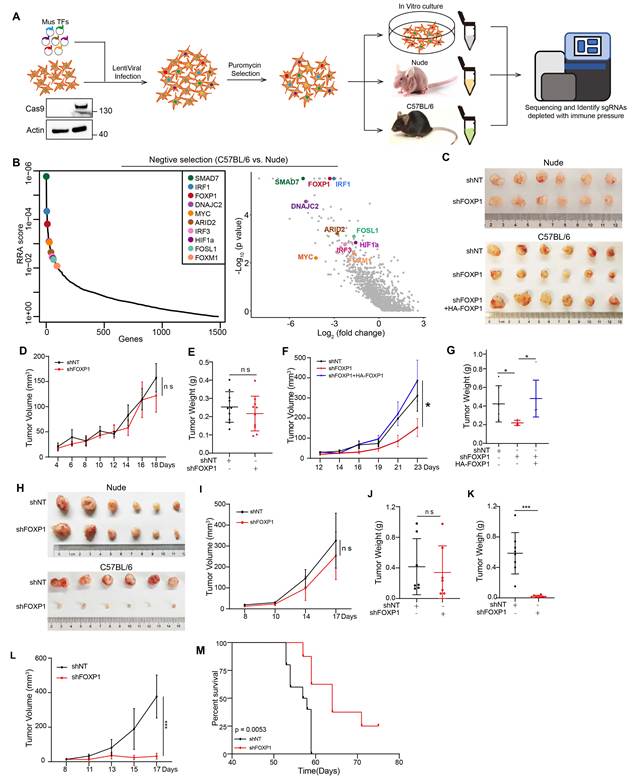
To investigate the role of FOXP1, we generated stable FOXP1-knockdown KPC and PANC02 cells. FOXP1 depletion did not significantly affect cell proliferation in vitro, as determined by CCK8 and colony formation assays (Supplemental Fig. S1B -D), suggesting that FOXP1 is dispensable for tumor cell intrinsic growth. We next examined the effect of FOXP1 depletion in vivo. In immunodeficient nude mice, subcutaneous tumors derived from control and FOXP1-knockdown KPC cells exhibited comparable growth (Fig. 1C-E), consistent with the in vitro findings and indicating that FOXP1 has little effect on intrinsic tumor proliferation. In contrast, when the same cells were implanted into immunocompetent C57BL/6 mice, FOXP1 knockdown markedly reduced tumor growth, whereas re-expression of FOXP1 fully restored tumor progression (Fig. 1C, Fig. 1F and G), demonstrating that the tumor-promoting effect of FOXP1 depends on an intact immune system. Similar results were obtained using the independent PANC02 model, in which FOXP1 knockdown significantly inhibited tumor growth in immunocompetent mice (Fig. 1H-L, Supplemental Fig. 1E). Moreover, FOXP1 depletion significantly prolonged survival in an orthotopic pancreatic tumor model (Fig. 1M). Collectively, these results demonstrate that FOXP1 promotes pancreatic tumor progression primarily by facilitating immune evasion rather than enhancing tumor cell-intrinsic proliferation.
FOXP1 knockdown alters the immune landscape of PDAC
To assess the impact of FOXP1 depletion on the immune landscape of pancreatic cancer, single-cell RNA sequencing (scRNA-seq) was performed on tumor-infiltrating CD3⁺ T cells. After quality control, 11,692 cells from shFOXP1 and shNT tumors were analyzed using uniform manifold approximation and projection (UMAP), identifying 13 transcriptionally distinct clusters that were annotated based on established marker genes (Fig. 2A and Supplemental Fig. S2A) [37-39]. Notably, FOXP1 knockdown induced a marked remodeling of T cell composition, characterized by a significant expansion of effector CD8+ T cells and a concomitant decrease in naïve T cells (Fig. 2A and B). Transcriptomic enrichment analysis showed that CD8+ T cells from FOXP1 knockdown tumors had significantly higher cytokine production and activation signatures (Fig. 2C). This phenotypic shift was further supported by immunofluorescent staining with downregulation of naïve-like CD8+ T cell (TCF1/TCF7+ CD62L+ PD-1-), along with the upregulation of effector CD8+ T cell (CD8+ GZMB+) (Fig. 2D and E). To gain further insight into the differentiation dynamics of T cells in response to FOXP1 knockdown, we performed pseudotime trajectory analysis using Monocle3, setting naïve T (Tn) cells as the root state. This analysis revealed a "Transitional" population that branched into two trajectories: one leading to effector CD8+ T cells expressing GZMA and GZMB, and the other toward effector memory CD8+ T cells, marked by LY6C2 and GZMK (Fig. 2F and G) [39]. As differentiation progressed, effector CD8+ T cells exhibited upregulation of exhaustion markers, including LAG3, PDCD1, and HAVCR2, indicating a trajectory toward functional exhaustion [17, 39].
FOXP1 Knockdown alters the Immune Landscape of PDAC. A UMAP projection of tumor-infiltrating CD3⁺ T cells isolated from shNT and shFOXP1 tumors (10 tumors pooled per group). A total of 11,692 high-quality cells (6,895 shNT and 4,797 shFOXP1) were clustered into 13 transcriptionally distinct populations based on canonical marker gene expression. B Distribution of individual CD3⁺ T-cell clusters in shNT and shFOXP1 tumors. The stacked bar plot shows the relative proportion of each cell cluster identified by single-cell RNA sequencing. C Gene signature enrichment scores for cytokine production and early activation in CD8⁺ T cells derived from scRNA-seq data. D and E Representative images of multiplex immunofluorescence staining of effector CD8⁺ T cells (GZMB⁺CD8⁺) and naïve-like CD8+ T cells (TCF1/TCF7⁺CD62L⁺PD-1⁻) in shNT and shFOXP1 tumors. F Pseudotime trajectory of CD8+ T cells, analyzed using Monocle3. G Feature plots showing the expression of representative marker genes along CD8+ T cell trajectories. Color intensity reflects expression levels. H Quantification of intratumoral CD8⁺ T-cell subsets in end-stage subcutaneous shNT and shFOXP1 tumors by flow cytometry. I-J Representative analysis of CD69⁺ and CD137⁺ CD8⁺ T cells in shNT and shFOXP1 tumors. K-N Representative analysis of TNFα⁺, GZMB⁺, IL2⁺, and IFNγ⁺ CD8⁺ T cells in shNT and shFOXP1 tumors following ex vivo restimulation. O and P Representative analysis of exhausted and proliferating CD8+ T cells in shNT and shFOXP1 tumors. Data are presented as Mean ± SD, n = 6 per group, two-tailed unpaired t test, * p < 0.05, ** p < 0.01.
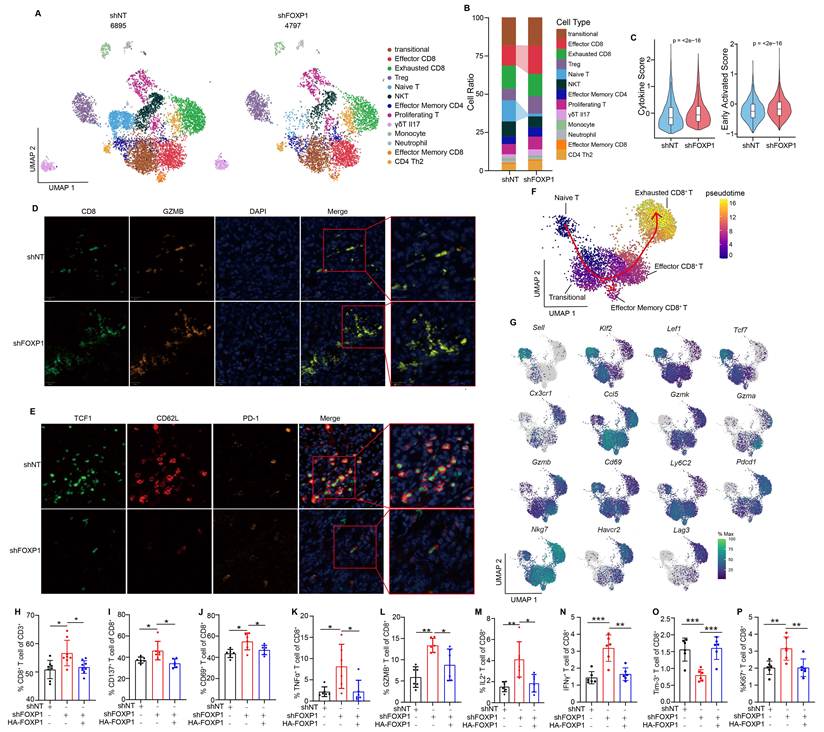
To functionally validate the transcriptional changes identified by scRNA-seq, we next characterized tumor-infiltrating lymphocytes by flow cytometry (Supplemental Fig. S2B). Consistent with the expansion of effector CD8+ T cell cluster, FOXP1-deficient tumors contained significantly more CD8⁺ T cells (Fig. 2H). These cells exhibited a markedly enhanced activation state, with increased expression of CD137 and CD69 (Fig. 2I and J), accompanied by augmented cytotoxic activity, as indicated by elevated GZMB as well as increased production of TNFα, IL2, and IFNγ (Fig. 2K-N). Moreover, FOXP1 deficiency decreased the frequency of Tim-3+ exhausted CD8⁺ T cells without significantly affecting PD-1 expression (Fig. 2O and Supplemental Fig. S2C), while simultaneously increasing the proportion of proliferating CD8⁺ T cells (Fig. 2P). Notably, NK-cell infiltration remained unchanged (Supplemental Fig. S2D), suggesting that the antitumor immune response elicited by FOXP1 loss is primarily mediated through enhanced CD8⁺ T-cell immunity.
FOXP1-mediated immune evasion is dependent on CD8⁺ T cells and the PD-1 pathway
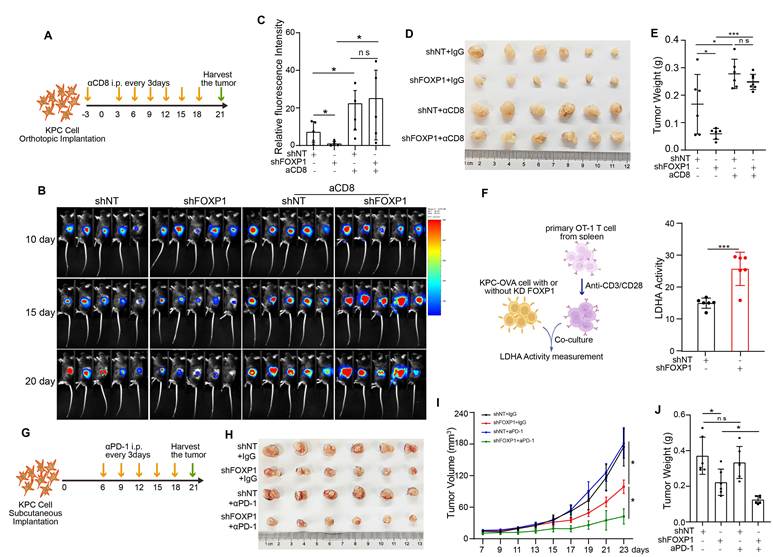
To determine whether the antitumor effects of FOXP1 deficiency are dependent on CD8+ T cells, luciferase-expressing KPC cells with or without FOXP1 knockdown were orthotopically implanted into the pancreas. Mice received antibody beginning three days before tumor implantation and every three days thereafter to deplete CD8⁺ T or CD4+ T cells (Fig. 3A and Supplemental Fig. S3D). CD8⁺ T-cell depletion largely abolished the tumor-suppressive effect of FOXP1 knockdown, as demonstrated by bioluminescence imaging and tumor burden analyses (Fig. 3B-E, Supplemental Fig. S3A and B). In contrast, although CD4⁺ T-cell depletion accelerated tumor growth, it failed to rescue the growth inhibition induced by FOXP1 knockdown (Supplemental Fig. S3E-J), indicating that the antitumor activity resulting from FOXP1 loss is predominantly mediated by CD8⁺ T cells. We next assessed whether FOXP1 deficiency directly increases tumor susceptibility to T cell-mediated cytotoxicity. In co-culture assays, FOXP1-deficient KPC cells were significantly more sensitive to killing by activated CD8⁺ T cells than control cells (Supplemental Fig. S3C). Consistently, antigen-specific cytotoxicity assays using activated OT-1 T cells demonstrated enhanced killing of FOXP1-deficient OVA-expressing KPC cells, further confirming that FOXP1 loss increases tumor cell sensitivity to CD8⁺ T cell-mediated cytotoxicity (Fig. 3F). Given that FOXP1 deficiency enhanced antitumor CD8⁺ T-cell responses, we next examined whether it could improve the therapeutic efficacy of immune checkpoint blockade. Mice bearing subcutaneous shFOXP1 or shNT tumors were treated with anti-PD-1 (aPD-1) antibody or IgG control (Fig. 3G). As expected, FOXP1 knockdown alone significantly inhibited tumor growth, whereas aPD-1 monotherapy had limited efficacy, consistent with the intrinsic resistance of PDAC to PD-1 blockade (Fig. 3H-J). Notably, the combination of FOXP1 knockdown and aPD-1 treatment resulted in substantially greater tumor suppression than either treatment alone (Fig. 3H-J). Collectively, these results demonstrate that FOXP1 promotes immune evasion primarily through suppressing CD8⁺ T-cell-mediated antitumor immunity and that FOXP1 inhibition sensitizes PDAC to PD-1 blockade.
FOXP1-mediated immune evasion is dependent on CD8⁺ T cells and the PD-1 pathway. A Schematic of the aCD8 antibody treatment regimen in mice orthotopically implanted with shNT and shFOXP1 KPC cells. B and C Representative of bioluminescence images (B) and quantification of tumor bioluminescence intensity (C) in mice treated with or without aCD8 antibody. D Representative image of orthotopic tumors from mice bearing shNT or shFOXP1 KPC cells with or without aCD8 treatment. E Quantification of tumor weights from the mice shown in B. F Cytotoxicity of activated OT-1 T cells against OVA-expressing shNT or shFOXP1 KPC cells after co-culture for 24 h, measured by the LDH release assay. G Schematic of the anti-PD-1 (aPD-1) treatment regimen in mice subcutaneously implanted with shNT or shFOXP1 KPC cells. H-J FOXP1 knockdown significantly enhanced the antitumor efficacy of anti-PD-1 therapy in C57BL/6 mice. Representative tumor images (H), tumor growth curves (I), and tumor weights (J) are shown. n = 6 per group, two-tailed t test, * p < 0.05, *** p < 0.001.
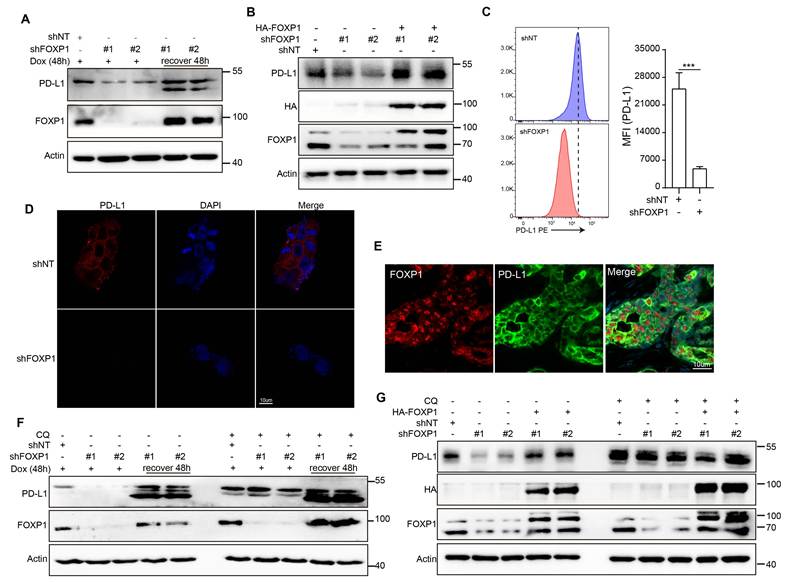
FOXP1 promotes PD-L1 protein expression by inhibiting lysosomal degradation
PDAC cells evade CD8⁺ T cell-mediated killing through PD-L1 expression, which engages PD-1 on T cells. To investigate the mechanism by which FOXP1 mediates immune evasion, we examined the relationship between FOXP1 and PD-L1 expression. Transcriptomic analysis of the TCGA pancreatic cancer cohort revealed no significant correlation between FOXP1 and CD274 (PD-L1) mRNA levels (Supplemental Fig. S4A), and FOXP1 knockdown did not alter CD274 transcription in vitro (Supplemental Fig. S4B). In contrast, western blotting and flow cytometric analyses demonstrated that FOXP1 knockdown significantly reduced both total and membrane-localized PD-L1 protein levels, and this reduction was fully restored by FOXP1 re-expression (Fig. 4A-C). Immunofluorescence analysis further confirmed decreased PD-L1 protein in FOXP1-deficient cells (Fig. 4D). To assess clinical relevance, multiplex immunohistochemistry (IHC) of human PDAC samples revealed that cells expressing FOXP1 exhibited higher PD-L1 levels, supporting the in vivo significance of FOXP1-driven PD-L1 stabilization (Fig. 4E). These findings indicate that FOXP1 regulates PD-L1 post-transcriptionally. Importantly, treatment of FOXP1-deficient cells with chloroquine (CQ), a lysosomal acidification inhibitor, restored PD-L1 protein levels (Fig. 4F and G), demonstrating that FOXP1 stabilizes PD-L1 by preventing its lysosomal degradation. Together, these results define a post-transcriptional mechanism by which FOXP1 promotes immune evasion in pancreatic cancer via stabilization of PD-L1.
FOXP1 promotes PD-L1 protein expression by inhibiting lysosomal degradation. A Western blot analysis of PD-L1 protein levels in PANC1 cells after FOXP1 knockdown induced by doxycycline for 48 h, followed by 48 h recovery. B Western blot analysis of PD-L1 in KPC cells with FOXP1 knockdown. C Flow cytometry analysis and quantification of PD-L1 levels in PANC1 cells following FOXP1 knockdown. D Representative images of immunofluorescence staining of PD-L1 expression in PANC1 cells with FOXP1 knockdown. E Representative images of multiplexed IHC staining of FOXP1 and PD-L1 in human PDAC tissue sections. F PD-L1 protein level was recovered by CQ treatment in PANC1 cells with FOXP1 knockdown. shNT and shFOXP1 cells were treated with CQ (50 uM) for 3 h, cells were harvest and subjected to western blot analysis. G PD-L1 protein level was recovered by CQ treatment in KPC cells with FOXP1 knockdown. ShNT and shFOXP1 cells were treated with CQ (50 uM) for 24 h, cells were harvest and subjected to western blot analysis. *** p < 0.001.
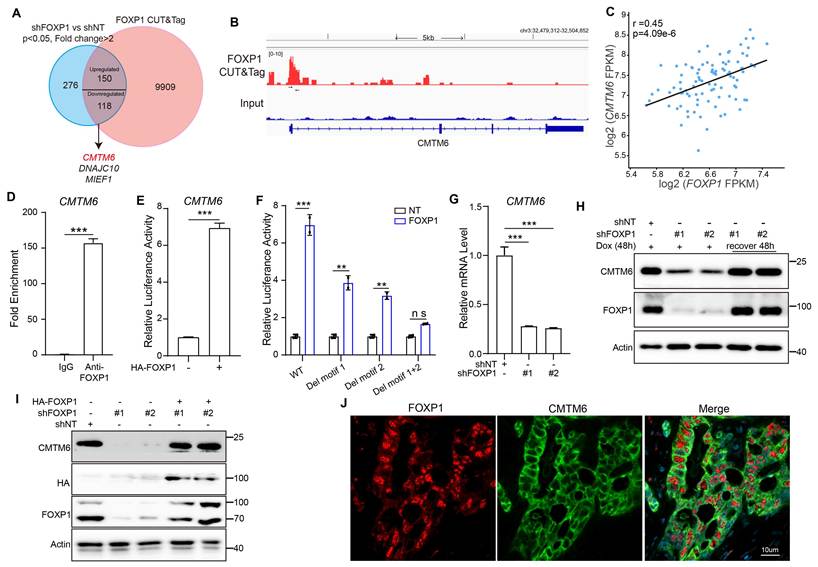
FOXP1 transcriptionally activates CMTM6 expression
To elucidate the mechanism by which FOXP1 stabilizes PD-L1 and mediates immune evasion in pancreatic cancer, we performed bulk RNA sequencing (RNA-seq) on FOXP1-knockdown cells. This analysis identified 544 differentially expressed genes (fold change > 2, p < 0.05) (Fig. 5A and Supplemental Fig. S5A). To pinpoint direct transcriptional targets of FOXP1, we performed CUT & Tag using an anti-FOXP1 antibody. Approximately half of the FOXP1-binding peaks were located within gene promoter regions, confirming the specificity and unbiased nature of our assay (Supplemental Fig. S5B and C, Supplementary Table 2 Additional). Integration of RNA-seq and CUT & Tag data highlighted CMTM6, DNAJC10, and MIEF1 as top candidate targets for FOXP1-mediated transcriptional regulation (Fig. 5A and B, Supplemental Fig. S5D and E). Correlation analysis in the TCGA pancreatic cancer dataset revealed that the mRNA levels of these genes positively associated with FOXP1 expression (Fig. 5C, Supplemental Fig. S5F and G), supporting their regulation by FOXP1 in human tumors. We validated direct promoter binding by ChIP-qPCR in PANC1 cells, confirming FOXP1 enrichment at the promoters of CMTM6, DNAJC10, and MIEF1 (Fig. 5D and Supplemental Fig. S5H). To determine whether FOXP1 transcriptionally activates these genes, we performed luciferase reporter assays. FOXP1 overexpression strongly induced CMTM6 promoter activity and moderately enhanced DNAJC10 and MIEF1 promoters (Fig. 5E and Supplemental Fig. S5I), indicating preferential transcriptional activation of CMTM6 by FOXP1. Bioinformatics analysis of the CMTM6 promoter revealed two critical FOXP1-binding motifs. Sequential deletion of these motifs progressively reduced luciferase activity, with a complete loss upon dual-motif deletion, confirming their importance in FOXP1-mediated transcriptional regulation (Fig. 5F). Consistently, FOXP1 knockdown significantly reduced CMTM6 mRNA levels (Fig. 5G), and at the protein level, FOXP1 depletion decreased CMTM6 expression, which was fully rescued by FOXP1 re-expression (Fig. 5H and I). Finally, multiplex immunohistochemical staining of human PDAC samples revealed co-enrichment of CMTM6 and FOXP1 in tumor cells (Fig. 5J), underscoring the clinical relevance of this regulatory axis. Collectively, these results demonstrate that CMTM6 is a direct transcriptional target of FOXP1.
FOXP1 transcriptionally activates CMTM6 expression. A Flowchart of screening for FOXP1 transcriptionally regulated genes. B FOXP1 occupancy at and around the promoter of CMTM6 gene using CUT & Tag. Black arrows indicate the locations of ChIP-qPCR primers C Representative analysis of the correlation between CMTM6 and FOXP1 mRNA expression in TCGA pancreatic cancer dataset. D FOXP1 enrichment at the exon1 of CMTM6 were shown by ChIP-qPCR in PANC1 cells. E Representative analysis of CMTM6 promoter activity. The CMTM6 gene promoter was co-transfected with FOXP1 in HEK293T cells, the luciferase activity was measured. F Representative analysis of CMTM6 promoter activity with or without deletion of FOXP1 binding motif. The indicated promoter reporter vectors were co-transfected with FOXP1 into HEK293T cells, and luciferase activity was measured. G Representative analysis of CMTM6 mRNA expression level in shNT and shFOXP1 cells. H Knockdown FOXP1 decreases CMTM6 protein expression level in PANC1 cells. FOXP1 knockdown was induced by Dox for 48 h, and then recover for another 48 h, cells were examined by western blot. I Knockdown FOXP1 decreases CMTM6 protein expression level in KPC cells. FOXP1 knockdown and rescue KPC cells were examined by western blot. J Representative images of multiplexed IHC staining of FOXP1 and CMTM6 in human PDAC tissue sections. * p < 0.05, *** p < 0.001.
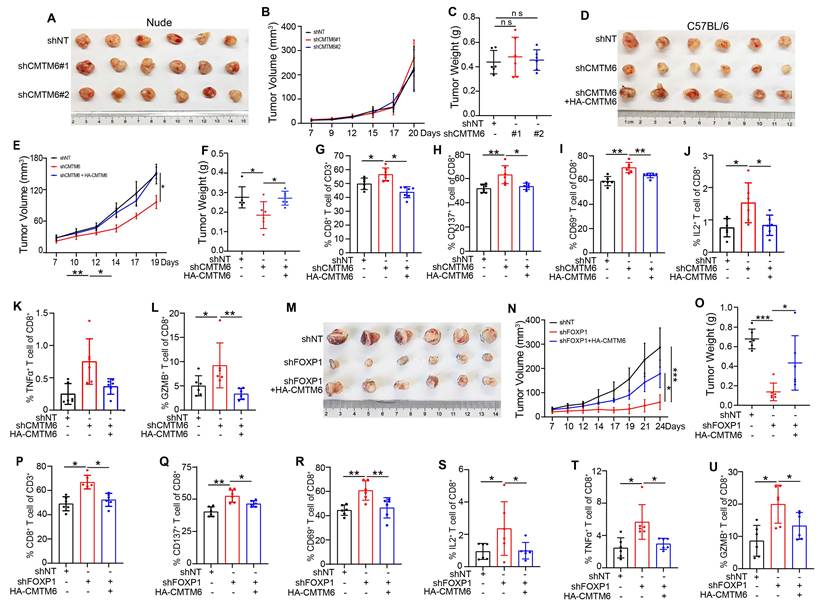
FOXP1 promotes tumor immune evasion through CMTM6
CMTM6 is a well-characterized positive regulator and molecular stabilizer of PD-L1 [7, 8, 40, 41]. Given that FOXP1 transcriptionally upregulates CMTM6, we hypothesized that CMTM6 function as a critical downstream effector mediating FOXP1-driven PD-L1 stabilization and immune evasion in pancreatic cancer. Endogenous co-immunoprecipitation confirmed the interaction of CMTM6 and PD-L1 (Supplemental Fig. S6A). This association was further validated by multiplex immunofluorescence staining of human PDAC specimens (Supplemental Fig. S6B), which demonstrated their co-localization in clinical tumor tissues. Moreover, reintroduction of CMTM6 into FOXP1 knockdown cells restored PD-L1 protein level (Supplemental Fig. S6C and D), supporting CMTM6 as a key downstream mediator of FOXP1-dependent PD-L1 stabilization. To test whether CMTM6 is indeed the critical mediator of FOXP1-driven immune evasion in vivo, we knocked down CMTM6 in pancreatic cancer cells, knockdown efficiency was confirmed by western blotting (Supplemental Fig. S6E). CMTM6 depletion significantly suppressed tumor growth in an immune-dependent manner (Fig. 6A-F), accompanied by a pronounced increase in tumor-infiltrating CD8+ T cells and enhanced cytotoxic function (Fig. 6G-L). These effects closely phenocopied those observed upon FOXP1 knockdown. Importantly, the tumor-suppressive effects of FOXP1 depletion were largely abrogated upon CMTM6 re-expression (Fig. 6M-O). Flow cytometry further confirmed that the accumulation and enhanced cytotoxic activity of CD8⁺ T cells in FOXP1-deficient tumors were dependent on CMTM6 (Fig.6P-U). Together, these findings establish that FOXP1 drives immune evasion primarily through transcriptional activation of CMTM6, which in turn stabilizes PD-L1. This integrated transcriptional-post-translational pathway highlights FOXP1 as a critical tumor-intrinsic regulator of immune evasion and a potential therapeutic target for enhancing immunotherapy efficacy.
FOXP1 promotes tumor immune evasion through CMTM6. A-C knockdown of CMTM6 in KPC cells has comparable effect on tumor growth in nude mice. Tumor image (A), tumor volume (B), and tumor weight (C) are shown. D-F knockdown of CMTM6 in KPC cells significantly inhibited tumor growth in immunocompetent mice. Tumor images (D), volumes (E), and weights (F) are shown. G Flow cytometry analysis of intratumoral CD8+ T cell subsets in end-stage subcutaneous tumors. H and I Representative flow cytometry plots of CD69+ and CD137+ CD8+ T cells in shNT and shCMTM6 tumors. J-L Representative analysis of IL2+, TNFa+, and GZMB+ CD8+ T cells by flow cytometry after restimulation in shCMTM6 versus shNT tumors. M-O Rescue of tumor growth by CMTM6 re-expression in FOXP1-knockdown tumors in C57BL/6 mice. Tumor images (M), volumes (N), and weights (O) are shown. P Flow cytometry analysis of intratumoral CD8+ T cell subsets in end-stage of indicated subcutaneous tumors. Q and R Representative flow cytometry plots of CD69+ and CD137+ CD8+ T cells in shNT and shFOXP1 tumors without restimulation. S-U Representative analysis of IL2+, TNFa+, and GZMB+ CD8+ T cells by flow cytometry in shNT and shFOXP1 tumors after restimulation. n = 6 per group, data are presented as mean ± SD, two-tailed unpaired t test, * p < 0.05, ** p < 0.01, *** p < 0.001.
Conserved immune evasion function of FOXP1 in human PDAC
To assess the clinical relevance of FOXP1 in human PDAC, we first examined its expression in the Cancer Genome Atlas (TCGA) and GSE16515 pancreatic cancer cohorts. FOXP1 expression was markedly higher in pancreatic tumors compared with normal pancreatic tissues (Supplemental Fig. S7A and B), and high FOXP1 levels were associated with poorer overall survival (OS) and relapse-free survival (RFS) in human PDAC cohort (Supplemental Fig. S7C). We next examined the association between FOXP1 expression and clinical responses to ICB. In a public available PDAC cohort treated with a combination of anti-PD-1 and anti-CTLA4 therapies (GSE179351) [42]. Responders exhibited lower FOXP1 expression than non-responders, although the difference did not reach statistical significance because of the limited sample size (Fig. 7A). Consistently, patients with lower FOXP1 levels experienced prolonged overall survival following ICB therapy (Fig. 7B). Similar trends were observed in independent cohorts of bladder cancer (BLCA) and non-small cell lung cancer (NSCLC), where responders likewise displayed lower FOXP1 levels than non-responders (Supplemental Fig. S7D).
Conserved immune evasion function of FOXP1 in human PDAC. A FOXP1 mRNA levels in responder (n = 3) and non-responder (n = 4) in human PDAC ICB cohort GSE179351. B Representative analysis of the correlation between FOXP1 mRNA levels and patients PFS in human PDAC ICB cohort GSE179351. C Schematic of the experiment in NCG mice. D-F Effect of aPD-1 on human PDAC PDX models. Representative of tumor images are shown in (D), Tumor volume and weight are shown in (E) and (F). G Representative images of FOXP1, CD8, and GZMB IHC staining in PDX slides. H Representative images of FOXP1 and CD8 IHC staining in human PDAC tissues. I Quantification of CD8+ T cells per slide was compared between patients with low and high expression levels of FOXP1. J A model depicting FOXP1 promotes pancreatic cancer immune evasion by transcriptionally enhancing CMTM6 gene expression. * p < 0.05.
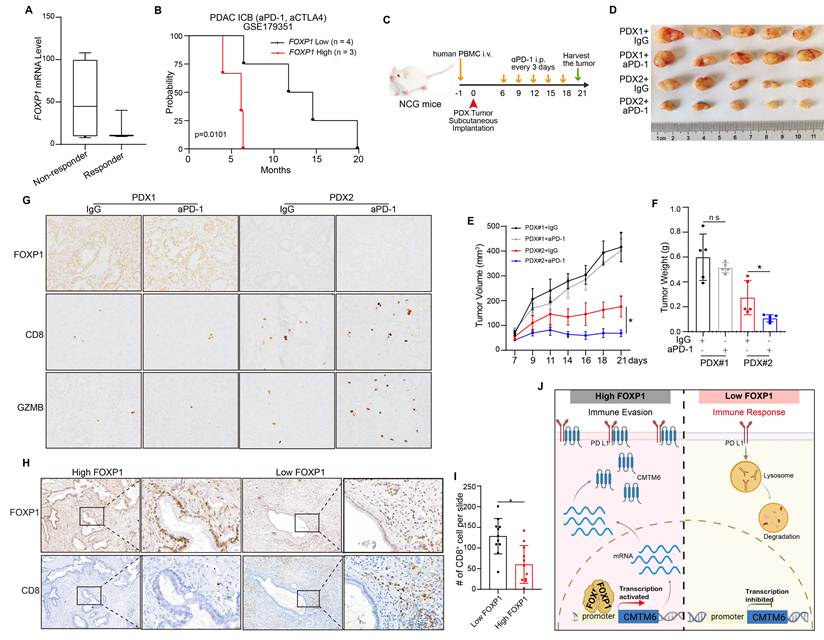
To further evaluate the impact of FOXP1 on ICB responsiveness, we established humanized mouse models using two patient-derived xenografts (PDXs) by engrafting human PBMCs into NCG mice. As baseline characterization of the corresponding patient-derived tumors, immunohistochemical analysis revealed that PDX1 exhibited high FOXP1 expression with sparse intratumoral CD8⁺ T-cell infiltration, whereas PDX2 displayed low FOXP1 expression accompanied by abundant CD8⁺ T-cell infiltration (Supplemental Fig. S7E), indicating an inverse relationship between FOXP1 expression and baseline CD8⁺ T-cell infiltration. Anti-PD-1 antibody treatment was initiated when tumors reached approximately 150 mm³ and administered every three days thereafter (Fig. 7C). Consistent with the FOXP1 expression profile of the original patient tumors, PDX1 remained FOXP1-high whereas PDX2 remained FOXP1-low (Fig. 7G and Supplemental Fig. S7F). Therapeutically, anti-PD-1 treatment markedly inhibited tumor growth in PDX2 but produced minimal antitumor activity in PDX1 (Fig. 7D-F). Moreover, anti-PD-1-treated PDX2 tumors exhibited substantially greater CD8⁺ T-cell infiltration and cytotoxic activity than PDX1 tumors (Fig. 7G), supporting a positive association between low FOXP1 expression and responsiveness to PD-1 blockade. Finally, to validate these findings in clinical specimens, we analyzed CD8⁺ T-cell infiltration in human PDAC tissues stratified by FOXP1 expression. Tumors with high FOXP1 expression contained significantly fewer infiltrating CD8⁺ T cells than FOXP1-low tumors (Fig. 7H and I), further supporting an inverse association between FOXP1 expression and antitumor immune infiltration in human PDAC. Collectively, these results demonstrate that elevated FOXP1 is associated with reduced intratumoral CD8⁺ T-cell infiltration and diminished responsiveness to immune checkpoint blockade, highlighting FOXP1 as a clinically relevant determinant of the immunosuppressive tumor microenvironment in PDAC.
Together, FOXP1 directly binds the CMTM6 promoter to upregulate its transcription. The resultant CMTM6 protein interacts with PD-L1, stabilizing its expression and thereby suppressing CD8⁺ T cell activity to enable immune escape in pancreatic cancer (Fig. 7J).
Discussion
Pancreatic cancer remains one of the most aggressive and lethal malignancies, largely due to its profoundly immunosuppressive tumor microenvironment, which limits the efficacy of current immunotherapies, including immune checkpoint blockade [43]. Understanding the tumor-intrinsic mechanisms that sustain immune evasion is therefore critical for developing strategies to overcome therapeutic resistance. Here, we employed an in vivo CRISPR/Cas9 screen targeting transcription factors in an orthotopic murine PDAC model to systematically identify regulators of antitumor immunity. Multiple established immune evasion mediators, including IRF1, HIF1a, FOXM1, and MYC, were among the top hits, validating the robustness of the screen. Notably, FOXP1 was significantly depleted in tumors grown in immunocompetent hosts compared with those grown in immunodeficient hosts, implicating it as a critical tumor-intrinsic mediator of immune escape. Functional studies confirmed that FOXP1 knockdown markedly inhibited tumor progression in an immune-dependent manner and enhanced responsiveness to ICB, highlighting its functional relevance.
FOXP1, a member of the FOXP transcription factor family, contains conserved functional domains including a forkhead DNA-binding domain, zinc finger motif, and leucine zipper dimerization domain [44]. While FOXP1 has been extensively studied in the context of neurodevelopment [45, 46] as well as lymphocyte development and function [47], its role in cancer biology has only recently begun to emerge and appears to be highly context-dependent. In certain solid tumors, such as lung adenocarcinoma and breast cancer, FOXP1 has been reported to act as a tumor-suppressor, consistent with its localization to the 3p13 chromosomal region, a locus frequently deleted in cancers [48, 49]. In contrast, FOXP1 exerts oncogenic functions in hematological malignancies and hepatocellular carcinoma, where it promotes tumor progression via activation of the Wnt/β-catenin and NF-κB signaling pathways [50, 51]. Our findings add a new dimension, revealing FOXP1 as an active tumor-intrinsic driver of immune evasion in PDAC, rather than a passive marker of tumor progression. Specifically, FOXP1 promotes the formation of an immunosuppressive tumor microenvironment characterized by reduced CD8⁺ T cell infiltration, impaired effector function, and decreased sensitivity to PD-1 blockade.
Emerging evidence from other malignancies supports a context-dependent immunomodulatory role for FOXP1. In breast cancer, FOXP1 expression is inversely associated with tumor-infiltrating lymphocyte abundance [52]. Whereas in cervical cancer, NAT10-mediated N⁴-acetylcytidine modification enhances FOXP1 translation, thereby promoting immune evasion through metabolic reprogramming and the establishment of a lactate-rich tumor microenvironment [53]. Together with our findings, these studies indicate that FOXP1 can function as a versatile regulator of antitumor immunity across cancer types, operating through distinct downstream programs to suppress effective immune responses.
Mechanistically, we identify CMTM6 as a direct transcriptional target of FOXP1 and establish a functional FOXP1-CMTM6-PD-L1 axis that sustains immune checkpoint signaling in pancreatic cancer. CMTM6 has been recognized as a critical post-translational regulator that stabilizes PD-L1 by preventing its lysosomal degradation, thereby maintaining inhibitory signaling within the tumor microenvironment [7, 8]. Elevated CMTM6 expression has been associated with high PD-L1 levels and unfavorable clinical outcomes in multiple malignancies, including NSCLC, glioblastoma, and hepatocellular carcinoma [54-56]. In PDAC, we demonstrate that FOXP1 directly activates CMTM6 transcription, which stabilizes PD-L1 and reinforces immune suppression. Restoration of CMTM6 expression in FOXP1-deficient tumors rescued PD-L1 levels and reversed enhanced CD8⁺ T cell infiltration and cytotoxicity, confirming the hierarchical organization of this pathway. These data reveal a previously unappreciated transcriptional-post-translational coupling that allows pancreatic tumor cells to fine-tune immune checkpoint expression and evade cytotoxic T cell-mediated clearance.
Importantly, FOXP1 not only controls PD-L1 abundance but also shapes the functional quality of intratumoral CD8⁺ T cells, limiting their effector activity and contributing to ICB resistance. Clinical relevance is supported by analyses of public ICB-treated patient cohorts, human PDAC specimens, and humanized PDX models, in which high FOXP1 expression consistently correlates with immunosuppressive features and poor therapeutic outcomes. These findings suggest that FOXP1 functions as an upstream regulator of tumor immune evasion and may represent a promising therapeutic target for enhancing antitumor immunity. Notably, our in vivo studies demonstrated that FOXP1 depletion markedly potentiated the efficacy of anti-PD-1 therapy, indicating that FOXP1-targeted therapy may provide complementary benefits by simultaneously attenuating PD-L1-mediated immune suppression and restoring effective CD8⁺ T-cell function. Although pharmacological inhibitors of FOXP1 are not currently available, recent advances in transcription factor-targeting strategies, including targeted protein degradation and nucleic acid-based therapeutics [57-59], provide a promising foundation for the future development of FOXP1-directed therapies in combination with immune checkpoint blockade.
Collectively, our study identifies FOXP1 as a critical tumor-intrinsic regulator of immune evasion through an in vivo CRISPR screen and establishes the FOXP1-CMTM6-PD-L1 axis as a central mechanism linking transcriptional regulation to immune checkpoint stabilization in pancreatic cancer. Beyond elucidating a previously unrecognized pathway controlling PD-L1 expression, our work suggests that targeting upstream regulators of immune checkpoints may represent a promising therapeutic paradigm for immune-cold tumors such as PDAC. By simultaneously suppressing tumor-intrinsic immune escape and enhancing antitumor T-cell immunity, disruption of the FOXP1-CMTM6 axis may broaden the clinical benefit of immune checkpoint blockade and provide a framework for the rational design of next-generation combination immunotherapies.
Supplementary Material
Supplementary figures and tables.

Supplementary table 1 additional.
Supplementary table 2 additional.
Acknowledgements
We thank Professor Xingxu Huang for critical support with in vivo screening. We thank the central laboratory of the First Affiliated Hospital, School of Medicine, Zhejiang University for providing access to major research instruments and facilities. This work was supported by grants from Zhejiang Provincial Natural Science Foundation of China (LQN25H160044); National Key Research and Development Program of China (2024YFA1306400); “Ling Yan” Research and Development Program of Department of Zhejiang Province Science and Technology (2024C03043); National Natural Science Foundation of China (82188102, 82503104).
Competing Interests
The authors have declared that no competing interest exists.
References
1. Stoop TF, Javed AA, Oba A, Koerkamp BG, Seufferlein T, Wilmink JW. et al. Pancreatic cancer. Lancet (London, England). 2025;405:1182-202
2. Vesely MD, Zhang T, Chen L. Resistance Mechanisms to Anti-PD Cancer Immunotherapy. Annual review of immunology. 2022;40:45-74
3. Zhu YH, Zheng JH, Jia QY, Duan ZH, Yao HF, Yang J. et al. Immunosuppression, immune escape, and immunotherapy in pancreatic cancer: focused on the tumor microenvironment. Cellular oncology (Dordrecht, Netherlands). 2023;46:17-48
4. Patel SJ, Sanjana NE, Kishton RJ, Eidizadeh A, Vodnala SK, Cam M. et al. Identification of essential genes for cancer immunotherapy. Nature. 2017;548:537-42
5. Shalem O, Sanjana NE, Hartenian E, Shi X, Scott DA, Mikkelson T. et al. Genome-scale CRISPR-Cas9 knockout screening in human cells. Science (New York, NY). 2014;343:84-7
6. Hart T, Chandrashekhar M, Aregger M, Steinhart Z, Brown KR, MacLeod G. et al. High-Resolution CRISPR Screens Reveal Fitness Genes and Genotype-Specific Cancer Liabilities. Cell. 2015;163:1515-26
7. Burr ML, Sparbier CE, Chan YC, Williamson JC, Woods K, Beavis PA. et al. CMTM6 maintains the expression of PD-L1 and regulates anti-tumour immunity. Nature. 2017;549:101-5
8. Mezzadra R, Sun C, Jae LT, Gomez-Eerland R, de Vries E, Wu W. et al. Identification of CMTM6 and CMTM4 as PD-L1 protein regulators. Nature. 2017;549:106-10
9. Dersh D, Phelan JD, Gumina ME, Wang B, Arbuckle JH, Holly J. et al. Genome-wide Screens Identify Lineage- and Tumor-Specific Genes Modulating MHC-I- and MHC-II-Restricted Immunosurveillance of Human Lymphomas. Immunity. 2021;54:116-31.e10
10. Gu SS, Zhang W, Wang X, Jiang P, Traugh N, Li Z. et al. Therapeutically Increasing MHC-I Expression Potentiates Immune Checkpoint Blockade. Cancer discovery. 2021;11:1524-41
11. Chiba M, Shimono J, Suto K, Ishio T, Endo T, Goto H. et al. Whole-genome CRISPR screening identifies molecular mechanisms of PD-L1 expression in adult T-cell leukemia/lymphoma. Blood. 2024;143:1379-90
12. Griffin GK, Wu J, Iracheta-Vellve A, Patti JC, Hsu J, Davis T. et al. Epigenetic silencing by SETDB1 suppresses tumour intrinsic immunogenicity. Nature. 2021;595:309-14
13. Lawson KA, Sousa CM, Zhang X, Kim E, Akthar R, Caumanns JJ. et al. Functional genomic landscape of cancer-intrinsic evasion of killing by T cells. Nature. 2020;586:120-6
14. Wang X, Tokheim C, Gu SS, Wang B, Tang Q, Li Y. et al. In vivo CRISPR screens identify the E3 ligase Cop1 as a modulator of macrophage infiltration and cancer immunotherapy target. Cell. 2021;184:5357-74.e22
15. Manguso RT, Pope HW, Zimmer MD, Brown FD, Yates KB, Miller BC. et al. In vivo CRISPR screening identifies Ptpn2 as a cancer immunotherapy target. Nature. 2017;547:413-8
16. Yuan S, Sun R, Shi H, Chapman NM, Hu H, Guy C. et al. VDAC2 loss elicits tumour destruction and inflammation for cancer therapy. Nature. 2025;640:1062-71
17. Sang W, Zhou Y, Chen H, Yu C, Dai L, Liu Z. et al. Receptor-interacting Protein Kinase 2 Is an Immunotherapy Target in Pancreatic Cancer. Cancer discovery. 2024;14:326-47
18. Tang Y, Tang S, Yang W, Zhang Z, Wang T, Wu Y. et al. MED12 loss activates endogenous retroelements to sensitise immunotherapy in pancreatic cancer. Gut. 2024;73:1999-2011
19. Hasan A, Khan NA, Uddin S, Khan AQ, Steinhoff M. Deregulated transcription factors in the emerging cancer hallmarks. Seminars in cancer biology. 2024;98:31-50
20. Li H, Durbin R. Fast and accurate short read alignment with Burrows-Wheeler transform. Bioinformatics (Oxford, England). 2009;25:1754-60
21. Ramírez F, Ryan DP, Grüning B, Bhardwaj V, Kilpert F, Richter AS. et al. deepTools2: a next generation web server for deep-sequencing data analysis. Nucleic acids research. 2016;44:W160-5
22. Kim D, Langmead B, Salzberg SL. HISAT: a fast spliced aligner with low memory requirements. Nature methods. 2015;12:357-60
23. Pertea M, Pertea GM, Antonescu CM, Chang TC, Mendell JT, Salzberg SL. StringTie enables improved reconstruction of a transcriptome from RNA-seq reads. Nature biotechnology. 2015;33:290-5
24. Love MI, Huber W, Anders S. Moderated estimation of fold change and dispersion for RNA-seq data with DESeq2. Genome biology. 2014;15:550
25. Shen W, Le S, Li Y, Hu F. SeqKit: A Cross-Platform and Ultrafast Toolkit for FASTA/Q File Manipulation. PloS one. 2016;11:e0163962
26. Li W, Xu H, Xiao T, Cong L, Love MI, Zhang F. et al. MAGeCK enables robust identification of essential genes from genome-scale CRISPR/Cas9 knockout screens. Genome biology. 2014;15:554
27. Zheng GX, Terry JM, Belgrader P, Ryvkin P, Bent ZW, Wilson R. et al. Massively parallel digital transcriptional profiling of single cells. Nature communications. 2017;8:14049
28. Hao Y, Stuart T, Kowalski MH, Choudhary S, Hoffman P, Hartman A. et al. Dictionary learning for integrative, multimodal and scalable single-cell analysis. Nature biotechnology. 2024;42:293-304
29. Trapnell C, Cacchiarelli D, Grimsby J, Pokharel P, Li S, Morse M. et al. The dynamics and regulators of cell fate decisions are revealed by pseudotemporal ordering of single cells. Nature biotechnology. 2014;32:381-6
30. Hu H, Miao YR, Jia LH, Yu QY, Zhang Q, Guo AY. AnimalTFDB 3.0: a comprehensive resource for annotation and prediction of animal transcription factors. Nucleic acids research. 2019;47:D33-d8
31. Maresca C, Franzè E, Laudisi F, Colella M, Iannucci A, Frascatani R. et al. Smad7 is a negative regulator of immunogenic cell death in colorectal cancer. Oncoimmunology. 2025;14:2490346
32. Shao L, Hou W, Scharping NE, Vendetti FP, Srivastava R, Roy CN. et al. IRF1 Inhibits Antitumor Immunity through the Upregulation of PD-L1 in the Tumor Cell. Cancer immunology research. 2019;7:1258-66
33. Yum S, Li M, Fang Y, Chen ZJ. TBK1 recruitment to STING activates both IRF3 and NF-κB that mediate immune defense against tumors and viral infections. Proceedings of the National Academy of Sciences of the United States of America. 2021 118
34. Dhanasekaran R, Hansen AS, Park J, Lemaitre L, Lai I, Adeniji N. et al. MYC Overexpression Drives Immune Evasion in Hepatocellular Carcinoma That Is Reversible through Restoration of Proinflammatory Macrophages. Cancer research. 2023;83:626-40
35. Bailey CM, Liu Y, Liu M, Du X, Devenport M, Zheng P. et al. Targeting HIF-1α abrogates PD-L1-mediated immune evasion in tumor microenvironment but promotes tolerance in normal tissues. The Journal of clinical investigation. 2022 132
36. Timilsina S, Huang JY, Abdelfattah N, Medina D, Singh D, Abdulsahib S. et al. Epigenetic silencing of DNA sensing pathway by FOXM1 blocks stress ligand-dependent antitumor immunity and immune memory. Nature communications. 2025;16:3967
37. Hu C, Li T, Xu Y, Zhang X, Li F, Bai J. et al. CellMarker 2.0: an updated database of manually curated cell markers in human/mouse and web tools based on scRNA-seq data. Nucleic acids research. 2023;51:D870-d6
38. Franzén O, Gan LM, Björkegren JLM. PanglaoDB: a web server for exploration of mouse and human single-cell RNA sequencing data. Database: the journal of biological databases and curation. 2019. 2019
39. Li H, van der Leun AM, Yofe I, Lubling Y, Gelbard-Solodkin D, van Akkooi ACJ. et al. Dysfunctional CD8 T Cells Form a Proliferative, Dynamically Regulated Compartment within Human Melanoma. Cell. 2019;176:775-89.e18
40. Miao B, Hu Z, Mezzadra R, Hoeijmakers L, Fauster A, Du S. et al. CMTM6 shapes antitumor T cell response through modulating protein expression of CD58 and PD-L1. Cancer cell. 2023;41:1817-28.e9
41. Ho P, Melms JC, Rogava M, Frangieh CJ, Poźniak J, Shah SB. et al. The CD58-CD2 axis is co-regulated with PD-L1 via CMTM6 and shapes anti-tumor immunity. Cancer cell. 2023;41:1207-21.e12
42. Parikh AR, Szabolcs A, Allen JN, Clark JW, Wo JY, Raabe M. et al. Radiation therapy enhances immunotherapy response in microsatellite stable colorectal and pancreatic adenocarcinoma in a phase II trial. Nature cancer. 2021;2:1124-35
43. Falcomatà C, Bärthel S, Schneider G, Rad R, Schmidt-Supprian M, Saur D. Context-Specific Determinants of the Immunosuppressive Tumor Microenvironment in Pancreatic Cancer. Cancer discovery. 2023;13:278-97
44. Katoh M, Katoh M. Human FOX gene family (Review). International journal of oncology. 2004;25:1495-500
45. Co M, Anderson AG, Konopka G. FOXP transcription factors in vertebrate brain development, function, and disorders. Wiley interdisciplinary reviews Developmental biology. 2020;9:e375
46. Takahashi H, Takahashi K, Liu FC. FOXP genes, neural development, speech and language disorders. Advances in experimental medicine and biology. 2009;665:117-29
47. Zhu Z, Lou G, Teng XL, Wang H, Luo Y, Shi W. et al. FOXP1 and KLF2 reciprocally regulate checkpoints of stem-like to effector transition in CAR T cells. Nature immunology. 2024;25:117-28
48. Banham AH, Beasley N, Campo E, Fernandez PL, Fidler C, Gatter K. et al. The FOXP1 winged helix transcription factor is a novel candidate tumor suppressor gene on chromosome 3p. Cancer research. 2001;61:8820-9
49. Sheng H, Li X, Xu Y. Knockdown of FOXP1 promotes the development of lung adenocarcinoma. Cancer biology & therapy. 2019;20:537-45
50. Wang X, Sun J, Cui M, Zhao F, Ge C, Chen T. et al. Downregulation of FOXP1 Inhibits Cell Proliferation in Hepatocellular Carcinoma by Inducing G1/S Phase Cell Cycle Arrest. International journal of molecular sciences. 2016 17
51. Walker MP, Stopford CM, Cederlund M, Fang F, Jahn C, Rabinowitz AD. et al. FOXP1 potentiates Wnt/β-catenin signaling in diffuse large B cell lymphoma. Science signaling. 2015;8:ra12
52. De Silva P, Garaud S, Solinas C, de Wind A, Van den Eyden G, Jose V. et al. FOXP1 negatively regulates tumor infiltrating lymphocyte migration in human breast cancer. EBioMedicine. 2019;39:226-38
53. Chen X, Hao Y, Liu Y, Zhong S, You Y, Ao K. et al. NAT10/ac4C/FOXP1 Promotes Malignant Progression and Facilitates Immunosuppression by Reprogramming Glycolytic Metabolism in Cervical Cancer. Advanced science (Weinheim, Baden-Wurttemberg, Germany). 2023;10:e2302705
54. Yugawa K, Itoh S, Yoshizumi T, Iseda N, Tomiyama T, Morinaga A. et al. CMTM6 Stabilizes PD-L1 Expression and Is a New Prognostic Impact Factor in Hepatocellular Carcinoma. Hepatology communications. 2021;5:334-48
55. Dai F, Duan YL, Feng Q, Song SL, Yang JL, Lv T. CMTM6: A Critical Prognostic Indicator in Non-Small Cell Lung Cancer. Journal of Cancer. 2024;15:2373-9
56. Dai L, Xiao J, Li X, Tao Y, Zhou P, Lyu L. et al. Autophagy-related CMTM6 promotes glioblastoma progression by activating Wnt/β-catenin pathway and acts as an onco-immunological biomarker. The journal of gene medicine. 2024;26:e3685
57. Bushweller JH. Targeting transcription factors in cancer - from undruggable to reality. Nature reviews Cancer. 2019;19:611-24
58. Békés M, Langley DR, Crews CM. PROTAC targeted protein degraders: the past is prologue. Nature reviews Drug discovery. 2022;21:181-200
59. Roberts TC, Langer R, Wood MJA. Advances in oligonucleotide drug delivery. Nature reviews Drug discovery. 2020;19:673-94
Author contact
Corresponding author: Shuaifeng Li, the First Affiliated Hospital, Zhejiang University School of Medicine, Hangzhou, China. E-mail: lisfedu.cn.