Impact Factor ISSN: 1449-2288




Int J Biol Sci 2027; 23(1):137-159. doi:10.7150/ijbs.138349 This issue Cite
Research Paper
Dual Targeting of the FOXM1-ELF3 Reciprocal Transcriptional Circuit as a Promising Therapeutic Strategy for Refractory NSCLC
Jeon-Soo Lee1,2, Young Eun Choi1, Jungho Kim2, Yongdoo Choi1,  , Sung-Ho Goh1,
1. Research Institute, National Cancer Center, 323 Ilsan-ro, Goyang, Gyeonggi-Do, 10408, Republic of Korea.
2. Department of Life Science, Sogang University, 35 Baekbeom-ro, Seoul, 04107, Republic of Korea.
Received 2026-5-26; Accepted 2026-9-25; Published 2027-1-1
Abstract
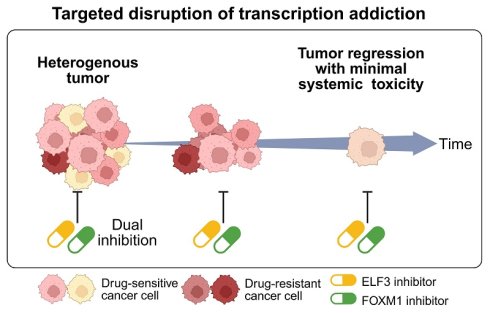
Refractory malignancies frequently rewire transcriptional networks to sustain survival and evade therapy, underscoring the need for strategies that dismantle core oncogenic circuits. Here, we demonstrate that FOXM1 and ELF3 bind each other's promoter regions, establishing a self-reinforcing reciprocal transcriptional circuit that drives feedforward amplification of the Hippo pathway effector YAP1. Using non-small cell lung cancer (NSCLC) as a primary model, we employed thiostrepton (TST) and auranofin (ANF) to pharmacologically target FOXM1 and ELF3, respectively. Dual inhibition synergistically suppressed FOXM1-ELF3-YAP1 oncogenic signaling, achieving marked tumor regression in an A549 NSCLC subcutaneous xenograft mouse model without overt systemic toxicity at the doses and duration tested, as confirmed by histopathological and serum biochemical analyses. Restoration of YAP1 by exogenous expression significantly rescued cell viability under dual inhibition, identifying YAP1 as a principal downstream mediator of this circuit; YAP1 depletion only partially phenocopied dual inhibition, and combined FOXM1/ELF3 loss reduced viability more than YAP1 loss alone, indicating that the circuit also engages YAP1-independent outputs. Importantly, the synergistic activity of dual blockade was conserved in independently established resistance models against both 2nd-generation (afatinib; HCC827AR) and 3rd-generation (osimertinib; HCC827OR) EGFR-TKIs, yielding ZIP synergy scores exceeding 30 in both models. Collectively, these findings identify the FOXM1-ELF3 reciprocal transcriptional circuit as a therapeutically actionable vulnerability and support dual targeting of this axis as a promising strategy for refractory NSCLC, including EGFR-TKI-resistant disease.
Keywords: transcriptional addiction, FOXM1-ELF3 reciprocal loop, dual inhibition, YAP1 feedforward amplification, low systemic toxicity
Introduction
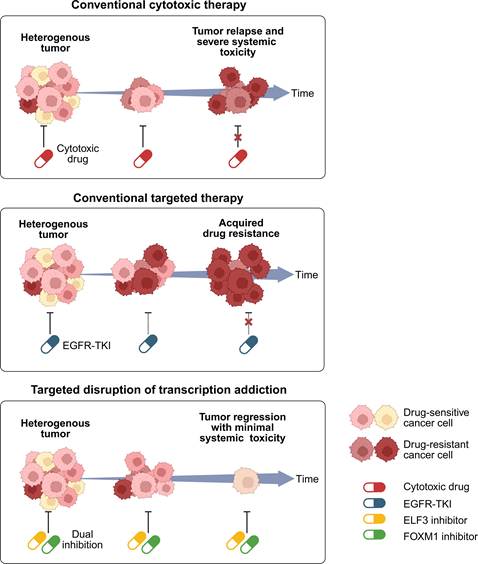
The clinical management of advanced malignancies has historically relied on two distinct paradigms, each constrained by distinct advantages and limitations. Traditional cytotoxic chemotherapy offers broad-spectrum applicability across various cancer types but is severely hampered by its lack of specificity, leading to dose-limiting systemic toxicities including immunosuppression, nausea, and alopecia, as well as limited efficacy in advanced disease. These limitations ultimately result in tumor relapses and severe systemic toxicity, highlighting the urgent need for alternative treatment strategies that improve efficacy while minimizing off-target effects (Figure 1, top). Conversely, targeted therapies, such as EGFR tyrosine kinase inhibitors (EGFR-TKIs), provide high precision and robust initial responses; however, their utility is strictly confined to small patient subsets harboring specific genetic alterations (e.g., EGFR or KRAS mutations), and their efficacy is almost invariably curtailed by the sequential emergence of acquired resistance across successive generations of targeted agents [1-4] (Figure 1, middle). This dichotomy underscores an unmet clinical need for an alternative, promising therapeutic strategy—one that transcends mutation-dependency (like cytotoxic drugs) while maintaining high tumor specificity and low systemic toxicity (like targeted therapies). To survive the intense selective pressures imposed by conventional treatments, refractory cancer cells frequently rewire their global regulatory networks, forcing them to exploit alternative survival mechanisms through transcriptional dependency — defined here as a state in which cancer cell survival becomes disproportionately reliant on the sustained activity of a specific transcription factor network [6]. Consequently, simultaneously dismantling the core transcription factor (TF) networks that govern this transcriptional dependency represents a high-priority strategy to overcome the fundamental limitations of both cytotoxic and targeted therapies with the goal of achieving sustained antitumor efficacy while limiting systemic toxicity (Figure 1, bottom).
Conceptual overview of FOXM1-ELF3 transcriptional addiction as a therapeutic vulnerability in refractory tumors. Conventional cytotoxic chemotherapy (top) induces severe systemic toxicity and eventual tumor relapse, whereas EGFR-targeted therapy (middle) is compromised by the emergence of drug-resistant tumor populations. In contrast, dual targeting of FOXM1 and ELF3 (bottom) disrupts a common transcriptional survival circuit across heterogeneous tumor populations, promoting tumor regression without overt systemic toxicity.
In many aggressive and treatment-refractory cancers, the coordinated activation of these oncogenic programs is strictly dependent on master TFs that form self-reinforcing networks [5-7]. Targeting a single TF often results in adaptive compensation through parallel transcriptional pathways; however, tumors become profoundly vulnerable when the core architecture of their transcriptional dependency is simultaneously dismantled. Here, we propose the disruption of a reciprocal transcriptional dependency driven by Forkhead box M1 (FOXM1) and E74-like ETS transcription factor 3 (ELF3) as a promising therapeutic strategy for FOXM1/ELF3-overexpressing cancers. FOXM1, a master cell cycle regulator frequently overexpressed in advanced malignancies including lung adenocarcinoma [8-11], functions as a potent transcriptional driver of tumorigenesis. ELF3, originally linked to inflammatory signaling, has recently been recognized as a potent oncogenic factor [12,13]. In this study, we reveal that FOXM1 and ELF3 form a robust reciprocal transcriptional circuit, mutually reinforcing each other's expression through direct promoter binding. Furthermore, this reciprocal circuit does not merely sustain the TFs themselves but drives a feedforward amplification of the Hippo pathway effector YAP1, a notorious driver of drug resistance across multiple cancer types.
To validate the translational potential of dismantling this FOXM1-ELF3 architecture, we selected A549 non-small cell lung cancer (NSCLC) subcutaneous xenograft mouse as our primary in vivo proof-of-concept model. Lung cancer remains the most prevalent malignancy worldwide, accounting for 12.4% of new cases and 18.7% of cancer-related deaths, with NSCLC constituting approximately 85% of these cases [14,15]. While targeted therapies and immune checkpoint inhibitors (ICIs) have revolutionized NSCLC treatment [16,17], their broad application is limited by variable response rates, inevitable acquired resistance, severe immune-related adverse events, and substantial economic burdens [18]. In the present study, we find that the reciprocal FOXM1-ELF3 circuit remains active in NSCLC and is retained in independently established models of acquired resistance to both 2nd-generation (afatinib) and 3rd-generation (osimertinib) EGFR-TKIs, suggesting that it constitutes a persistent dependency that is maintained irrespective of therapeutic history and may therefore offer a means to target resistant tumors that have escaped kinase inhibition. In our previous studies, TST was shown to suppress FOXM1 activity [19], whereas ANF suppressed ELF3-associated signaling through its upstream regulator PKCι [20]. Here, TST and ANF were used as pharmacological tool compounds to perturb the FOXM1-ELF3 circuit. Disruption of the FOXM1-ELF3 circuitry markedly reduced YAP1-driven feedforward amplification, leading to pronounced regression of established tumors in vivo with improved tolerability and without overt systemic toxicity at the doses and duration tested. Extending these in vivo findings, we show that the synergistic activity of this strategy is retained even in highly refractory, TKI-resistant models in vitro. Ultimately, this study establishes the pharmacological dismantling of the FOXM1-ELF3 reciprocal transcriptional circuit as a potent therapeutic strategy, providing a rationale for overcoming resistance in treatment-refractory NSCLC.
Materials and Methods
Cell lines and maintenance
All cell lines used in this study, including human NSCLC cell lines (A549, H358, H1299, H1975, HCC827, and PC-9), human breast cancer cell line (MCF7), human colorectal cancer cell lines (HCT116 and SW480), and human embryonic kidney (HEK293) cell were obtained from the American Type Culture Collection (Manassas, VA, USA). All human NSCLC cell lines, MCF7, and SW480 were cultured in RPMI1640 medium (10-040-CV, Corning, Manassas, VA, USA) supplemented with 10% FBS (35-015-CV, Corning, Manassas, VA, USA) and 1× penicillin streptomycin (15140122, Invitrogen, Carlsbad, CA, USA) at 37°C in a humidified atmosphere containing 5% CO2. HCT116 cells were maintained in McCoy 5A medium (16600082, Invitrogen, Carlsbad, CA, USA) supplemented with 10% FBS (35-015-CV, Corning, Manassas, VA, USA) and 1× penicillin streptomycin (15140122, Invitrogen, Carlsbad, CA, USA) at 37°C in a humidified atmosphere containing 5% CO2. HEK293 cells were maintained in DMEM medium (10-013-CV, Corning, Manassas, VA, USA) supplemented with 10% FBS (35-015-CV, Corning, Manassas, VA, USA) and 1× penicillin streptomycin (15140122, Invitrogen, Carlsbad, CA, USA) under the same conditions as the human NSCLC cell cultures.
Establishment and characterization of drug-resistant cell lines
Afatinib-resistant (AR) and osimertinib-resistant (OR) cell lines were established from parental HCC827 cells by stepwise exposure to increasing drug concentrations. To generate AR, HCC827 cells were continuously cultured in the presence of afatinib, with the concentration gradually escalated from 10 nM to 1 µM over a period of 4 weeks. To generate OR, HCC827 cells were continuously cultured in the presence of osimertinib, with the concentration gradually escalated from 10 nM to 2 µM over a period of 6 weeks. At each step, the drug concentration was increased only after the cells resumed stable proliferation. AR and OR were subsequently maintained in culture medium containing 1 µM afatinib and 2 µM osimertinib, respectively; these maintenance concentrations are below the corresponding IC50 values and preserve selective pressure without compromising viability. To determine drug sensitivity, the maintenance inhibitor was withdrawn and cells were allowed to stabilize in standard drug-free medium for at least 24 hours before dose-response analysis, ensuring that measured IC₅₀ values reflect intrinsically acquired resistance. Under these conditions, HCC827AR and HCC827OR exhibited afatinib and osimertinib IC₅₀ values 18.2-fold and 4.4-fold higher, respectively, than those of parental HCC827 cells (Supplementary Figure S8). All cell lines were authenticated by STR profiling and confirmed to be mycoplasma-free.
Antibodies
The following antibodies were used to detect target proteins in this study: for immunohistochemistry and immunocytochemistry, ELF3/ESE1 (ab133621) and FOXM1 (ab207298) (Abcam, Cambridge, United Kingdom); normal rabbit IgG (2729) and YAP (14074) (Cell Signaling Technology); for Western blotting, ELF3/ESE1 (47 kDa) (ab133621), FOXM1 (110 kDa) (sc-271746), YAP (14074) (Cell Signaling Technology) (70 kDa) and β-actin (42 kDa) (sc-47778) (Santa Cruz Biotechnology); and Alexa Fluor 488 goat anti-rabbit IgG (H+L) (A11008) and Alexa Fluor 594 goat anti-mouse IgG (H+L) (A11005) (Thermo Fisher Scientific, Invitrogen). For Western blots, antibodies were applied at 1:1000 dilution in 3% skim milk/1× Tris-buffered saline (TBS) containing 0.05% Tween-20 (P1379, Sigma). For chromatin immunoprecipitation (ChIP), antibodies were used at 1 μg per immunoprecipitation. For immunofluorescence staining, primary antibodies were diluted at 1:100 in PBS containing 5% normal goat serum and 0.05% Tween-20, and Alexa Fluor-conjugated antibodies were diluted at 1:2000 in the same PBS buffer.
ELF3 and FOXM1 expression knockdown
Knockdown of ELF3 and FOXM1 expression at mRNA level was carried out by transfecting with ELF3-specific siELF3 (SI04265660, Qiagen, Germany), FOXM1-specific siFOXM1 (SI04166309, Qiagen, Germany) and Allstar NC siRNA (SI03650318, Qiagen, Germany) at 5 nM using Lipofectamine RNAiMAX (13778150, Thermo Fisher Scientific, Carlsbad, CA, USA) (Supplementary Table S1). siRNA transfections were done according to manufacturer's instructions. In all assays, cells were incubated for 72 h after siRNA transfection.
Treatment of ANF, TST and other reagents
Auranofin (A6733) was purchased from Sigma-Aldrich (Kenilworth, NJ, USA). Thiostrepton (sc-202339) was purchased from Santa Cruz Biotechnology (Dallas, TX, USA). For single-agent experiments, cells were treated with ANF (2 μM) or TST (5 μM). For dual-inhibition experiments, A549 cells were treated with ANF (2 μM) and/or TST (2.5 μM), whereas HCC827 cells were treated with ANF (1 μM) and/or TST (2.5 μM). Unless otherwise indicated, drug treatments were performed for 48 h.
Reverse transcription and semi-quantitative/quantitative PCR
Total RNA was extracted and purified using RNeasy kit (74004, Qiagen, Germany) according to the manufacturer's protocol. mRNA reverse transcription was done using the PrimeScript 1st Strand cDNA Synthesis Kit (6110A, TaKaRa Bio, Otsu, Japan). Semi-quantitative PCR was performed using primers specific for the ELF3 (218 bp), FOXM1 (227 bp), and YAP1 (180 bp) genes. Each pair of primers was designed using Primer 3 software (Supplementary Table S2). The β-actin (318 bp) gene was used as an internal control to normalize target gene expression. Semi-quantitative PCR was performed by general PCR protocol with BioFACT Taq polymerase (ST116-500, BioFACT, Seoul, Korea). Quantitative PCR was performed using LightCycler 480II (Roche Diagnostics) and LightCycler 480 SYBR Green I Master (04887352001, Roche Diagnostics, Germany).
Cell viability assay
The effect of drugs or knockdown on cell viability of A549 and HCC827 was measured using CellTiter-Glo 2.0 luminescent cell viability assay (9243, Promega, Madison, WI, USA). Briefly, 2.5 × 10³ cells per well were seeded in 96-well white plates (3903, Corning, Tewksbury, MA, USA), and treated with drugs (for single drug treatment 2 μM ANF or 5 μM TST for both A549 and for HCC827, for dual inhibition 2 μM ANF + 2.5 μM TST for A549, and 1 μM ANF + 2.5 μM TST for HCC827) for 48 h or siRNA transfection for 72 h, and viability was analyzed by BioTek SYNERGY HTX multi-mode reader (Agilent, CA, USA) according to the manufacturer's protocol.
Dual-luciferase assay
Fragments comprising 0.941 kb ELF3 promoter region containing FOXM1 binding motifs (chromosome 1: 201,977,666-201,978,607, GRCh37/hg19), 0.5 kb of FOXM1 promoter region containing ELF3 binding motifs (chromosome 12: 2,986,544-2,987,043, GRCh37/hg19), and 1.203 kb of YAP promoter region containing ELF3 and FOXM1 binding motifs (chromosome 11: 101,979,009-101,980,211, GRCh37/hg19) were cloned into pGL3-basic plasmid (Promega, Madison, WI, USA). To measure YAP1/TAZ-mediated transcriptional activity, the 8×GTIIC-luciferase reporter plasmid (#34615, Addgene, Watertown, MA, USA) containing synthetic TEAD-binding motifs was utilized. A549, HCC827 and HEK293 cells were co-transfected with the ELF3/FOXM1 overexpression plasmids, the pGL3-basic plasmid containing promoter sequences of ELF3, FOXM1, and YAP1 or the 8×GTIIC-luciferase plasmid, and the pGL4.70 hRluc Renilla luciferase vector (Promega, Madison, WI, USA) using Lipofectamine 3000 or Lipofectamine 2000 (Thermo, Carlsbad, CA, USA). The transfected cells were then treated with auranofin and thiostrepton, and harvested 48 h after transfection or treatment. A dual-luciferase assay was performed using the Dual-Glo Luciferase Assay System (E2920, Promega, Madison, WI, USA) according to the manufacturer's protocol. Luminescence was measured by BioTek SYNERGY HTX multi-mode reader (Agilent, CA, USA). Firefly luciferase activity was normalized to the co-transfected Renilla luciferase activity in the same well, and all reporter data are presented as this normalized ratio expressed as a percentage (% Firefly/Renilla). Where fold changes are cited in the text, they denote the ratio of the normalized percentage in a given experimental condition to that of the corresponding mock-transfected or vehicle-treated control measured in the same experiment.
Rescue experiment
Expression plasmids encoding ELF3 (#25728), FOXM1 (#153136), and YAP1 (#66853) were obtained from Addgene. For 96-well viability assays, 40 ng of expression plasmid was used per well. For genetic rescue experiments, the expression plasmid was co-transfected with 5 nM siRNA using Lipofectamine 3000, and cells were analyzed after 48 h. For pharmacological rescue experiments, expression plasmids were introduced in parallel with the corresponding ANF or TST treatment, and cell viability was evaluated after 48 h. Mock/empty-vector transfections were included as expression controls in the corresponding overexpression experiments, and successful expression of the constructs was verified in the relevant expression analyses.
Measurement of oxidative stress markers
Intracellular reactive oxygen species (ROS), the GSH/GSSG ratio, and the NADPH/NADP+ ratio were measured in cells treated with ANF for 48 h, with cisplatin (1 µM) included as a positive control for oxidative stress. ROS levels were determined using the ROS-Glo H2O2 assay (G8820, Promega), the GSH/GSSG ratio using the GSH/GSSG-Glo assay (V6611, Promega), and the NADPH/NADP+ ratio using the NADP/NADPH-Glo assay (G9081, Promega), each according to the manufacturer's instructions. Luminescence was measured on a BioTek SYNERGY HTX multi-mode reader (Agilent, CA, USA). Assays were performed under the same concentration and time conditions used for the molecular analyses, and signals were normalized to the corresponding untreated control.
Immunocytochemistry and immunofluorescence staining
Cells were fixed in 4% paraformaldehyde (#30525-89-4; FUJIFILM Wako Chemical, Wako, Japan) for 15 min at room temperature, permeabilized with 0.1% Triton X-100 in PBS for 10 min, and blocked with 1% bovine serum albumin in phosphate-buffered saline (PBS) for 1 h to reduce non-specific antibody binding. Cells were co-stained overnight with antibodies targeting ELF3 (ab133621), FOXM1 (sc-271746) and YAP (14074) at 4°C, followed by incubation for 1 h with Alexa Fluor 488/594-labeled secondary antibodies. Nuclei were stained with DAPI. After incubation, the cells were washed with 1× PBS and mounted on glass slides using Prolong Glass Antifade mounting medium (P36982, Thermo Fisher Scientific). Microscopic images were obtained using LSM 780 confocal microscopy system (Zeiss, Oberkochen, Germany) and analyzed using ZEN Blue software (Zeiss, Germany). For quantification of nuclear signals, fluorescence intensity was measured within nuclear regions defined by DAPI staining, and the mean intensity per nuclear area was calculated.
Chromatin immunoprecipitation sequencing (ChIP-seq)
For cross-linking of proteins to DNA, cells were treated for 10 min at 37°C with 0.7% formaldehyde. Cross-linking was quenched by adding 1.25 M glycine to the culture medium at a final concentration of 0.125 M for 5 min. Separated nuclei were sonicated using a Bioruptor NextGen sonicator (Diagenode, Denville, NJ, USA) for 15 min in 30 sec on/60 sec off cycles to obtain 250-500 bp DNA fragments. Sonicated cell lysates containing genomic DNA fragments were precleared with 1 μg of normal rabbit IgG per reaction. Immunoprecipitation was performed using the Protein A/G EZ Magna ChIP kit (17-10086, Merck-Millipore, Burlington, MA, USA). According to the manufacturer's manuals, 1 μg of antibodies targeting ELF3 (ab133621) or FOXM1 (ab207298) was incubated with rotation at 4°C for 16 h, followed by washing, decrosslinking, and digestion of proteins with proteinase K. Immunoprecipitated DNA fragments were purified using a silica column and resuspended in TE buffer (pH 8.0) for sequencing and PCR. Primers specifically amplifying the ELF3/FOXM1 binding region were designed for ChIP-PCR to evaluate the quality of ChIP (Supplementary Table S3). The DNA library was prepared using the NEB Ultra DNA Library Prep Kit for Illumina (E7370L, NEB, Ipswich, MA, USA), and next-generation sequencing was performed on an Illumina NovaSeq6000 (Illumina, San Diego, CA, USA).
The ChIP-seq experiment was designed as a discovery-level screen to identify candidate binding regions of FOXM1 and ELF3, and each condition was profiled as a single library without biological replicates; the quantitative, replicate-based conclusions of this study are instead based on ChIP-PCR at the ELF3 (264 bp), FOXM1 (383 bp), and YAP1 (185 bp) promoter regions (Figure 5C, D and Figure 7D, E). After adapter removal and quality trimming, single-end reads were aligned to the human reference genome (UCSC hg19) using Bowtie2 with default end-to-end settings. Peaks were called with MACS2 using the human effective genome size preset (-g hs) and a q-value cutoff of 0.01, retaining at most one read per genomic position (--keep-dup 1) and using the --call-summits option; matched input or IgG control libraries were not generated, so peak calling was performed without a control library. Sequencing depth, mapping rates, and peak numbers for all libraries are provided in Supplementary Table S4. For between-sample comparison, raw read counts per peak were normalized using the trimmed mean of M-values (TMM) method and expressed as log2-CPM values; because this normalization is not designed to detect a genome-wide change in occupancy and no exogenous spike-in was used, the genome-wide comparisons were treated as relative and exploratory, and changes in occupancy at individual promoters were confirmed by ChIP-PCR. ChIP-seq raw data have been deposited in the European Nucleotide Archive (ENA) under accession number PRJEB101315.
Xenograft tumor mouse model
A549 (3 × 10⁶) cells were subcutaneously implanted into BALB/c nude mice (CAnN.CgFoxn1nu/CrljOri; Orient Bio, Seoul, Korea). All animal studies were approved by the Institutional Animal Care and Use Committee (IACUC) of the National Cancer Center Research Institute (NCC-23-974). At 10-14 days post-implantation, mice in the control group (n = 5) were intraperitoneally injected with DMSO solution. Each single-treatment group received intraperitoneal injections of either TST [19] or ANF [20] dissolved in DMSO every 48 h from day 1 to day 11 at doses of 17 and 10 mg/kg, respectively (n = 5 per group). The dosage of ANF and TST was safely applied according to previous studies. The dual inhibition (DI) group (n = 5) received intraperitoneal injections of both TST and ANF every 48 h from day 1 to day 11 at doses of 17 and 10 mg/kg, respectively. The tumor volume and body weight of the mice were measured every other day. The tumor volume (V) was calculated as A×B2/2, where A and B are long and short diameters (mm), respectively. Two days after the final injection (day 13), all mice were sacrificed, and tumor tissues were collected for immunofluorescence staining.
The tissues were fixed in 10% neutral-buffered formalin and embedded in paraffin blocks. To monitor in vivo toxicity and physiological effects of the tested drugs, serum biochemical analyses were performed. In addition, major organs (liver, spleen, lung, heart, and kidney) were collected, sectioned, and stained with hematoxylin and eosin (H&E) to assess histopathological changes.
Another set of tumor-bearing mice was prepared to further evaluate the long-term antitumor efficacy of the dual inhibition regimen. Mice in the control group (n = 5) were intraperitoneally injected with a DMSO solution from day 1 to day 25. The DI group (n = 5) received intraperitoneal injections of both TST and ANF every 48 h from day 1 to day 25 at doses of 17 and 10 mg/kg, respectively. Tumor volume and body weight were measured every other day. On day 27, all mice were sacrificed, and their organs and blood were collected for histopathological and serum biochemical analyses.
Evaluation of drug interaction
To evaluate the interaction between TST and ANF, the coefficient of drug interaction (CDI) was calculated for both in vitro and in vivo experiments. For the in vitro assays, CDI was determined based on relative cell viability using the following formula [20]:
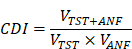
where  is the relative cell viability of the combined treatment, and
 and
 are the relative cell viabilities of the single-agent treatments, respectively.
For the in vivo tumor xenograft mouse model, CDI was calculated based on the relative tumor volume according to the following equation:
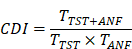
where  represents the relative tumor size (mean tumor volume of the combination group divided by that of the control group), and
 and
 represent the relative tumor sizes of the TST and ANF single-treatment groups, respectively. A CDI value of <1, =1, or >1 indicates synergism, additivity, or antagonism, respectively. Specifically, a CDI value of <0.7 was considered to indicate a significant synergistic effect.
Data visualization and statistical analysis
Data are presented as mean ± SD. For comparisons involving more than two groups or multiple pairwise comparisons, one-way or two-way ANOVA was used, followed by Tukey's multiple comparisons test, as a post hoc statistical analysis; a two-tailed Student's t-test was used only for single comparisons between two groups. Statistical significance was defined as *P < 0.05, **P < 0.01, and ***P < 0.001. The following software was used for data analysis: ExPADA v2.0.1 (eBiogen Inc., Seoul, Korea) for analyzing and visualizing ChIP-seq data; LightCycler Software (Roche Diagnostics) for analyzing quantitative-PCR data; ZEN v3.0 (Zeiss) for confocal imaging; cellSens Standard v1.14 for microscopic imaging; and GraphPad Prism 11 for statistical analysis.
Survival analysis
Kaplan-Meier survival analyses were performed using publicly available lung adenocarcinoma (LUAD) data from The Cancer Genome Atlas (TCGA, Firehose Legacy cohort) accessed via the cBioPortal for Cancer Genomics (www.cbioportal.org). For the present survival analysis, the “altered” group was defined as mRNA expression with z-score threshold ±2.0 relative to diploid samples, RNA-Seq V2 RSEM; all remaining cases were classified as “unaltered.”
Results
FOXM1 and ELF3 reciprocally regulate a transcriptional network
To investigate whether the FOXM1-ELF3 transcriptional network represents a broad therapeutic vulnerability rather than a cancer-specific anomaly, we first evaluated the basal expression levels of these two master transcription factors across multiple cell line models representing major human cancers. Notably, RT-PCR analyses revealed a concurrent overexpression of FOXM1 and ELF3 in multiple aggressive malignancies, including colorectal cancer (CRC; e.g., HCT116 and SW480) and breast cancer (BRCA; e.g., MCF7) cell lines (Supplementary Figure S1A). Consistent with these in vitro findings, we next examined the clinical implications of FOXM1 and ELF3 alterations in lung adenocarcinoma (LUAD) using The Cancer Genome Atlas (TCGA) data available through cBioPortal (Firehose legacy data) [21]. Alterations in FOXM1 and ELF3 significantly correlated with poorer overall survival outcomes in LUAD patients (FOXM1, P = 0.0001; ELF3, P = 0.0085) (Figure 2A, B and Supplementary Table S5-S6). These clinical findings collectively justified the selection of NSCLC as our primary model to investigate the therapeutic relevance of the FOXM1-ELF3 network.
FOXM1 and ELF3 reciprocally regulate a transcriptional network. (A-B) Kaplan-Meier survival analyses for LUAD patients with altered versus unaltered FOXM1 expression (A) and ELF3 (B) from TCGA (cBioPortal, Firehose legacy). In this analysis, "alteration" was defined as mRNA expression (z-score threshold ±2.0 relative to diploid samples, RNA-Seq V2 RSEM) in the TCGA LUAD cohort. Because relatively few cases showed underexpression (z < -2.0), this subgroup was not analyzed separately for survival. (C-D) Bar plot of FOXM1 (C) and ELF3 (D) expression (nTPM) across various NSCLC cell lines (Protein Atlas database). (E, F) RT-PCR analysis (E) and immunoblotting (F) of FOXM1 and ELF3 expression in 6 NSCLC cell lines. (G, H) Heatmap (G) and Venn diagram (H) summarizing genes associated with differential FOXM1 or ELF3 chromatin occupancy following TST or ANF treatment in A549 cells. (I, J) Scatter plots highlight top-ranked genes associated with altered FOXM1 (I) or ELF3 (J) chromatin occupancy.
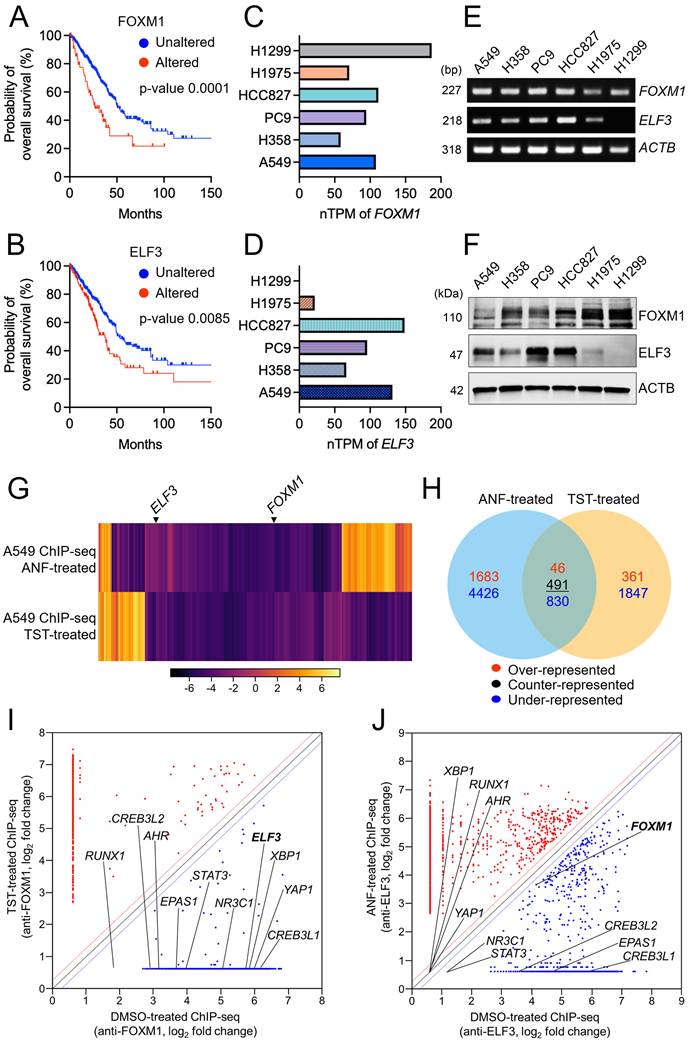
Subsequently, to select the appropriate NSCLC cell line to analyze the regulation of FOXM1 and ELF3, we assessed FOXM1 and ELF3 mRNA expression (normalized Transcripts Per Million; nTPM) across various NSCLC cell lines using Protein Atlas data [22] and reverse transcription polymerase chain reaction (RT-PCR) analysis. Database analyses indicated elevated expression of both FOXM1 and ELF3 in A549 and HCC827 cell lines (Figure 2C, D). In accordance, RT-PCR and immunoblotting analyses confirmed the robust expression of both factors in A549 and HCC827 cells (Figure 2E, F). Given these differential expression patterns, we selected A549 and HCC827 cells for further investigation of a hypothesized regulatory relationship between FOXM1 and ELF3.
To investigate the transcriptional regulatory network controlled by FOXM1 and ELF3, A549 cells were treated with either TST or ANF—pharmacological tools to suppress FOXM1 or ELF3, respectively—subjected to ChIP-seq analysis (Supplementary Table S4). FOXM1- or ELF3-bound DNA fragments were immunoprecipitated, sequenced, and categorized based on FOXM1 or ELF3 inhibition. Importantly, in two distinct datasets representing changes in chromatin binding upon FOXM1 or ELF3 inhibition, FOXM1 and ELF3 reciprocally affected each other (Figure 2G). At the level of genes assigned to called peaks, FOXM1 inhibition resulted in over-representation of 361 genes and under-representation of 1,847 genes in A549 cells. Upon ELF3 inhibition, 1,683 genes were exclusively over-represented, and 4,426 genes exclusively under-represented (Figure 2H). Among the commonly represented genes, 46 were over-represented, 491 were counter-represented—exhibiting opposing directional changes between the two inhibition conditions—and 830 were commonly under-represented by inhibition of FOXM1 and ELF3 (Figure 2H, Supplementary Table S7-S9). Among the 830 commonly under-represented genes, we found 151 TFs (Supplementary Table S10), which were classified as pan-cancer oncogenic TFs as reported in another ChIP-seq study [23]. Among the 151 oncogenic TFs, we identified 11 LUAD-specific TFs (Supplementary Table S11) that were commonly under-represented by FOXM1 and ELF3 inhibition in the scatter plots (Figure 2I, J). These findings suggest that FOXM1 and ELF3 have clinical importance in regulating key components of the oncogenic transcriptional network.
Disruption of FOXM1-ELF3 transcriptional addiction impairs cell viability and nuclear stability
To experimentally validate whether NSCLC cells are functionally dependent on the FOXM1-ELF3 network, we first genetically dismantled this circuit in A549 and HCC827 cells using siRNA-mediated knockdown. Genetic knockdown of either FOXM1 or ELF3 markedly reduced cell confluency and viability compared to the negative control (NC siRNA), establishing the important role of these TFs in sustaining cancer cell survival (Figure 3A). Specifically, siELF3 treatment markedly reduced cell viability to 16.2% and 12.5% in A549 and HCC827 cells, respectively, compared to negative control (NC siRNA). Similarly, siFOXM1 treatment resulted in comparable reductions to 18.5% and 14.4%, respectively (Figure 3A). Consistent reductions in cell viability were also observed in colorectal cancer (HCT116 and SW480) and breast cancer (MCF7) cell lines, suggesting the broad applicability of this dependency across cancer types (Supplementary Figure S1B).
FOXM1 and ELF3 knockdown inhibit cell growth and viability in NSCLC cells. (A) Microscopic image (upper panel) and cell viability assays (lower panel) demonstrate significantly decreased cell confluency and viability in A549 and HCC827 NSCLC cell lines following siRNA-mediated knockdown of ELF3 (siELF3) and FOXM1 (siFOXM1). NC: negative control. Scale bar 50 μm. (B) Microscopic images (upper panel) and corresponding cell viability assays (lower panel) illustrating reduced viability and confluency. Single treatment of ANF (2 μM) and TST (5 μM), used here as pharmacological tools to suppress ELF3- and FOXM1-associated signaling, respectively. Cell lines showed differential sensitivity to inhibitors; A549 cells were more sensitive to TST, and HCC827 cells were more responsive to ANF. Scale bar 50 μm. (C) RT-PCR analysis confirming efficient knockdown of FOXM1 and ELF3 at the mRNA level in both A549 and HCC827 cells treated with siRNAs or inhibitors (ANF and TST). ACTB served as an internal control. (D) Western blot analysis validating corresponding changes at the protein level upon siRNA-mediated knockdown or drug treatments in both cell lines. β-actin served as a loading control. Densitometric quantification of independent replicates (n = 3) was presented as bar-plot. (E, F) Immunofluorescence staining demonstrating decreased nuclear localization of ELF3 (red) and FOXM1 (green) following siRNA knockdown (E) or drug treatments (F). Nuclei were stained with DAPI (blue). Intensity per area of fluorescence was quantified in below bar plots. Scale bar 50 μm. (G) Rescued cell viability by siELF3/siFOXM1 transfection with ELF3/FOXM1 overexpression in A549 (left) and HCC827 (right) cells. (H) Rescued cell viability by ANF/TST treatments with ELF3/FOXM1 overexpression in A549 (left) and HCC827 (right) cells. *P < 0.05, **P < 0.01, ***P < 0.001.
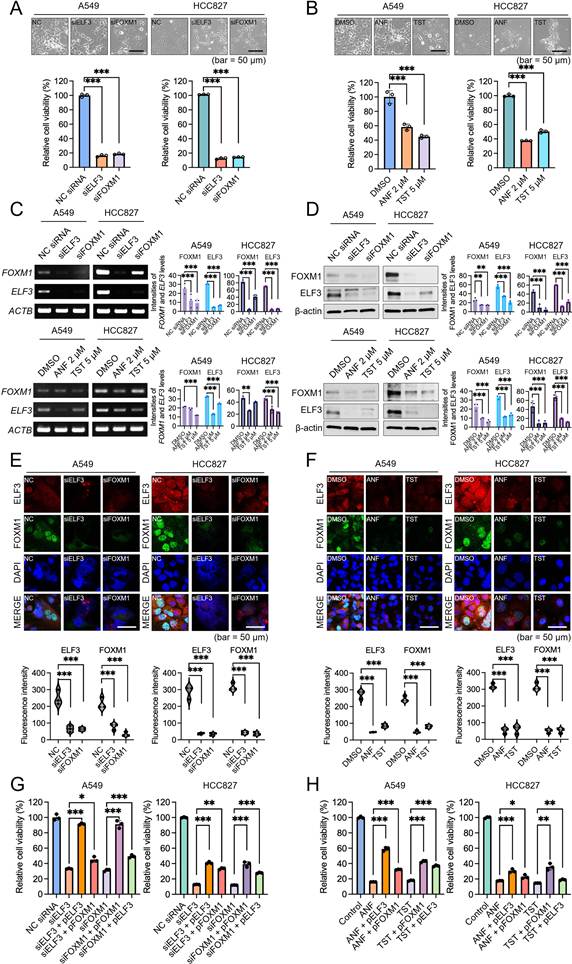
To translate these genetic findings into a pharmacologically actionable strategy, we utilized two tool compounds: ANF, which suppresses ELF3 by inhibiting its upstream activator PKCι — a kinase that phosphorylates ELF3 to promote its nuclear translocation and transcriptional activity [20] — and TST, which directly inhibits FOXM1 by binding to its forkhead domain and preventing DNA binding [19]. These compounds were used strictly as pharmacological tool compounds to perturb the FOXM1-ELF3 circuit. Crucially, these single-agent treatments successfully phenocopied the siRNA outcomes, severely diminishing cell confluency and viability (Figure 3B and Supplementary Figure S1C-S1F). Interestingly, differential sensitivities emerged between the two cell lines; A549 cells were more responsive to TST treatment (44.8% viability at 5 μM TST), whereas HCC827 cells exhibited greater sensitivity to ANF (37.8% viability at 2 μM ANF) (Figure 3B). This variance highlights the heterogeneous dependency of different cancer cell lines on specific nodes within the FOXM1-ELF3 regulatory axis.
Molecular analyses further revealed the strict reciprocal dependency driving this circuit. RT-PCR and Western blot analyses showed that knocking down one factor reduced the level of the other. At the transcriptional level, siFOXM1 significantly attenuated ELF3 mRNA expression, while siELF3 likewise reduced FOXM1 mRNA expression (Figure 3C, left panel). Pharmacological intervention with ANF and TST recapitulated this mutual suppression, with slightly more modest reductions at the mRNA level than direct genetic ablation (Figure 3C, right panel). At the protein level, the reciprocal reduction was more pronounced: ELF3 knockdown lowered FOXM1 protein levels in both cell lines, and vice versa, as confirmed by densitometric quantification of biological replicates (Figure 3D). Pharmacological inhibition and siRNA-mediated knockdown produced comparable suppression of FOXM1 and ELF3 at the protein level (Figure 3D), consistent with the distinct mechanisms by which each approach reduces protein abundance: TST disrupts FOXM1 autoregulation at the transcriptional level [19], whereas ANF-mediated PKCι inhibition reduces ELF3 nuclear translocation and may additionally affect ELF3 protein stability through post-translational mechanisms [20].
The nuclear localization of this TF network was further evaluated by immunofluorescence staining, with fluorescence intensity quantified within DAPI-defined nuclear regions. Following both genetic knockdown and pharmacological intervention, the nuclear accumulation of FOXM1 and ELF3 proteins was markedly reduced (Figure 3E, F). These findings indicate that the mutual reinforcement between FOXM1 and ELF3 supports their nuclear accumulation.
To further confirm that the observed reductions in cell viability were specifically attributable to the loss of ELF3 and FOXM1 function rather than off-target effects, rescue experiments were performed by exogenously restoring the expression of the respective TFs alongside siRNA-mediated knockdown or pharmacological inhibition. Overexpression of ELF3 or FOXM1 significantly rescued cell viability in both A549 and HCC827 cells subjected to siELF3 or siFOXM1 knockdown (Figure 3G). Similarly, exogenous restoration of either TF substantially reversed the anti-proliferative effects induced by ANF or TST treatment in both cell lines (Figure 3H). Together, these rescue data support a substantial contribution of FOXM1-ELF3 circuit suppression to the observed reduction in cell viability following genetic or pharmacological perturbation.
Dual inhibition of ELF3 and FOXM1 promotes synergistic anticancer effects in NSCLC cells
Having established the strict reciprocal dependency between FOXM1 and ELF3, we hypothesized that simultaneously inhibiting both nodes of this reciprocal circuit would more effectively disrupt the tumor-cell survival circuitry. To evaluate this therapeutic strategy, we treated A549 and HCC827 cells with pharmacological tool compounds (ANF for ELF3, TST for FOXM1) and their combination. Using the Zero Interaction Potency (ZIP) scoring method, in which a ZIP score exceeding 10.0 designates robust synergism [24], dual inhibition yielded ZIP scores of 25.27 and 18.42 in A549 and HCC827 cells, respectively (Figure 4A and Supplementary Figure S2A-S2B). These data validate that combined pharmacological intervention disrupts the network more effectively than the additive effects of single agents.
Dual inhibition of ELF3 and FOXM1 by combined treatment with ANF and TST promotes synergistic anticancer effects in NSCLC cells. (A) ZIP synergy score analyses illustrating significant synergism between ANF and TST treatments in A549 (ZIP score = 25.27) and HCC827 (ZIP score = 18.42) cells. ZIP scores above 10.0 indicate strong synergism. (B) Cell viability assays validating synergistic reduction in relative cell viability upon combined ANF and TST treatment. Dual inhibition (DI) resulted in significantly greater reduction in viability compared with single treatments. (C) RT-PCR analyses demonstrating a marked decrease in FOXM1 and ELF3 mRNA expression levels following dual inhibition compared to single treatments. (D) Western blot analyses confirming substantial reductions in FOXM1 and ELF3 protein expression upon dual inhibition relative to single treatments in both A549 and HCC827 cell lines. β-actin served as a loading control. Densitometric quantification of independent replicates (n=3) was presented as bar-plot. (E, F) Immunofluorescence images of ELF3 (red) and FOXM1 (green) proteins demonstrate significant impairment of nuclear localization following dual inhibition in A549 (E) and HCC827 (F) cells. DAPI (blue) staining indicates cell nuclei. Fluorescence intensity per unit area was quantified and presented in the bar plot of each figure. Scale bars 25 μm. **P < 0.01, ***P < 0.001.
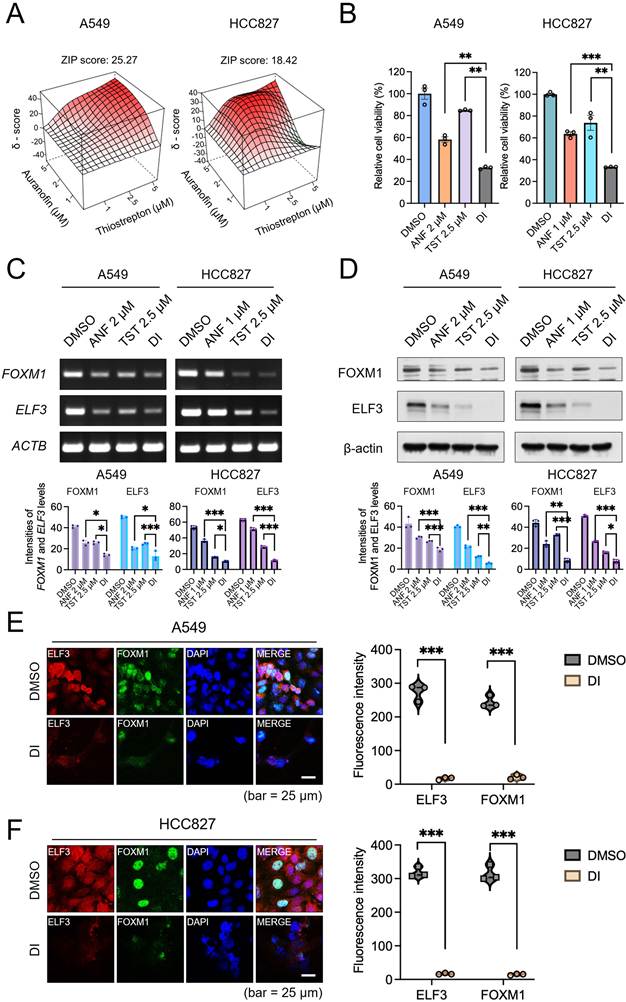
We further pinpointed the optimal drug concentrations required to maximize this synergistic reduction in relative cell viability (Figure 4B). In A549 cells, individual treatments with 2 μM ANF or 2.5 μM TST reduced viability to 58.2% and 84.8%, respectively, while their combination reduced viability to 34.4%. This interaction yielded a Coefficient of Drug Interaction (CDI) of 0.697, below the threshold (< 0.7) that defines highly significant synergy [25]. Similarly, while individual treatments with 1 μM ANF or 2.5 μM TST reduced viability to 63.7% and 73.8%, respectively, combining 1 μM ANF and 2.5 μM TST in HCC827 cells resulted in a drop in viability to 33.2% (CDI = 0.706) (Figure 4B). The dose-response matrices further revealed that this growth inhibition occurs across a broad range of tested concentrations (Supplementary Figure S2C-S2D).
To confirm that this synergistic reduction in cell viability stems directly from the targeted disruption of the transcriptional circuitry, we assessed the molecular integrity of the FOXM1-ELF3 network following combined treatment. Dual inhibition induced pronounced reduction in both FOXM1 and ELF3 expression at both the mRNA (Figure 4C) and protein (Figure 4D) levels at 48 h, exceeding the suppressive effects of individual treatments. Importantly, reductions in FOXM1 and ELF3 protein levels were already detectable at 24 h (Supplementary Figure S3), supporting an early molecular response to dual inhibition. Furthermore, immunocytochemical analysis revealed a marked reduction in the nuclear localization of both TFs in A549 (Figure 4E and Supplementary Figure S4A) and HCC827 (Figure 4F and Supplementary Figure S4B) cells, consistent with the greater molecular suppression achieved by dual inhibition relative to single-agent treatments (Figure 3E, F). Taken together, these findings indicate that the simultaneous pharmacological inhibition of the FOXM1-ELF3 axis markedly suppresses their nuclear accumulation, thereby neutralizing the core survival mechanism of these aggressive tumors.
FOXM1 and ELF3 establish a reciprocal transcriptional addiction through direct promoter binding
Having established the functional dependency between FOXM1 and ELF3, we hypothesized that this transcriptional dependency is structurally hardwired into the genome through direct, reciprocal promoter regulation. Bioinformatic interrogation using the HOCOMOCO TF database [26] and the UCSC genome browser [27] corroborated this hypothesis, revealing highly conserved putative binding motifs for FOXM1 (5′-TGTTT-3′) within the ELF3 promoter region, and conversely, for ELF3 (5′-AGGAA-3′) within the FOXM1 promoter (Figure 5A, B).
FOXM1-ELF3 feedback circuit drives reciprocal transcriptional regulation. (A, B) Bioinformatic analysis showing putative FOXM1 (TGTTT) binding motif within the ELF3 promoter region (A) and ELF3 (AGGAA) binding motif within the FOXM1 promoter region (B), identified using the HOCOMOCO TF database and UCSC genome browser. (C, D) Chromatin immunoprecipitation-PCR (ChIP-PCR) assays demonstrating significant binding of FOXM1 to the ELF3 promoter (C) and ELF3 to the FOXM1 promoter region (D). FOXM1 binding was notably reduced by TST treatment, while ELF3 binding was reduced by ANF, confirming reciprocal binding regulation. (E, F) Dual-luciferase reporter assays validating transcriptional activation by FOXM1 and ELF3 on each other's promoters. FOXM1 overexpression significantly increased ELF3 promoter activity, an effect reversed by TST treatment (E). Similarly, ELF3 overexpression significantly enhanced FOXM1 promoter activity, reversed by ANF treatment (F). Data are presented as normalized ratios (% Firefly/Renilla), mean ± SD (n = 3). (G) Real-time PCR analysis in HEK293 cells. Values on the y-axis represent ACTB-normalized relative mRNA levels; fold changes cited in the text refer to the ratio of these values relative to mock-transfected control. Exogenous ELF3 expression significantly elevated FOXM1 mRNA (2.99 → 21.03; ~7.0-fold over mock), and FOXM1 overexpression increased ELF3 mRNA (0.88 → 4.25; ~4.8-fold over mock). (H) Western blot analysis confirms that overexpression of ELF3 or FOXM1 elevates the protein expression of the respective counterpart in HEK293 cells. β-actin served as a loading control. *P < 0.05, **P < 0.01, ***P < 0.001.
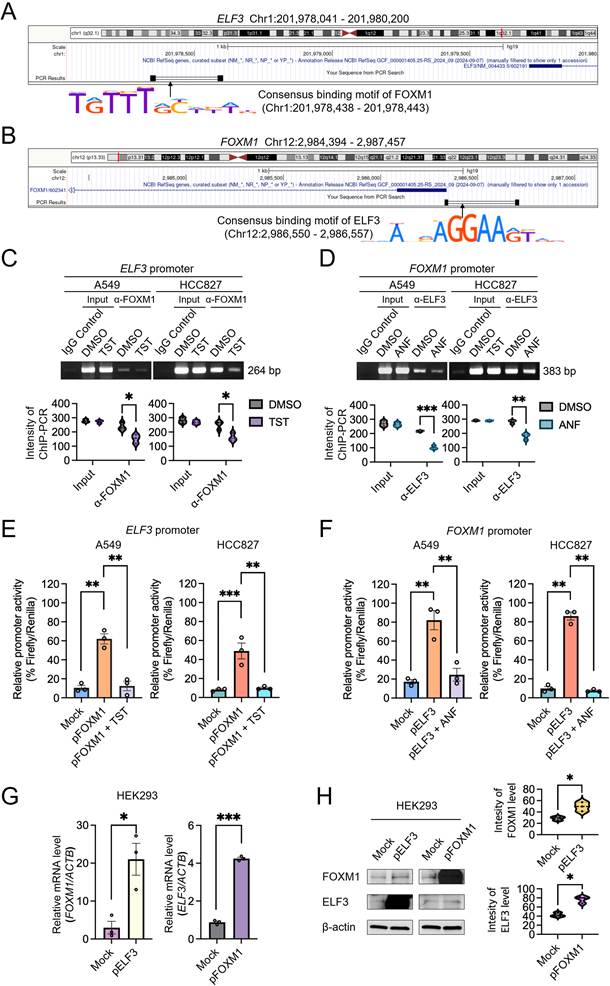
To elucidate the physical architecture of this reciprocal loop, we conducted chromatin immunoprecipitation-PCR (ChIP-PCR) assays. The analysis revealed binding of FOXM1 to the ELF3 promoter. Treating cells with the FOXM1 inhibitor TST reduced FOXM1 binding at this locus in both A549 and HCC827 cells (Figure 5C). A reciprocal pattern was observed for ELF3; its robust binding to the FOXM1 promoter was severely disrupted upon pharmacological intervention with ANF (Figure 5D).
We next performed dual-luciferase reporter assays to determine whether this binding translates into functional transactivation. Exogenous expression of FOXM1 markedly activated the ELF3 promoter, increasing activity from a baseline of 10.5% to 62.0% in A549 cells and from 8.3% to 49.1% in HCC827 cells. Treatment with TST reduced this transactivation to near-baseline levels (Figure 5E). Reciprocally, ELF3 overexpression increased FOXM1 promoter activity (from 17.2% to 82.1% in A549, and from 9.8% to 86.1% in HCC827), an effect that was abrogated by ANF treatment (Figure 5F).
To determine whether this reciprocal circuit is sufficient to drive mutual upregulation independently of cancer-specific context, we exogenously expressed these TFs in non-cancerous HEK293 cells. Exogenous expression of ELF3 alone was sufficient to increase FOXM1 mRNA from 2.99 to 21.03 (ACTB-normalized relative expression), corresponding to a ~7.0-fold increase over mock-transfected cells, while exogenous FOXM1 reciprocally amplified ELF3 mRNA from 0.88 to 4.25 (~4.8-fold over mock) (Figure 5G). This mutual amplification was also observed at the protein level (Figure 5H). Collectively, these data (Supplementary Figure S5A) demonstrate that the FOXM1-ELF3 axis is a direct reciprocal transcriptional circuit, providing a mechanistic foundation for our dual-targeted therapeutic strategy.
Disruption of the FOXM1-ELF3 transcriptional addiction significantly regresses tumors in vivo
To translate our molecular findings into a clinically relevant context, we evaluated the therapeutic efficacy of dismantling the FOXM1-ELF3 circuit in vivo using an A549 subcutaneous xenograft mouse model. Drug administration commenced only after tumors reached an exponential growth phase (100-150 mm3) [28-30]. In the initial 13-day cohort (Figure 6A, top), single-agent treatments (ANF or TST) merely delayed tumor progression, with aggressive regrowth emerging by day 11, consistent with adaptive resistance observed when only one node of the reciprocal circuit is targeted. Conversely, the synergistic dual inhibition of FOXM1 and ELF3 precipitated a continuous, marked regression in tumor volume, achieving 91.0% inhibition of tumor growth by day 13 (Figure 6A, bottom left). This combination regimen yielded a synergistic CDI of 0.761 in vivo.
Dual inhibition of FOXM1 and ELF3 significantly regresses tumors in vivo without overt systemic toxicity at the doses and duration tested. (A) In vivo experimental schedule for evaluating the antitumor effects of drug treatments and tumor growth kinetics in the various treatment groups (n = 5 mice per group). When tumor volumes reached 100-150 mm3, mice were administered either DMSO or the drugs every 48 h from day 1 to day 11. Mice were euthanized on day 13 for histopathological (H&E, IF) and biochemical analyses. Treatments included control (DMSO), ANF, TST, and dual inhibition (DI) (left). **P < 0.01. Body weight changes (right) indicate no significant weight loss among treatment groups, suggesting that the treatments were well tolerated. (B) In vivo experimental schedule for evaluating the long-term antitumor effects of combined ANF and TST treatment (n = 5 mice per group). Mice were administered either DMSO or the drugs every 48 h from day 1 to day 25 (left). ***P < 0.001. Mice were euthanized on day 27 for histopathological and biochemical analyses. Body weight changes (right) indicate no significant weight loss among treatment groups, suggesting that the treatments were well tolerated. (C, D) Histopathological analyses of major organs of the mice on day 13 (C) and day 27 (D). Scale bar, 100 μm. (E, F) Serum biochemical analyses of the mice on day 13 (E) and day 27 (F).
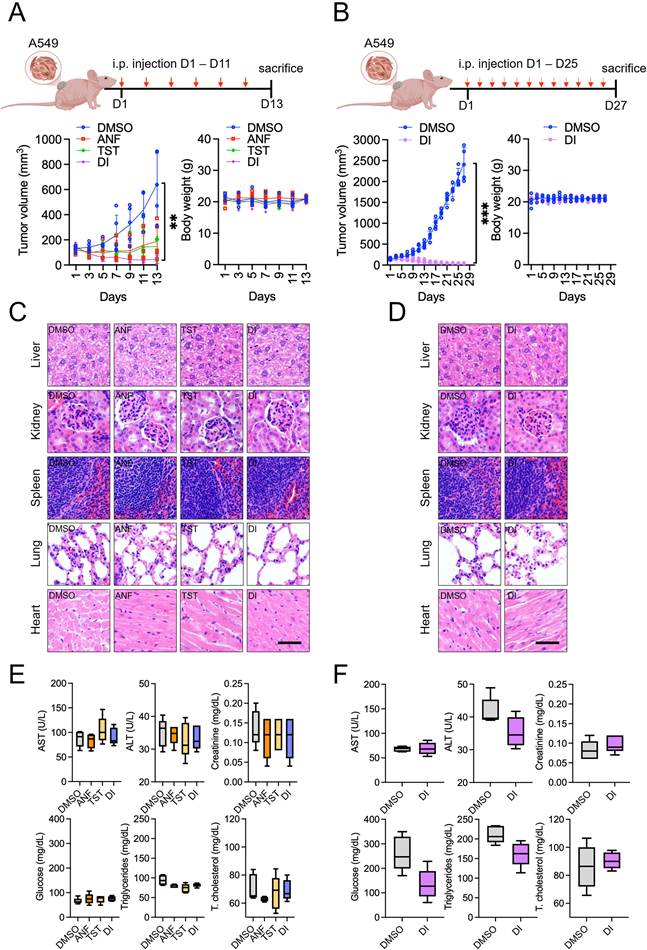
Motivated by these initial responses, we conducted an extended in vivo trial to determine if prolonged pharmacological disruption could achieve near-complete tumor regression (Figure 6B, top). While control tumors proliferated over the 27-day period, tumors in the dual inhibition cohort underwent near-complete regression by the end of the treatment cycle (Figure 6B, bottom left). This in vivo regression recapitulates the cellular response observed in vitro.
A hallmark of a viable therapeutic strategy is potent anti-tumor efficacy coupled with a favorable safety profile. Throughout both the 13-day and 27-day regimens, mice subjected to dual inhibition exhibited no significant body weight loss compared to controls, indicating good systemic tolerability (Figure 6A, B, bottom right). To assess potential toxicological effects, major organs (liver, kidney, spleen, lung, and heart) were harvested and subjected to histopathological (H&E) analysis. No structural abnormalities, necrotic lesions, or inflammatory infiltrates were detected in any of the treatment groups (Figure 6C, D). Furthermore, serum biochemical profiling revealed no significant deviations in liver and kidney function markers (AST, ALT, and creatinine), metabolic parameters (glucose, triglycerides, and total cholesterol), or hepatic protein indices (albumin, globulin, and total protein) between the control and dual-treated cohorts (Figure 6E, F). These findings indicate that pharmacological dismantling of the FOXM1-ELF3 circuit achieves a favorable therapeutic window. Taken together, these in vivo data provide proof-of-concept that synergistic pharmacological dismantling of the FOXM1-ELF3 transcriptional dependency drives regression of established tumors without overt systemic toxicity under the doses and treatment duration examined.
The FOXM1-ELF3 reciprocal circuit drives feedforward amplification of YAP1 expression
Having established the structural integrity of the FOXM1-ELF3 reciprocal dependency (Supplementary Figure S5A), we sought to identify a downstream mediator responsible for translating this circuitry into aggressive tumor growth and therapy resistance. We hypothesized that this TF loop orchestrates a feedforward amplification of YAP1, a notorious Hippo pathway effector. Bioinformatic promoter interrogation identified highly conserved dual binding sites for both FOXM1 and ELF3 tightly clustered within the YAP1 promoter region (Figure 7A).
The FOXM1-ELF3 reciprocal loop drives feedforward amplification of YAP1 expression. (A) Bioinformatic analysis identifying predicted FOXM1 (TGTTT) and ELF3 (AGGAA) binding motifs within the YAP1 promoter region. (B) Dual-luciferase promoter assays in A549 cells confirm synergistic activation of the YAP1 promoter by ELF3 and FOXM1 co-expression (2.56% → 93.70% Firefly/Renilla; 36.6-fold over mock). Pharmacological inhibition reversed these effects. (C) Promoter activity assays in HCC827 cells demonstrating similar synergistic activation of the YAP1 promoter upon ELF3 and FOXM1 co-expression (14.21% → 91.03%; 6.4-fold over mock), and subsequent suppression by inhibitor treatments. (D-E) ChIP-PCR for FOXM1 and ELF3 binding to the YAP1 promoter with individual and dual inhibition in A549 (D) and HCC827 (E) cells. (F) ICC staining in A549 cells illustrating reduced nuclear localization of YAP1 (upper) following treatment with ANF, TST, or dual inhibition (DI). Nuclei were stained with DAPI (blue). Scale bar, 50 μm. (G) ICC staining in HCC827 cells confirming decreased nuclear accumulation of YAP1 (upper) upon dual inhibition of FOXM1 and ELF3 with ANF and TST. DAPI (blue) indicates nuclei. Intensity per area of fluorescence was quantified in bar plots. Scale bar, 50 μm. (H) Dual luciferase assay for transactivation of YAP1-responsive 8×GTIIC-luciferase plasmids by siELF3, siFOXM1, siELF3+siFOXM1 and siYAP1 in A549 (left) and HCC827 (right) cells. Data are presented as normalized ratios (% Firefly/Renilla), mean ± SD (n = 3). (I) Dual luciferase assay for transactivation of YAP1-responsive 8×GTIIC-luciferase plasmids by ANF, TST, DI and verteporfin (YAP1 inhibitor) in A549 (left) and HCC827 (right) cells. Data are presented as normalized ratios (% Firefly/Renilla), mean ± SD (n = 3). *P < 0.05, **P < 0.01, and ***P < 0.001.
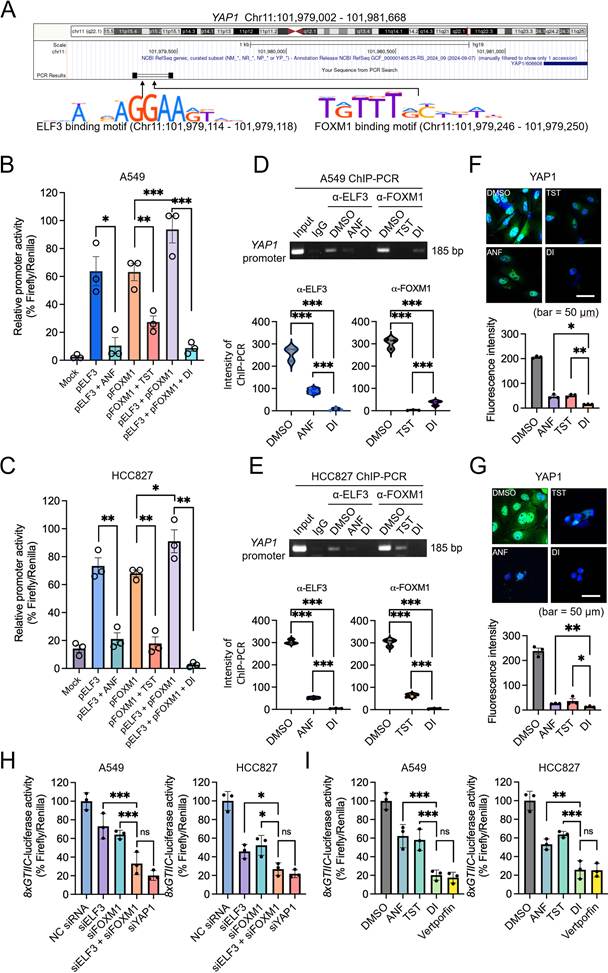
To experimentally determine whether the FOXM1-ELF3 axis is sufficient to drive this feedforward amplification, we exogenously expressed these TFs in HEK293 cells (Supplementary Figure S5B). Exogenous expression induced a substantial 9- to 10.6-fold increase in YAP1 mRNA (Supplementary Figure S5C) and a corresponding elevation in YAP1 protein levels (Supplementary Figure S5C). This accumulation was independent of LATS1/2-mediated proteasomal degradation, indicating that YAP1 upregulation is driven by transcriptional activation rather than impaired protein degradation (Supplementary Figure S5D). Promoter assays proved this feedforward effect: while individual TFs modestly increased YAP1 promoter activity, their co-expression produced a synergistic increase from 6.14% to 82.59% (% Firefly/Renilla; 13.5-fold over mock), and pharmacological blockade with TST and ANF reduced this activity back to baseline (Supplementary Figure S5E). Furthermore, 8×GTIIC-luciferase reporter assays confirmed that this transcriptional increase translates into YAP1/TAZ-TEAD transactivation (Supplementary Figure S5F) [31].
We next validated this feedforward amplification in the native context of NSCLC. In A549 cells, co-expression of FOXM1 and ELF3 synergistically increased YAP1 promoter activity from a baseline of 2.56% to 93.70% (% Firefly/Renilla), corresponding to a 36.6-fold increase over mock (Figure 7B); comparable synergistic transactivation was observed in HCC827 cells (from 14.21% to 91.03% Firefly/Renilla; 6.4-fold over mock) (Figure 7C). To examine the therapeutic vulnerability of this axis, we employed ChIP-PCR and immunocytochemistry. Dual pharmacological inhibition reduced FOXM1 and ELF3 binding at the YAP1 promoter (Figure 7D, E) and decreased the nuclear accumulation of YAP1 protein in both cell lines (Figure 7F, G).
To define the contribution of YAP1 to the phenotype, we combined rescue, loss-of-function, and epistasis approaches. Restoration of ELF3, FOXM1, or YAP1 expression in DI-treated cells significantly recovered cell viability in both A549 and HCC827 cells (Supplementary Figure S6A, S6B), and overexpression of YAP1 alone was sufficient to substantially rescue viability, indicating that YAP1 is a functionally important downstream mediator of the circuit. Consistent with this, at the level of YAP1/TAZ-TEAD reporter activity, dual inhibition and combined FOXM1/ELF3 knockdown reduced 8×GTIIC-luciferase activity to a similar extent as YAP1 knockdown or the YAP1 inhibitor verteporfin (Figure 7H, I), indicating that disruption of the circuit converges on YAP1/TEAD transcriptional output. However, YAP1 knockdown only partially reproduced the effect of circuit disruption: combined FOXM1/ELF3 knockdown reduced cell viability more strongly than YAP1 knockdown alone (Supplementary Figure S6C-S6D). Moreover, in an epistasis experiment, dual pharmacological inhibition did not further reduce viability in YAP1-depleted A549 or HCC827 cells (Supplementary Figure S6E-S6F), consistent with YAP1 acting as a principal, though not exclusive, downstream effector in parental cells. Collectively, these data indicate that pharmacological dismantling of the FOXM1-ELF3 reciprocal circuit exerts its anti-tumor activity largely by converging on YAP1-driven oncogenic signaling, while the stronger effect of combined FOXM1/ELF3 loss indicates the circuit also engages YAP1-independent outputs.
Because ANF is a known inhibitor of thioredoxin reductase, we asked whether the observed effects might arise indirectly from oxidative stress rather than from disruption of the FOXM1-ELF3 circuit. Under the same conditions used for the molecular assays, ANF did not increase intracellular ROS and did not lower the GSH/GSSG or NADPH/NADP+ ratios, whereas the positive control cisplatin induced clear oxidative stress in all cell lines (Supplementary Figure S7). These results argue against a prominent generalized oxidative-stress response as the primary explanation for the effects of ANF under the conditions tested.
Dismantling the FOXM1-ELF3 loop triggers downregulation of YAP1 expression in vivo and promotes cell death
To confirm that the tumor regression observed in our in vivo models results from dismantling this transcriptional axis, we performed molecular and histological profiling of harvested tumor tissues. Tumors harvested on day 13 were subjected to immunofluorescence staining. Consistent with our in vitro findings, tumors subjected to combined pharmacological disruption (ANF + TST) showed a marked reduction and nuclear exclusion of both FOXM1 and ELF3 proteins compared to the control or single-treatment groups (Figure 8A, B). Consequently, nuclear YAP1 level was markedly reduced (Figure 8C), indicating that the feedforward oncogenic signal was disrupted in vivo.
Dismantling the FOXM1-ELF3 loop triggers downregulation of YAP1 expression in vivo and promotes cell death. Immunofluorescence (IF) staining for ELF3 (A), FOXM1 (B), and YAP1 (C) in 4 groups of A549 xenografts. Scale bar 50 μm. Fluorescence intensities from three independent tumors from three different mice sections were plotted for each protein. (D) Hematoxylin and eosin staining of 4 groups of A549 xenografts. Scale bar 50 μm. (E) Terminal deoxynucleotidyl transferase dUTP nick-end labeling (TUNEL) staining of 4 groups of A549 xenografts for evaluating cellular death induced by dual inhibition. Scale bar 50 μm. Intensity of TUNEL-positive cells was plotted. *P < 0.05, **P < 0.01. Proposed mechanism of the reciprocal regulation of FOXM1 and ELF3 (F) and the dual inhibition (G) of FOXM1 and ELF3 and subsequent inhibition of YAP1 expression.
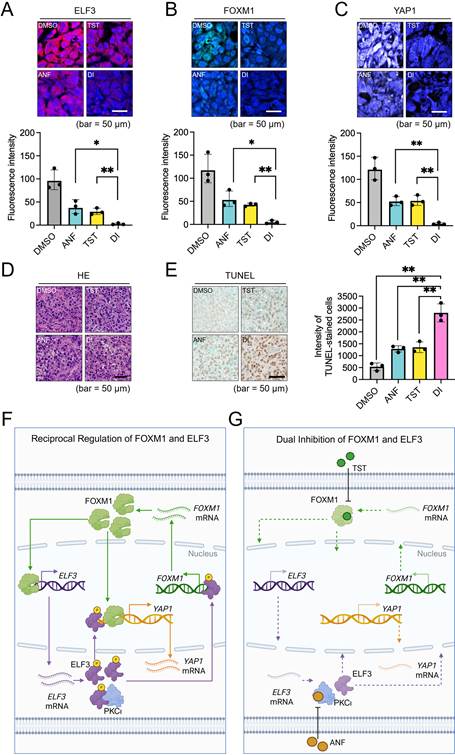
We next examined the histological fate of the tumors following disruption of this reciprocal circuit. H&E staining of the regressing tumors from the dual inhibition cohort revealed widespread architectural disruption. Unlike the intact, densely packed control tumors, the dual-treated tumors showed widespread cell death-like lesions in the tumor core, with nuclear shrinkage and structural disintegration (Figure 8D). To confirm that this reflected cell death rather than growth arrest, we performed TUNEL assays. The dual-treated tumors showed a marked increase in TUNEL-positive signal, ~5-fold higher than controls and significantly exceeding both single-agent treatment groups (Figure 8E).
Together, these in vitro and in vivo findings support a model of FOXM1-ELF3 reciprocal transcriptional addiction. In advanced and refractory NSCLC, these master TFs bind each other's promoters to form a mutually reinforcing survival loop, which drives feedforward amplification of YAP1 to support aggressive tumor growth and EGFR-TKI resistance (Figure 8F). By using pharmacological tools to simultaneously target both nodes of this circuit, the reciprocal loop undergoes synergistic collapse. This disruption reduces YAP1 signaling, resulting in extensive TUNEL-positive cell death and tumor regression (Figure 8G). Dismantling this transcriptional architecture therefore represents a promising therapeutic strategy for intractable malignancies, though potential applicability to other malignancies warrants further investigation.
Functional conservation of the FOXM1-ELF3 reciprocal circuit in 2nd- and 3rd-generation EGFR-TKI resistance models
Finally, extending our in vivo findings, we examined whether this vulnerability remains functionally conserved under second- or third-generation EGFR-TKI resistance. HCC827AR and HCC827OR cell lines were established from parental HCC827 cells by stepwise escalation of afatinib (10 nM to 1 μM over 4 weeks) and osimertinib (10 nM to 2 μM over 6 weeks), respectively. To confirm the resistant phenotype after drug withdrawal, IC50 values were determined after at least 24 hours of stabilization in drug-free medium, under which conditions HCC827AR and HCC827OR exhibited 18.2-fold and 4.4-fold higher IC50 values relative to parental HCC827 cells, respectively (Supplementary Figure S8). Reflecting the persistent nature of this vulnerability, the reciprocal transcriptional addiction driven by FOXM1 and ELF3—initially demonstrated in parental cells—was also observed in both HCC827AR and HCC827OR models. Consistent with findings in parental cells, both genetic silencing (Figure 9A) and individual pharmacological inhibition (Figure 9B) disrupted this reciprocal network at the mRNA level in both models and triggered nuclear eviction of these factors together with a reduction in YAP1 nuclear accumulation (Figure 9C, D and Supplementary Figure S9A-S9D). Because this survival dependency appeared to be maintained regardless of therapeutic history, we hypothesized that dual blockade might retain its efficacy in these models.
Functional conservation of the FOXM1-ELF3 reciprocal circuit in EGFR-TKI-resistant models. (A-D) RT-PCR (A, B) and immunocytochemistry (C, D) analyses showing reciprocal changes in FOXM1 and ELF3 following genetic (A, C) or pharmacological (B, D) perturbation in HCC827AR and HCC827OR cells. Scale bar, 50 μm. (E, F) 3D ZIP synergy landscapes (left) and relative cell viability at the indicated treatment concentrations (right), demonstrating synergistic interactions between ANF and TST in HCC827AR (E) and HCC827OR (F) cells. Data are presented as mean ± SD (n = 3). (G) RT-PCR analysis of FOXM1, ELF3, and YAP1 expression following 48 h of dual inhibition. (H) Immunofluorescence images showing reduced nuclear accumulation of YAP1 following dual inhibition in the resistant models. Nuclei were counterstained with DAPI. Scale bars, 50 μm. (I, J) Dual luciferase assay for transactivation of YAP1-responsive 8×GTIIC-luciferase plasmids by siELF3, siFOXM1, siELF3+siFOXM1 and siYAP1 (I), and by ANF, TST, DI and verteporfin (YAP1 inhibitor) (J) in HCC827AR (left) and HCC827OR (right) cells. Data are presented as normalized ratios (% Firefly/Renilla), mean ± SD (n = 3). *P < 0.05, **P < 0.01, ***P < 0.001.
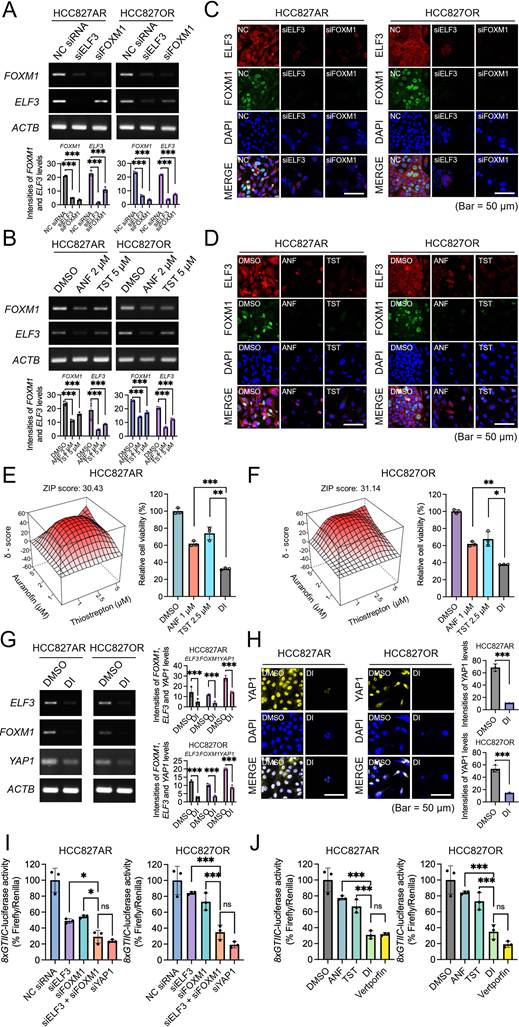
Combined pharmacological intervention with ANF and TST recapitulated the synergistic activity observed in the parental cells, yielding ZIP scores exceeding 30.43 and 31.14 in the HCC827AR and HCC827OR models, respectively (Figure 9E, F and Supplementary Figure S9E-S9F, Table S12). Cell viabilities of HCC827AR and HCC827OR were reduced to 32.3% and 37.8%, respectively (Figure 9E, F). HCC827AR showed synergy (CDI = 0.706) and HCC827OR also showed synergistic inhibition (CDI = 0.899) below the threshold of 1.0. The combined treatment (DI) markedly reduced the expression of FOXM1, ELF3, and YAP1 at the mRNA level, as confirmed by RT-PCR (Figure 9G), and reduced nuclear YAP1 in the resistant models, recapitulating the response of parental cells (Figure 9H). Consistent with the parental cells, combined FOXM1/ELF3 knockdown and dual inhibition reduced YAP1/TAZ-TEAD reporter activity to a similar extent as YAP1 knockdown or verteporfin in both resistant models (Figure 9I, J), and YAP1 knockdown again only partially reproduced the effect of circuit disruption (Supplementary Figure S10A-S10B). Notably, in the resistant models, dual inhibition further reduced viability even in YAP1-depleted cells (Supplementary Figure S10C-S10D), indicating a more prominent YAP1-independent contribution than in parental cells; co-expression of FOXM1 and ELF3 also synergistically activated the YAP1 promoter in both resistant lines, an effect reversed by inhibitor treatment (Supplementary Figure S10E-S10F). Similar to HCC827 cells, ANF did not increase intracellular ROS and did not lower the GSH/GSSG or NADPH/NADP+ ratios, whereas the positive control cisplatin induced clear oxidative stress in both HCC827AR and HCC827OR cell lines (Supplementary Figure S11). Together, these results indicate that this circuit-directed strategy retains activity against advanced, multi-generational TKI resistance by targeting a maintained transcriptional dependency that engages both YAP1-dependent and YAP1-independent outputs.
Discussion
The fundamental limitation of current targeted therapies lies in the inevitable emergence of acquired resistance. While mutation-specific targeted therapies (e.g., EGFR or KRAS G12C inhibitors) and immune checkpoint blockades have improved clinical outcomes in NSCLC, their efficacy is constrained by tumor heterogeneity, limited patient eligibility, and the emergence of adaptive resistance across successive generations of targeted agents [4-6,32,33]. As tumor cells evade single-node interventions, they frequently rewire their global regulatory networks to sustain survival. There is therefore an unmet clinical need for a conceptual shift from conventional kinase inhibition toward dismantling the core transcriptional architectures that orchestrate these adaptive survival mechanisms.
In this study, we addressed this need by identifying and targeting a previously unrecognized mechanistic framework in cancer biology: the FOXM1-ELF3 reciprocal transcriptional addiction. Unlike simple linear signaling pathways, these two master transcription factors establish a mutually reinforcing reciprocal feedback loop through direct promoter binding. Crucially, this reciprocal circuit does not merely sustain the TFs themselves but drives feedforward amplification of the Hippo pathway effector YAP1, a driver of multi-drug resistance [34,35]. By defining this FOXM1-ELF3-YAP1 axis, our study elucidates how refractory tumors bypass single-agent therapies by exploiting a self-reinforcing transcriptional dependency as a core survival mechanism.
As an initial in vivo proof-of-concept, we tested the dual pharmacological blockade in an A549 NSCLC xenograft mouse model (Figure 6A, B). A549 cells are KRAS G12S-mutant and EGFR wild-type and therefore do not model acquired EGFR-TKI resistance; accordingly, this experiment was designed not to validate efficacy in the acquired resistance setting, but to establish whether dual disruption of the FOXM1-ELF3 circuit produces antitumor activity in an NSCLC context where this circuit is overactivated. While targeting single TFs often triggers adaptive compensation (as evidenced by tumor regrowth in our single-treatment cohorts), simultaneously disrupting both nodes of a reciprocal circuit leaves the tumor with fewer alternative survival routes, achieving near-complete tumor regression without overt systemic toxicity at the doses and duration tested (Figure 6C-F), and culminating in extensive TUNEL-positive cell death (Figure 8E).
Because this reciprocal transcriptional dependency is an intrinsic and constitutively maintained vulnerability, this circuit-directed strategy addresses the boundaries of mutation-restricted therapies. We demonstrated that the FOXM1-ELF3 transcriptional dependency remained conserved and therapeutically actionable in independently established resistance models against both 2nd-generation (afatinib; HCC827AR) and 3rd-generation (osimertinib; HCC827OR) EGFR-TKI (Figure 9), yielding ZIP synergy scores exceeding 30.0 in both models (Supplementary Figure S9E, S9F). This indicates that the FOXM1-ELF3 reciprocal circuit operates across the two independently generated EGFR-TKI-resistant models examined here. Intercepting this network therefore offers a strategy capable of addressing heterogeneous resistance mechanisms.
Although comprehensive genomic profiling of HCC827AR and HCC827OR was beyond the scope of the current study, the molecular basis of acquired EGFR-TKI resistance in stepwise-escalation HCC827 derivatives has been extensively characterized in the literature. Afatinib-resistant HCC827 derivatives frequently harbor secondary EGFR mutations (e.g., T790M) or exhibit EMT-associated transcriptional reprogramming [36,37], whereas osimertinib-resistant derivatives commonly develop EGFR C797S mutations, MET amplification, or bypass signaling through YAP1 activation [9]. Critically, the overexpression and functional dependency on FOXM1, ELF3, and YAP1 observed in both HCC827AR and HCC827OR suggests that the FOXM1-ELF3 reciprocal circuit represents a convergent transcriptional adaptation to EGFR-TKI selective pressure that operates downstream across the two independently generated EGFR-TKI-resistant models examined here.
From a translational and toxicological standpoint, a major hurdle in targeting master TFs has been the risk of systemic toxicity. However, our in vivo proof-of-concept addresses this concern. Pharmacological dismantling of the FOXM1-ELF3 circuit achieved tumor regression without overt systemic toxicity under the doses and duration examined, as evidenced by the absence of significant body weight loss, histopathological organ damage, or serum biochemical abnormalities (Figure 6C-F).
An important methodological consideration concerns the pharmacological selectivity of the tool compounds employed. Auranofin (ANF) is a well-characterized thioredoxin reductase (TrxR) inhibitor, while thiostrepton (TST) exerts broad cytostatic effects including proteasomal stress and translational inhibition, in addition to its documented suppression of FOXM1 DNA binding. One could therefore raise the possibility that the observed synergistic reduction in relative cell viability reflects combined non-specific cellular stress rather than selective disruption of the FOXM1-ELF3 transcriptional circuit. However, several convergent, mechanistically orthogonal lines of evidence support the circuit-directed interpretation. First, siRNA-mediated genetic silencing of either FOXM1 or ELF3 individually reproduced the core pharmacological phenotypes—including comparable reductions in cell viability and reciprocal suppression of the partner factor at both the mRNA and protein levels (Figure 3A, C, D)—in the absence of oxidative or proteotoxic stress. Second, exogenous restoration of FOXM1 or ELF3 expression substantially rescued cell viability in cells subjected to pharmacological inhibition (Figure 3H), providing direct evidence that circuit suppression, not non-specific toxicity, drives the observed anti-proliferative effects. Third, dual pharmacological inhibition reduced binding of each TF at its reciprocal promoter, as shown by ChIP-PCR, with a corresponding reduction in transcriptional output confirmed by luciferase reporter assays (Figure 5C-F). Fourth, under the conditions used here, ANF did not produce a detectable generalized oxidative-stress response under the conditions tested, as ROS levels and the GSH/GSSG and NADPH/NADP+ ratios were unchanged relative to control, whereas cisplatin produced clear oxidative stress (Supplementary Figure S7 and Figure S11); this argues against oxidative stress as the primary basis for the observed effects. Taken together, these data indicate that, while ANF and TST are not exclusively circuit-directed agents, their efficacy in this context is substantively mediated through suppression of the FOXM1-ELF3 transcriptional circuit. Future studies employing structurally distinct pharmacological agents, CRISPR-based genetic perturbations, or next-generation targeted protein degraders will provide further mechanistic refinement of this strategy.
Despite these promising translational implications, our study has certain limitations that warrant further investigation. First, while we demonstrated the efficacy of this strategy across independently established 2nd- and 3rd-generation EGFR-TKI-resistant NSCLC models, and provided preliminary evidence of FOXM1-ELF3 concurrent overexpression in colorectal and breast cancer cell lines, further validation across diverse cancer types is necessary to fully establish its broader utility. Second, our ChIP-seq analysis was performed as a discovery-level screen without biological replicates or spike-in normalization and was therefore used to identify candidate binding regions rather than to quantify genome-wide occupancy changes; the quantitative conclusions of this study rest on replicate-based ChIP-PCR at defined promoters. Third, although our preclinical models utilized TST and ANF as effective pharmacological tools, future clinical development may benefit from next-generation targeted protein degraders (PROTACs) or advanced nano-delivery systems to further optimize the pharmacokinetics and target specificity of TF-targeting agents [38]. Finally, while our immunofluorescence data revealed a prominent cytosolic ELF3 pool in resistant NSCLC cells, the present study focused on ELF3's nuclear transcriptional function within the FOXM1-ELF3 reciprocal circuit. It is noteworthy, however, that ELF3 has been shown to exert oncogenic functions via a non-transcriptional, cytoplasmic mechanism mediated by its unique serine/aspartic acid-rich (SAR) subdomain, independently of its ETS DNA-binding activity [39,40]. Whether this cytoplasm-resident ELF3 fraction contributes to EGFR-TKI resistance independently of its nuclear transcriptional role remains an important and open question for future investigation. Nevertheless, our current findings using clinically characterized compounds, including ANF—an FDA-approved agent for rheumatoid arthritis— provide a rationale for further preclinical evaluation of the safety and translational potential of this dual-blockade strategy.
Together, these results position the FOXM1-ELF3 reciprocal transcriptional circuit as a constitutive, drug-targetable vulnerability in advanced malignancies. By promoting a disruption of the tumor-associated transcriptional survival network, this circuit-level intervention represents a shift from mutation-specific kinase inhibition toward the systemic dismantling of core transcriptional architectures and establishes a promising therapeutic strategy for treatment-refractory NSCLC.
In summary, we demonstrate that FOXM1 and ELF3 bind each other's promoter regions to establish a self-reinforcing reciprocal transcriptional circuit that drives feedforward amplification of YAP1, fueling aggressive tumor growth and therapeutic resistance. Simultaneous pharmacological dismantling of both nodes of this circuit using TST and ANF synergistically suppressed YAP1-driven oncogenic signaling, achieving near-complete regression of established tumors in vivo without overt systemic toxicity at the doses and duration tested, as confirmed by histopathological and serum biochemical analyses. Rescue and loss-of-function experiments established YAP1 as a principal downstream mediator of this circuit, whose restoration was sufficient to recover cell viability under dual inhibition, although YAP1 depletion only partially reproduced circuit disruption, indicating additional YAP1-independent outputs. Critically, this circuit-directed synergistic activity was conserved across independently established resistance models against both 2nd-generation (afatinib) and 3rd-generation (osimertinib) EGFR-TKIs, underscoring that the FOXM1-ELF3 transcriptional circuit represents a survival dependency maintained across the two independently generated EGFR-TKI-resistant models examined here. Collectively, these findings establish the pharmacological dismantling of the FOXM1-ELF3 reciprocal transcriptional circuit as a promising therapeutic strategy for treatment-refractory NSCLC that warrants broader validation in additional tumor models.
Abbreviations
ANF: auranofin; AST: aspartate aminotransferase; ALT: alanine aminotransferase; BRCA: breast cancer; ChIP: chromatin immunoprecipitation; CDI: coefficient of drug interaction; CRC: colorectal cancer; DAPI: 4′,6-diamidino-2-phenylindole; DI: dual inhibition; DMSO: dimethyl sulfoxide; EGFR: epidermal growth factor receptor; ELF3: E74-like ETS transcription factor 3; FBS: fetal bovine serum; FOXM1: forkhead box M1; H&E: hematoxylin and eosin; HEK: human embryonic kidney; HOCOMOCO: HOmo sapiens COmprehensive MOdel COllection; ICC: immunocytochemistry; ICI: immune checkpoint inhibitor; IF: immunofluorescence; IACUC: Institutional Animal Care and Use Committee; KRAS: Kirsten rat sarcoma viral proto-oncogene; LATS: large tumor suppressor kinase; LUAD: lung adenocarcinoma; NC: negative control; NGS: next-generation sequencing; NSCLC: non-small cell lung cancer; nTPM: normalized transcripts per million; PKCι: protein kinase C iota; RT-PCR: reverse transcription polymerase chain reaction; siRNA: small interfering RNA; TEAD: transcriptional enhancer associate domain; TCGA: The Cancer Genome Atlas; TF: transcription factor; TKI: tyrosine kinase inhibitor; TST: thiostrepton; TUNEL: terminal deoxynucleotidyl transferase dUTP nick-end labeling; UCSC: University of California Santa Cruz; YAP1: Yes-associated protein 1; ZIP: zero interaction potency.
Supplementary Material
Supplementary figures and tables.

Acknowledgements
This research was funded by grants from National Research Foundation of Korea (2022R1A2C100722813), and National Cancer Center of Korea (24H1250 and 2410830).
Author contributions
Sung-ho Goh: Conceptualization, Supervision, Project Administration, Funding Acquisition, Data curation, Writing-review and editing. Yongdoo Choi: Supervision, Project Administration, Funding Acquisition, Data curation, Writing-review and editing. Jungho Kim: Writing-review and editing. Young Eun Choi: Methodology, Investigation, Visualization, Formal analysis, Writing-original draft. Jeon-soo Lee: Methodology, Investigation, Visualization, Formal analysis, Data curation, Writing-original draft.
Data availability
The ChIP-seq for control and TST/ANF-treated A549 cells raw data generated in this study have been deposited in the European Nucleotide Archive (ENA) under accession number PRJEB101315.
Competing Interests
The authors have declared that no competing interest exists.
References
1. Mosele F, Remon J, Mateo J, Westphalen CB, Barlesi F, Lolkema MP. et al. Recommendations for the use of next-generation sequencing (NGS) for patients with metastatic cancers: a report from the ESMO Precision Medicine Working Group. Ann Oncol. 2020;31:1491-505
2. Skoulidis F, Li BT, Dy GK, Price TJ, Falchook GS, Wolf J. et al. Sotorasib for Lung Cancers with KRAS p.G12C Mutation. N Engl J Med. 2021;384:2371-81
3. Fu K, Xie F, Wang F, Fu L. Therapeutic strategies for EGFR-mutated non-small cell lung cancer patients with osimertinib resistance. J Hematol Oncol. 2022;15:173
4. Awad MM, Liu S, Rybkin II, Arbour KC, Dilly J, Zhu VW. et al. Acquired Resistance to KRASG12C Inhibition in Cancer. N Engl J Med. 2021;384:2382-93
5. Darnell JE. Transcription factors as targets for cancer therapy. Nat Rev Cancer. 2002;2:740-9
6. Bradner JE, Hnisz D, Young RA. Transcriptional Addiction in Cancer. Cell. 2017;168:629-43
7. Vishnoi K, Viswakarma N, Rana A, Rana B. Transcription Factors in Cancer Development and Therapy. Cancers. 2020;12:2296
8. Wang IC, Ustiyan V, Zhang Y, Cai Y, Kalin TV, Kalinichenko VV. Foxm1 transcription factor is required for the initiation of lung tumorigenesis by oncogenic Kras(G12D). Oncogene. 2014;33:5391-6
9. Nilsson MB, Sun H, Robichaux J, Pfeifer M, McDermott U, Travers J. et al. A YAP/FOXM1 axis mediates EMT-associated EGFR inhibitor resistance and increased expression of spindle assembly checkpoint components. Sci Transl Med. 2020;12:eaaz4589
10. Tian M, Li J, Wu H, Wu Y. FOXM1 promotes the progression of non-small cell lung cancer by inhibiting miR-509-5p expression via binding to the miR-509-5p promoter region. Heliyon. 2024;10:e27147
11. Xiao H, Jiang Z, Fu X, Kuang Y, Lin S, Cai Y. et al. High expression of forkhead box M1 (FOXM1) is a poor prognostic biomarker in lung adenocarcinoma. Transl Cancer Res. 2020;9:6331-43
12. Ali SA, Justilien V, Jamieson L, Murray NR, Fields AP. Protein Kinase Cι Drives a NOTCH3-dependent Stem-like Phenotype in Mutant KRAS Lung Adenocarcinoma. Cancer Cell. 2016;29:367-78
13. Yuan Z, Han X, Xiao M, Zhu T, Xu Y, Tang Q. et al. Overexpression of ELF3 in the PTEN-deficient lung epithelium promotes lung cancer development by inhibiting ferroptosis. Cell Death Dis. 2024;15:897
14. Bray F, Laversanne M, Sung H, Ferlay J, Siegel RL, Soerjomataram I. et al. Global cancer statistics 2022: GLOBOCAN estimates of incidence and mortality worldwide for 36 cancers in 185 countries. CA Cancer J Clin. 2024;74:229-63
15. Luo G, Zhang Y, Rumgay H, Morgan E, Langselius O, Vignat J. et al. Estimated worldwide variation and trends in incidence of lung cancer by histological subtype in 2022 and over time: a population-based study. Lancet Respir Med. 2025;13:348-63
16. Reck M, Rodríguez-Abreu D, Robinson AG, Hui R, Csőszi T, Fülöp A. et al. Pembrolizumab versus Chemotherapy for PD-L1-Positive Non-Small-Cell Lung Cancer. N Engl J Med. 2016;375:1823-33
17. Gandhi L, Rodríguez-Abreu D, Gadgeel S, Esteban E, Felip E, De Angelis F. et al. Pembrolizumab plus Chemotherapy in Metastatic Non-Small-Cell Lung Cancer. N Engl J Med. 2018;378:2078-92
18. Huang M, Lou Y, Pellissier J, Burke T, Liu FX, Xu R. et al. Cost Effectiveness of Pembrolizumab vs. Standard-of-Care Chemotherapy as First-Line Treatment for Metastatic NSCLC that Expresses High Levels of PD-L1 in the United States. Pharmacoeconomics. 2017;35:831-44
19. Madhi H, Lee JS, Choi YE, Li Y, Kim MH, Choi Y. et al. FOXM1 Inhibition Enhances the Therapeutic Outcome of Lung Cancer Immunotherapy by Modulating PD-L1 Expression and Cell Proliferation. Adv Sci. 2022;9:e2202702
20. Lee JS, Choi YE, Kim S, Han JY, Goh SH. ELF3 Is a Target That Promotes Therapeutic Efficiency in EGFR Tyrosine Kinase Inhibitor-Resistant Non-Small Cell Lung Cancer Cells via Inhibiting PKCι. Int J Mol Sci. 2021;22:12287
21. Gao J, Aksoy BA, Dogrusoz U, Dresdner G, Gross B, Sumer SO. et al. Integrative analysis of complex cancer genomics and clinical profiles using the cBioPortal. Sci Signal. 2013;6:pl1
22. Uhlen M, Fagerberg L, Hallstrom BM, Lindskog C, Oksvold P, Mardinoglu A. et al. Proteomics. Tissue-based map of the human proteome. Science. 2015;347:1260419
23. Reddy J, Fonseca MAS, Corona RI, Nameki R, Segato Dezem F, Klein IA. et al. Predicting master transcription factors from pan-cancer expression data. Sci Adv. 2021;7:eabf6123
24. Ianevski A, Giri AK, Aittokallio T. SynergyFinder 2.0: visual analytics of multi-drug combination synergies. Nucleic Acids Res. 2020;48:W488-93
25. Xu SP, Sun GP, Shen YX, Peng WR, Wang H, Wei W. Synergistic effect of combining paeonol and cisplatin on apoptotic induction of human hepatoma cell lines. Acta Pharmacol Sin. 2007;28:869-78
26. Vorontsov IE, Eliseeva IA, Zinkevich A, Nikonov M, Abramov S, Boytsov A. et al. HOCOMOCO in 2024: a rebuild of the curated collection of binding models for human and mouse transcription factors. Nucleic Acids Res. 2024;52:D154-63
27. Raney BJ, Barber GP, Benet-Pages A, Casper J, Clawson H, Cline MS. et al. The UCSC Genome Browser database: 2024 update. Nucleic Acids Res. 2024;52:D1082-88
28. Sengupta A, Rahman M, Mateo-Lozano S, Tirado OM, Notario V. The dual inhibitory effect of thiostrepton on FoxM1 and EWS/FLI1 provides a novel therapeutic option for Ewing's sarcoma. Int J Oncol. 2013;43:803-12
29. Li H, Hu J, Wu S, Wang L, Cao X, Zhang X. et al. Auranofin-mediated inhibition of PI3K/AKT/mTOR axis and anticancer activity in non-small cell lung cancer cells. Oncotarget. 2016;7:3548-58
30. Shin M, Choi YE, Yan L, Goh SH, Choi Y. FOXM1 inhibitor-loaded nanoliposomes for enhanced immunotherapy against cancer. Chem Eng J. 2023;454:140400
31. Dupont S, Morsut L, Aragona M, Enzo E, Giulitti S, Cordenonsi M. et al. Role of YAP/TAZ in mechanotransduction. Nature. 2011;474:179-83
32. Cozma A, Sporis ND, Lazar AL, Buruiana A, Ganea AM, Malinescu TV. et al. Cardiac Toxicity Associated with Immune Checkpoint Inhibitors: A Systematic Review. Int J Mol Sci. 2022;23:10948
33. Nguyen AT, Berry GJ, Witteles RM, Le DT, Wu SM, Fisher GA. et al. Late-Onset Immunotherapy-Induced Myocarditis 2 Years After Checkpoint Inhibitor Initiation. JACC CardioOncol. 2022;4:727-30
34. Zanconato F, Cordenonsi M, Piccolo S. YAP and TAZ: a signaling hub of the tumour microenvironment. Nat Rev Cancer. 2019;19:454-64
35. Karvonen H, Barker H, Kaleva L, Niininen W, Ungureanu D. Molecular mechanisms associated with ROR1-mediated drug resistance: crosstalk with Hippo-YAP/TAZ and BMI-1 pathways. Cells. 2019;8:812
36. Sequist LV, Waltman BA, Dias-Santagata D, Digumarthy S, Turke AB, Fidias P. et al. Genotypic and histological evolution of lung cancers acquiring resistance to EGFR inhibitors. Sci Transl Med. 2011;3:75ra26
37. Takezawa K, Pirazzoli V, Arcila ME, Nebhan CA, Song X, de Stanchina E. et al. HER2 amplification: a potential mechanism of acquired resistance to EGFR inhibition in EGFR-mutant lung cancers that lack the second-site EGFRT790M mutation. Cancer Discov. 2012;2:922-33
38. Gomerdinger V, Nabar N, Hammond PT. Advancing engineering design strategies for targeted cancer nanomedicine. Nat Rev Cancer. 2025;25:657-83
39. Prescott JD, Koto KS, Singh M, Gutierrez-Hartmann A. The ETS transcription factor ESE-1 transforms MCF-12A human mammary epithelial cells via a novel cytoplasmic mechanism. Mol Cell Biol. 2004;24:5548-64
40. Prescott JD, Poczobutt JM, Tentler JJ, Walker DM, Gutierrez-Hartmann A. Mapping of ESE-1 subdomains required to initiate mammary epithelial cell transformation via a cytoplasmic mechanism. Mol Cancer. 2011;10:103
Author contact
Corresponding authors: ydchoire.kr (Y.Choi), andreare.kr (S.H. Goh).