Impact Factor ISSN: 1449-2288




Int J Biol Sci 2026; 23(1):160-181. doi:10.7150/ijbs.130088 This issue Cite
Research Paper
Single-cell RNA-seq Combined with Spatial Transcriptomics Reveals Intrinsic Drug Resistance Mechanisms Associated with SENP6-Regulated AR SUMOylation in Prostate Cancer
Xin'an Wang1*, Chang Lu1*, Hanchu Ye1*, Chengdang Xu1, Wei Wu1, Yicong Yao1, Wei Jiang1, Qiang Wu1  , Denglong Wu1 , Licheng Wang1
Department of urology, Tongji Hospital, School of Medicine, Tongji University, 389 Xincun Road, Putuo district, Shanghai 200065, China
*These authors contributed equally to this work
Received 2025-12-17; Accepted 2026-9-24; Published 2027-1-1
Abstract
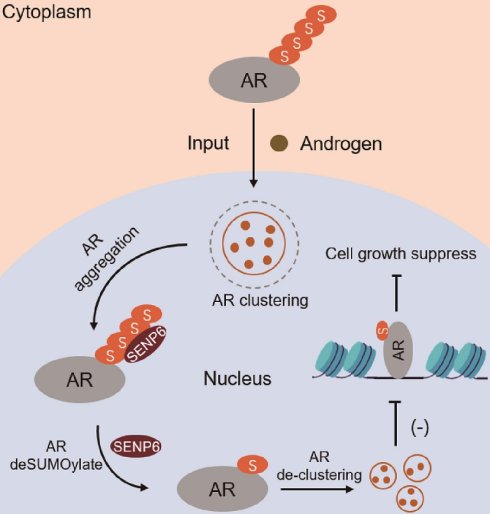
Prostate cancer (PCa) frequently progresses to metastatic castration-resistant prostate cancer (mCRPC) following androgen deprivation therapy (ADT), yet the cellular and molecular basis of treatment persistence remains incompletely understood. Here, we integrated single-cell RNA sequencing from 94 PCa samples spanning localized PCa (LPC), metastatic hormone-sensitive PCa, and mCRPC with spatial transcriptomics and functional experiments. ARPC3, an AR-positive epithelial state detectable in LPC, became markedly enriched in mCRPC while maintaining high AR-associated signaling, suggesting preferential retention or selection during disease progression and therapeutic pressure. Rare NEPC-associated transcriptional states were also detected in LPC, although immunohistochemistry did not confirm bona fide NEPC. Spatial analysis revealed a close association between ARPC3 cells and cancer-associated fibroblasts, consistent with a potentially protective stromal niche. SUMOylation-associated programs were enriched in advanced epithelial states. Mechanistically, SENP6 interacted with AR and regulated AR SUMOylation in a deSUMOylase activity-dependent manner. SENP6 depletion increased AR SUMOylation, AR transcriptional activity, and ADT resistance, whereas SENP6 overexpression suppressed AR signaling and tumor growth. These findings identify the SENP6-regulated AR SUMOylation axis as a potential therapeutic vulnerability in advanced PCa.
Keywords: Prostate cancer, single-cell RNA sequencing, spatial transcriptomics, drug-resistance, tumor microenvironment, SUMOylation
Introduction
Prostate cancer (PCa) is one of the most commonly diagnosed malignancies in men and remains a major cause of cancer-related morbidity and mortality worldwide[1, 2]. Androgen receptor (AR) signaling is a central driver of prostate cancer development and progression, making androgen deprivation therapy (ADT) and AR-pathway inhibition fundamental components of treatment for advanced disease[1, 3]. Although these therapies can initially achieve substantial tumor control, advanced prostate cancer frequently progresses to metastatic castration-resistant prostate cancer (mCRPC), in which tumor growth persists despite suppression of androgen signaling[1, 3]. The biological mechanisms underlying this transition are heterogeneous and involve both tumor-cell-intrinsic alterations and remodeling of the surrounding tumor microenvironment[4-6]. Understanding how different cellular states persist, adapt, or become enriched during disease progression is therefore important for identifying therapeutic vulnerabilities in advanced PCa.
Intratumoral heterogeneity and lineage plasticity are increasingly recognized as important features of prostate cancer progression and treatment response[5, 6]. In particular, neuroendocrine prostate cancer (NEPC) represents an aggressive disease state characterized by reduced dependence on canonical AR signaling and is frequently observed following prolonged AR-pathway suppression[7,8]. Therapy-induced lineage plasticity is considered an important route to NEPC development; however, neuroendocrine-associated or castration-resistant-like transcriptional states have also been reported in a small subset of treatment-naïve primary prostate cancers[7-12]. Large-scale transcriptomic analyses have identified a small fraction of treatment-naïve primary tumors with molecular features resembling small-cell/neuroendocrine prostate cancer[12], while single-cell studies have revealed substantial epithelial heterogeneity in localized prostate cancer, including rare neuroendocrine-associated cellular states[10]. Moreover, pre-existing CRPC-like and neuroendocrine-like populations in hormone-naïve primary tumors have been associated with subsequent disease progression and resistance to hormonal therapy[11]. These observations raise the possibility that treatment resistance may involve both pre-existing cellular heterogeneity and treatment-induced adaptation. However, the extent to which individual epithelial states persist, expand, or undergo reprogramming during progression from localized disease to mCRPC remains incompletely resolved.
Therapeutic response is also shaped by the tumor microenvironment. Immune cells, macrophages, and cancer-associated fibroblasts (CAFs) undergo extensive phenotypic remodeling during tumor progression and can influence cancer-cell behavior through cytokine signaling, extracellular-matrix remodeling, metabolic support, and immune regulation[4,13,14]. CAFs are particularly heterogeneous, and distinct fibroblast states can occupy different spatial regions and exert context-dependent effects on tumor behavior[13,14]. However, conventional bulk transcriptomic approaches do not retain information about the spatial organization of tumor and stromal populations. Integration of single-cell RNA sequencing (scRNA-seq) with spatial transcriptomics therefore provides a framework for simultaneously resolving cellular identity and tissue organization and may reveal microenvironmental relationships associated with tumor persistence in advanced prostate cancer.
In addition to transcriptional and microenvironmental regulation, post-translational modifications provide another layer of control over AR activity. SUMOylation is a reversible post-translational modification that regulates protein localization, stability, molecular interactions, and transcriptional activity and has been implicated in prostate cancer biology and AR regulation[15]. The balance between SUMO conjugation and deSUMOylation is dynamically controlled by SUMO-specific proteases, including members of the sentrin-specific protease (SENP) family[16]. SENP6 preferentially regulates poly-SUMO2/3-conjugated substrates and has important functions in maintaining SUMO homeostasis [16,17]. Altered SENP6 activity has also been implicated in several malignancies[18, 19]. Nevertheless, the role of SENP6 in prostate cancer, its relationship with AR signaling, and whether SENP6-dependent deSUMOylation influences the response to androgen deprivation remain largely unknown.
In this study, we integrated scRNA-seq datasets from 94 patients spanning localized prostate cancer (LPC), metastatic hormone-sensitive prostate cancer (mHSPC), and mCRPC to characterize epithelial, immune, and stromal heterogeneity across prostate cancer progression. Spatial transcriptomic analysis was further used to define the tissue organization of treatment-associated tumor and stromal populations. Based on the identification of stage-associated alterations in SUMOylation-related programs, we subsequently investigated the functional relationship between SENP6, AR SUMOylation, AR transcriptional activity, and cellular response to androgen deprivation using molecular, cellular, and in vivo experiments. This integrated framework allowed us to distinguish stage-associated cellular features from experimentally supported molecular mechanisms and to identify potential vulnerabilities associated with progression to advanced prostate cancer.
Materials and methods
Data Acquisition and Preprocessing
Single-cell RNA sequencing (scRNA-seq) data from prostate cancer samples representing three clinical states were obtained from the Gene Expression Omnibus (GEO, https://www.ncbi.nlm.nih.gov/geo/) database under the accession numbers GSE274229[20], GSE137829[21], GSE141445[22], GSE181294[23], and GSE210358[24] (Table S1). The datasets comprised a total of 30 local prostate cancer samples (ADT-naïve), 32 metastatic hormone-sensitive prostate cancer (mHSPC) samples following ADT therapy, and 32 metastatic castration-resistant prostate cancer (mCRPC) samples following ADT therapy. Furthermore, spatial transcriptomics data for prostate cancer were downloaded from the GEO dataset GSE278936[25]. Additionally, bulk transcriptome datasets and corresponding clinical information for prostate cancer were sourced from The Cancer Genome Atlas (TCGA), the Chinese Prostate Cancer Genome and Epigenome Atlas (CPGEA), and the GEO datasets GSE116918[26] and GSE3325[27]. All sequencing data utilized in this study were derived from publicly available sources. We further validated the prognostic relevance of SENP6 expression using the TCGA clinical cohort.
Analysis of scRNA-seq Data
The scRNA-seq data were processed and integrated into a Seurat object using the Seurat R package (version 5.3.0)[28]. Cells were excluded if they contained fewer than 200 UMIs or more than 6,000 UMIs, expressed fewer than 200 genes, or displayed a mitochondrial gene content exceeding 20%. Potential doublets were identified and removed using the DoubletFinder R package (version 2.0.4). Datasets were integrated using Harmony (v1.2.3), and the integrated matrix was subsequently clustered following the standard Seurat workflow. We further assessed the effectiveness of Harmony-based batch correction by comparing UMAP embeddings before and after integration. The count matrix was normalized using a log-normalization approach with a scale factor of 10,000, and the top 2,000 highly variable genes (HVGs) were identified via the “vst” method in the FindVariableFeatures function. To correct for confounding effects arising from mitochondrial/ribosomal content (% UMIs), DIG signature scores, technical batch, and donor variability, the HVG matrix was z-scaled using the ScaleData function in Seurat. Dimensionality reduction was conducted in two sequential steps: principal component analysis (PCA) based on the 2,000 HVGs, followed by uniform manifold approximation and projection (UMAP) applied to the first 20 principal components using the RunUMAP function. Cell clustering was then performed by constructing a shared nearest neighbor (SNN) graph and optimizing cluster structure using the Louvain algorithm via the FindClusters function. Differentially expressed genes (DEGs) defining each subcluster were identified with FindAllMarkers, which served as the basis for subsequent tissue-specific enrichment analysis and subtype classification. Cell-cycle scores were calculated based on canonical S-phase and G2/M-phase gene sets. To minimize potential clustering bias caused by cell-cycle heterogeneity, cell-cycle-associated variation was regressed out before dimensionality reduction and clustering. The distribution of G1, S, and G2/M phase cells was then assessed across clusters.
Cell distribution variation
The proportion of cells in each subcluster was calculated and compared across the three clinical states. To characterize the distribution patterns of each cell type among different tumor stages, scatter plots and density plots were generated to visualize cell type proportions for each patient. For identifying cell populations shared across prostate cancer states, an observed-to-expected ratio (Rₒ/ₑ = observed/expected) was computed for each combination of cell cluster and cancer status[29]. Expected cell counts were derived from χ² contingency tables under the assumption of independence. Additionally, a correlation heatmap was used to depict expression relationships among the different cell types.
Single-cell inferred copy number alterations (CNAs)
Large-scale chromosomal alterations were inferred from scRNA-seq data using inferCNV (v1.20.0). Untreated samples served as the reference group for CNA inference in treated samples. Prior to analysis, genes with mean expression below 0.1 counts per cell were excluded. CNV signals were then denoised by applying a dynamic threshold set at 1.3 standard deviations from the mean. The resulting denoised and normalized expression matrix was organized according to genomic position. This matrix was visualized as a heatmap using the ComplexHeatmap package (v2.14.4) in R, based on 30% randomly subsampled cells from each biological group.
Cell trajectory inference
Developmental trajectories were reconstructed using CytoTRACE (v0.3.3), Monocle3 (v1.3.7), and Monocle2 (v2.32.0). Pseudotemporal ordering was performed by integrating CytoTRACE trajectory modeling with Monocle2 (v2.32.0). Highly variable genes were selected from epidermal cells using the dispersionTable function in Monocle, followed by dimensionality reduction via DDRTree. The resulting trajectory was visualized using the plot_cell_trajectory function.
Transcriptional regulatory network analysis
Transcriptional regulatory networks were reconstructed using the SCENIC pipeline (v1.1.3). Reference transcription factors (TFs) for the hg38 genome were obtained from RcisTarget, and a gene expression matrix normalized by Seurat was used as input. Co-expression modules linking transcription factors and potential target genes were first inferred using GRNBoost2. These associations were subsequently refined through cis-regulatory motif enrichment analysis performed with the ctx module, leading to the identification of regulons—defined as transcription factor and their direct target gene sets—for further analysis. To characterize subtype-specific regulatory programs in malignant tumor cells, regulon activity was quantified per cell using AUCell enrichment scores. Differential regulon activation across subtypes was assessed with Wilcoxon rank-sum tests via the FindAllMarkers function in Seurat (parameters: min.pct = 0.2, logfc.threshold = 0.25, only.pos = TRUE). Significant regulons were visualized by hierarchical clustering based on scaled regulon activity scores.
Gene pathway enrichment analysis
Differentially expressed genes (DEGs) for each cell type were identified using the FindMarkers function in Seurat with the Wilcoxon Rank Sum test (default parameters). Genes were classified as DEGs if they met the following criteria: (1) detected in more than 25% of cells within a given cluster, and (2) exhibiting an average log₂ fold change greater than 0.25 compared to other clusters. Cell type annotation was performed using a dual strategy: canonical marker genes identified through DEG analysis were cross-referenced with established literature and further validated using Seurat's FeaturePlot and VlnPlot functions. Subtype resolution for each defined cell population was achieved by reapplying Seurat's standard clustering workflow.Gene set enrichment was conducted via gene set variation analysis (GSVA) implemented in the GSVA package (v1.52.3). GO pathway analysis was performed using the R package clusterProfiler (v4.12.1). Single-cell pathway activity scoring was carried out with the AUCell R package (v1.26.0). Gene expression rankings per cell were first generated from the input expression matrix using the AUCell_buildRankings function under default settings. Canonical pathway gene sets were obtained from the Broad Institute's Molecular Signatures Database (MSigDB). For each pathway-cell pair, pathway activity was quantified as the area under the curve (AUC) score using the AUCell_calcAUC function. This score reflects the enrichment of pathway-specific genes among the top-ranking expressed genes in each cell, where an AUC value of 1.0 indicates that all pathway genes rank within the highest expression percentiles.
Spatial transcriptomics data analysis of CRPC
Spatial transcriptomics RNA-seq data were obtained from the GEO database (accession GSE278936). Data were processed using the Seurat package. Raw gene expression matrices were log-normalized with a scale factor of 10,000. Quality control filtering retained cells with 10-10,000 detected genes and 10-25,000 UMIs. The top 2,000 highly variable genes were then identified using variance-stabilizing transformation (vst). Expression values of these genes were scaled to unit variance prior to dimensionality reduction via principal component analysis (PCA). Nonlinear embeddings were generated with UMAP based on the first 30 principal components. Spatial organization patterns were visualized by projecting UMAP-derived clusters back onto the original tissue coordinates.
Spatial transcriptomics cell type deconvolution
Cell type deconvolution of the spatial transcriptomics data was performed using the RCTD algorithm within the spacexr package. Single-cell RNA sequencing data with annotated cell types were extracted, where cell type labels were converted to named factors; nUMI vectors were also computed to construct the reference object. The spatial transcriptomics data were converted into a SpatialRNA object by extracting UMI counts from the "Spatial" assay, along with the corresponding two-dimensional tissue coordinates (x,y). The nUMI counts were then quantified for each spot. Deconvolution was executed in “full” mode—allowing multiple cell types per spot—using the create. RCTD function. The resulting cell type weight matrix was integrated into the metadata of the spatial Seurat object, while the complete deconvolution results were saved for downstream analysis of spatial cell type distributions.
Spatial Co-localization Analysis
Spatial cell-cell interactions were quantified using the mistyR package. Composition matrices obtained from RCTD deconvolution were converted into tibble format. Tissue coordinates were extracted from the corresponding Seurat object. A paraview radius was defined as the ceiling value derived from the Euclidean distance matrix. Multi-view models were trained using the run_misty pipeline.
Cell culture, RNA interference and plasmid transfection
The RWPE-1 cell line was obtained from ATCC and maintained in Keratinocyte Serum-Free Medium (K-SFM; Gibco, 17005-042). Human prostate cancer cell lines—including LNCaP, C4-2, PC-3, and 22Rv1—were purchased from the Chinese Academy of Sciences Cell Bank (Shanghai, China) and cultured in standard medium supplemented with 10% fetal bovine serum (Biological Industries) and 1% penicillin/streptomycin (HyClone). All cell lines were grown at 37°C in a humidified incubator with 5% CO₂ and routinely confirmed to be free of mycoplasma contamination. siRNA transfections were performed by reverse transfection using Lipofectamine RNAiMax (Invitrogen). All siRNAs were transfected at a final concentration of 10-20 nM. The sequences of all siRNAs used in this study are provided in Table S4.
Western blotting and real-time quantitative PCR
Cells were harvested and lysed in RIPA buffer supplemented with 1% phosphatase and protease inhibitor cocktails. Protein concentration was determined using a BCA protein quantification kit (Yazyme, ZJ101). Equal amounts of protein lysates were separated by SDS-PAGE and transferred onto nitrocellulose (NC) membranes. After blocking with 5% skim milk for 1 h at room temperature, the membranes were incubated with specific primary antibodies diluted in blocking buffer overnight at 4 °C. The membranes were then washed three times (5 min per wash) with 1× TBST and incubated with HRP-conjugated secondary antibodies for 1 h at room temperature. Following another three washes with TBST, protein bands were visualized using BeyoECL Plus (BEYOTIME, P0018M).
Total RNA was extracted using TRIzol reagent (Thermo Fisher Scientific, 15596018). RNA purity and concentration were measured spectrophotometrically. Then, 500 ng of RNA was reverse-transcribed into cDNA using the PrimeScript RT Master Mix reagent (TaKaRa, RR036A). Quantitative PCR (qPCR) was performed using the resulting cDNA, gene-specific primers (Sangon Biotech), and PowerUp SYBR Green Master Mix (Thermo, A25742). GAPDH was used as the internal reference gene. The sequences of all primers used in this study are provided in Table S4.
Tissue samples, H&E staining and immunohistochemistry staining
Human prostate cancer (PCa) and adjacent normal prostate tissue samples for SENP6 protein level analysis were obtained from the Urological Department Tissue Specimen Bank. Tissue specimens were snap-frozen in liquid nitrogen and stored at -80 °C until use.
For both hematoxylin and eosin (H&E) staining and immunohistochemistry (IHC), xenograft tumor and clinical PCa samples were fixed in formalin and embedded in paraffin. Sections of 4 μm thickness were prepared and mounted. For H&E staining, tissue sections were deparaffinized in xylene and rehydrated through a graded ethanol series (100% → 95% → 80% → 70%). The slides were then stained with hematoxylin, rinsed, and counterstained with 1% eosin. After staining, tissues were dehydrated through a reverse ethanol series, cleared in xylene, and coverslipped with mounting medium. Immunostaining was performed as previously described[30]. Anti-SENP6 antibody (sc-100585) was used to assess SENP6 expression in human prostate cancer and normal tissues. In mouse xenograft tumors, anti-SENP6 (sc-100585) and anti-Ki67 (ab15580) antibodies were applied to evaluate protein expression.
Cell Clonal proliferation assay and CCK8 cell proliferation assay
Cell proliferation was assessed using a CCK-8 kit (Beyotime, China). A total of 1,000 cells resuspended in 100 μL of medium containing 10% FBS were seeded into three replicate wells of a 96-well plate. The CCK-8 working solution was prepared by mixing 10 μL of CCK-8 reagent with 100 μL of RPMI-1640 or DMEM. Then, 110 μL of the mixture was added per well, followed by incubation for 2 h. Absorbance was measured at 450 nm.
Colony formation assay and transwell invasion assay
For the colony formation assay, subcultured cells were digested, resuspended in fresh medium, counted, and seeded into 6-cm culture dishes at a density of 1,000 cells per dish. After 14 days, the medium was removed and cells were fixed with 4% paraformaldehyde for 30 min. Following fixation, cells were stained with 0.1% crystal violet solution for 30 min, rinsed three times with pure water, and air-dried before imaging and colony counting. For the Transwell invasion assay, cell invasion ability was evaluated using Transwell chambers pre-coated with Matrigel. Cells were seeded in serum-free medium into the upper chamber, while the lower chamber contained medium with 10% FBS as a chemoattractant. After 24 h of incubation, non-invading cells were removed from the upper chamber with a cotton swab. Cells that migrated to the lower surface were fixed, stained, and counted under a microscope.
5-Ethynyl-2'-deoxyuridine (EdU) incorporation assay
The 5-ethynyl-2′-deoxyuridine (EdU) incorporation assay was conducted using the Click-iT™ EdU Imaging Kit (Thermo Fisher, C10420) following the manufacturer's instructions. Cells were incubated with 20 μM EdU for 1 h, then fixed with 4% paraformaldehyde. After washing, cells were incubated in PBS containing 3% BSA. The Click-iT reaction cocktail was then added and incubated for 30 min. Blocking was performed using 3% BSA with 0.05% Tween-20 in PBS (PBST blocking buffer) for 1 h at room temperature. Cells were then incubated overnight at 4 °C with a primary antibody against biotin (Rabbit, Abcam, ab53494) diluted in the blocking solution.
Subcutaneous tumorigenesis experiment
The SENP6 overexpression lentiviral vector was obtained from Youze Biotech (Changsha, Hunan). Lentivirus was produced by co-transfecting HEK293T cells with control or HA-SENP6 expression plasmids, along with the psPAX2 packaging plasmid and pMD2.G envelope plasmid, using Lipofectamine 2000. Viral supernatants were collected 48 h after transfection and stored at -80 °C for subsequent use. For in vivo studies, male NOD/SCID mice (6 weeks old, 22-24 g; Shanghai SLAC Laboratory Animal Co., Ltd.) were housed under specific pathogen-free conditions in the animal center of Hospital, with temperature maintained at 22 ± 0.5 °C, humidity at 60% ± 3%, and an automated 12 h light/dark cycle. Food and water were provided ad libitum. Mice were divided into experimental groups and injected subcutaneously on the right flank with a 1:1 mixture of cells and Matrigel. Tumor size was measured every other day using a caliper for 6 weeks post-injection. At the endpoint, mice were euthanized, and tumors were excised and processed for further analysis.
Colocalization of immunofluorescence staining
Cells on glass coverslips were washed twice in PBS and fixed with 4% paraformaldehyde (PFA) for 18mins. Cells were permeabilized with 0.5% (v/v) Triton X-100 for 7mins and incubated with fresh blocking solution (PBS containing 0.05%Tween-20 and 3%BSA) for 1h. Primary antibodies were diluted 1:1000 in blocking solution and added to cells for overnight refrigerated. Next, cells were washed three times with PBST(PBS containing 0.05%Tween-20) for 5mins and incubated with Alexa-coupled secondary antibodies (488nm, 555nm, 647nm; diluted 1:1,000 in blocking solution) for 1 h at RT. Then, cells were washed three times with PBST and mounted on slides with Prolong Gold Anti-fade reagent with DAPI (Life Technologies). Once the Prolong Anti-fade polymerized and cured, cells were visualized by conventional fluorescence with 10X and 60X Plan l objective (1.4 oil) using a Nikon Eclipse Ni.
Molecular Docking and Interaction Domain Analysis
The amino acid sequences of SENP6 and AR were obtained from the UniProt database. Protein domain information and related functional annotations were retrieved from the UniProt and InterPro databases. Protein-protein interaction between SENP6 and AR was modeled using AlphaFold 3. The amino acid sequences of SENP6 and AR were used as input to predict the three-dimensional structure of the SENP6-AR complex. The predicted structure was subsequently subjected to standardized processing in PyMOL, including removal of water molecules, addition of hydrogen atoms, and structural optimization, followed by energy minimization to reduce potential steric clashes and optimize the protein conformation. The resulting complex structure was used to analyze the potential binding mode and interaction interface between SENP6 and AR. Protein domain information obtained from UniProt and InterPro was further integrated to assess the potential regions involved in the SENP6-AR interaction.
Results
Diversity of cell subtypes in prostate cancer
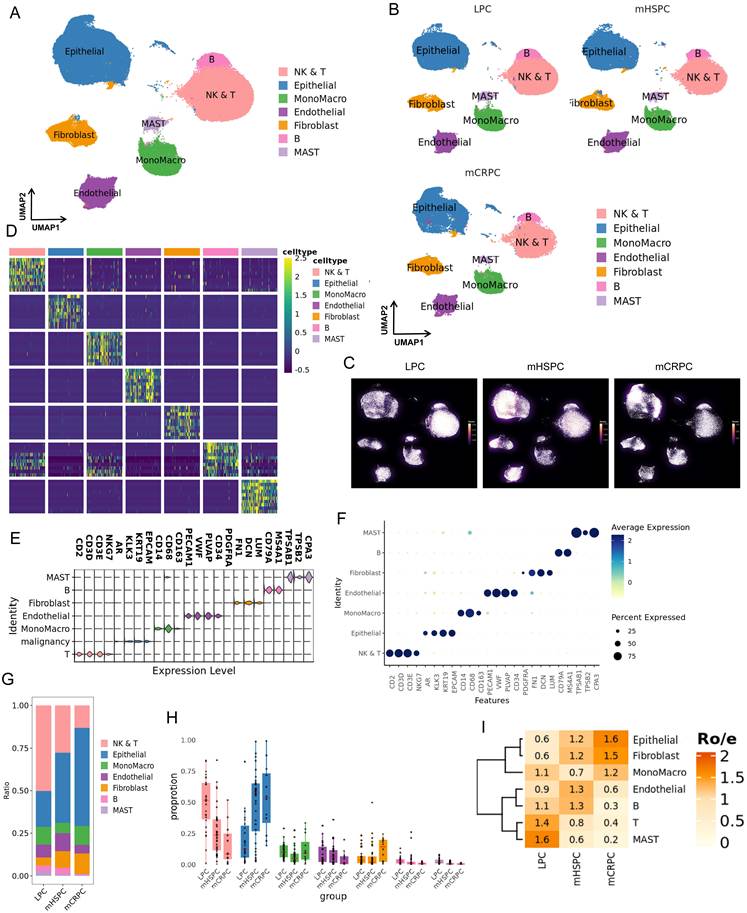
To depict the single-cell atlas of prostate cancer, we performed an in-depth analysis of scRNA-seq data from 94 cases, including LPC (ADT-naïve, n = 30), mHSPC (ADT-treated, n = 32), and mCRPC (ADT-resistant, n = 32). Following quality control and filtering, we generated a dataset comprising 257,303 cells and identified seven major cell types (Fig. 1A-1C). Cell clusters were annotated based on classical cell markers and differentially expressed genes within each cluster (Fig. 1D, 1F, Table S2). We further evaluated the potential influence of cell-cycle status on clustering. After regressing out cell-cycle effects, cells from different cell-cycle phases, including G1, S, and G2/M, were evenly distributed across clusters, suggesting that cell-cycle heterogeneity did not substantially bias the clustering results (Fig. S1A, 1B). We further calculated cell-cycle scores for canonical S-phase and G2/M-phase gene sets. The S.score and G2M.score results showed that cells were well distributed across clusters, indicating that clustering was not driven by cell-cycle effects (Fig. S1C, 1D). These cell types included NK/T cells, epithelial (Epi) cells, mononuclear macrophages (Mono/Macro), endothelial cells, fibroblasts, B cells, and mast cells. To validate the distributional trends of prostate cancer-related cell populations, we further examined the ratio plot (Fig. 1G), proportion plot (Fig. 1H), and Ro/e plot (Fig. 1I). We observed pronounced variations in the abundance of all cell types across the three disease stages. Epithelial cells and fibroblasts showed a progressive increase from LPC to mCRPC, whereas NK/T cells and mast cells exhibited a decreasing trend. Notably, monocyte/macrophage populations first decreased and then increased, while endothelial cells and B cells displayed the opposite pattern. These dynamic changes indicate that the tumor and immune microenvironments undergo substantial remodeling during prostate cancer progression, reflecting significant tumor heterogeneity across disease stages. Based on the above analysis, the pre-correction UMAP demonstrated distinct dataset-specific separation, whereas the post-correction UMAP displayed improved mixing of cells from different datasets, indicating effective batch-effect removal (Fig. S1E, 1F).
Single-cell atlas of the prostate cancer. (A) UMAP projection of 257,303 high-quality single cells, colored by major cell-type annotations. (B) UMAP projections separated by clinical stage, including localized prostate cancer (LPC), metastatic hormone-sensitive prostate cancer (mHSPC), and metastatic castration-resistant prostate cancer (mCRPC), revealing stage-associated cellular distributions. (C) Density distribution of seven major cell types across the three disease stages. (D) Heatmap showing the top 10 marker genes for each annotated cell type. (E) Violin plots showing the expression of the top three representative marker genes across the seven major cell populations. (F) Dot plot showing the expression level and proportion of cells expressing stage-specific marker genes across major cell types. (G) Stacked bar plot showing the relative contribution of each major cell type to individual disease stages. (H) Boxplots with overlaid scatter points comparing the proportional abundance of each cell type across LPC, mHSPC, and mCRPC. (I) Ro/e ratio plot showing observed-to-expected cell-type distributions across disease stages, identifying cell types enriched or depleted during prostate cancer progression.
Malignant epithelial subtypes exhibit distinct distributions across prostate cancer stages
The UMAP analysis identified six epithelial subpopulations, including normal epithelial cells, three AR-positive prostate cancer subtypes (ARPC1, ARPC2, and ARPC3), and two NEPC-like epithelial states, designated NEPCA (ASCL1-positive) and NEPCM (MKI67-positive) (Fig. 2A). Annotation of epithelial subtypes was primarily based on the expression levels of canonical cell markers (Fig. 2B, 2C, Table S3). Gene expression patterns in the UMAP plot indicated that AR, KLK3, and NKX3-1 were progressively upregulated from ARPC1 to ARPC3, but downregulated in the two NEPC subtypes (Fig. 2G), consistent with known tumor evolution processes. Additionally, FOXA1 was highly expressed in AR⁺ prostate cancer but markedly downregulated in NEPC, while FOXA2 exhibited an opposite trend (Fig. 2G), further illustrating the substantial heterogeneity across tumor stages. Previous studies have shown that FOXA1 mutations contribute to prostate tumorigenesis and therapy resistance[31], whereas FOXA2 can drive neuroendocrine transdifferentiation in prostate cancer[32]. Next, epithelial cell distribution was assessed using ratio plots (Fig. 2E), Ro/e plots (Fig. 2D), and cell density plots (Fig. 2F). ARPC1 and ARPC2 were predominantly present in the LPC stage, while normal epithelial cells were enriched in mHSPC. In the mCRPC stage, the major epithelial populations consisted of ARPC3, NEPCA, and NEPCM. The relative abundance of epithelial subtypes differed markedly across disease stages, with ARPC1 and ARPC2 predominantly detected in LPC and ARPC3, NEPCA, and NEPCM enriched in mCRPC. Notably, ARPC3 maintained relatively high expression of AR and AR-associated genes at the castration-resistant stage. The presence of ARPC3 in LPC and its marked enrichment in mCRPC raise the possibility that this population is preferentially selected or retained during disease progression and therapeutic pressure. Rare NEPC-associated transcriptional states were also detectable in LPC, suggesting that neuroendocrine-associated programs may emerge before therapy. To further assess whether these rare neuroendocrine-associated states could be detected histologically in localized disease, we performed IHC staining for SYP, FOXA2, and ASCL1 in tumor tissues from four independent LPC patients. No clearly positive tumor cells were detected in these specimens (Fig. S1G). Thus, although our single-cell data identify rare NEPC-associated transcriptional states in LPC, the current IHC analysis does not provide histological confirmation of bona fide NEPC cells at this stage.
Epithelial cell heterogeneity and malignancy assessment in prostate cancer. (A) UMAP projection of epithelial cells identifying six distinct subtypes: conventional epithelial cells (Epi), AR-positive prostate cancer subtypes (ARPC1, ARPC2, and ARPC3), and neuroendocrine prostate cancer subtypes, including ASCL1-positive NEPC (NEPC_A) and MKI67-positive NEPC (NEPC_M). (B) Dot plot showing the expression levels and proportions of cells expressing stage-specific marker genes across the six epithelial subtypes. (C) Violin plots showing the expression distributions of the top three representative marker genes for each epithelial subtype. (D) Ro/e ratio plot showing the observed-to-expected distribution of epithelial subtypes across disease stages, highlighting subtype enrichment or depletion during progression. (E) Stacked bar plot showing the relative composition of epithelial subtypes across tumor stages. (F) Density distribution of the six epithelial subtypes across LPC, mHSPC, and mCRPC stages. (G) UMAP feature plots showing the expression patterns of prostate cancer-related marker genes. (H) CNV analysis using normal epithelial cells as the reference to infer the malignant potential of prostate cancer epithelial cells. (I-J) Boxplots comparing CNV scores among epithelial subtypes (I), and ridge plots showing CNV score distributions, with NEPC and ARPC3 displaying the highest malignancy levels (J). (K-L) Comparison of CNV scores across tumor stages (K), and ridge plots showing CNV score distributions, with mCRPC samples exhibiting the highest malignancy level (L).
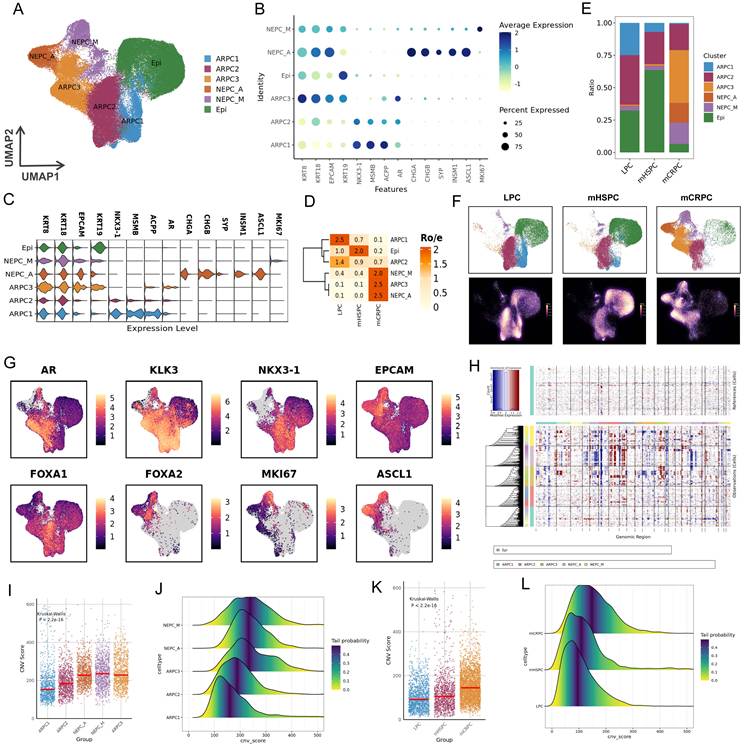
To quantify the malignancy of different epithelial subtypes, we performed CNV analysis (Fig. 2H), which were used to illustrate copy number variation changes across different tumor stages. The purpose of this analysis was to assess differences in tumor malignancy and progression status among stages, and to provide the basis for subsequent CNV score calculation (Fig. 2I-2L). CNV scores displayed a gradual increase from LPC to mHSPC and mCRPC, consistent with progressive tumor evolution (Fig. 2I, 2J). Moreover, ARPC3, NEPCA, and NEPCM exhibited markedly elevated CNV scores, suggesting these subtypes possess higher malignant potential (Fig. 2K, 2L). Therefore, AR positivity does not necessarily indicate high sensitivity to ADT, nor does it reliably reflect an early tumor stage.
Differences in developmental trajectories and differentiation levels among epithelial cell
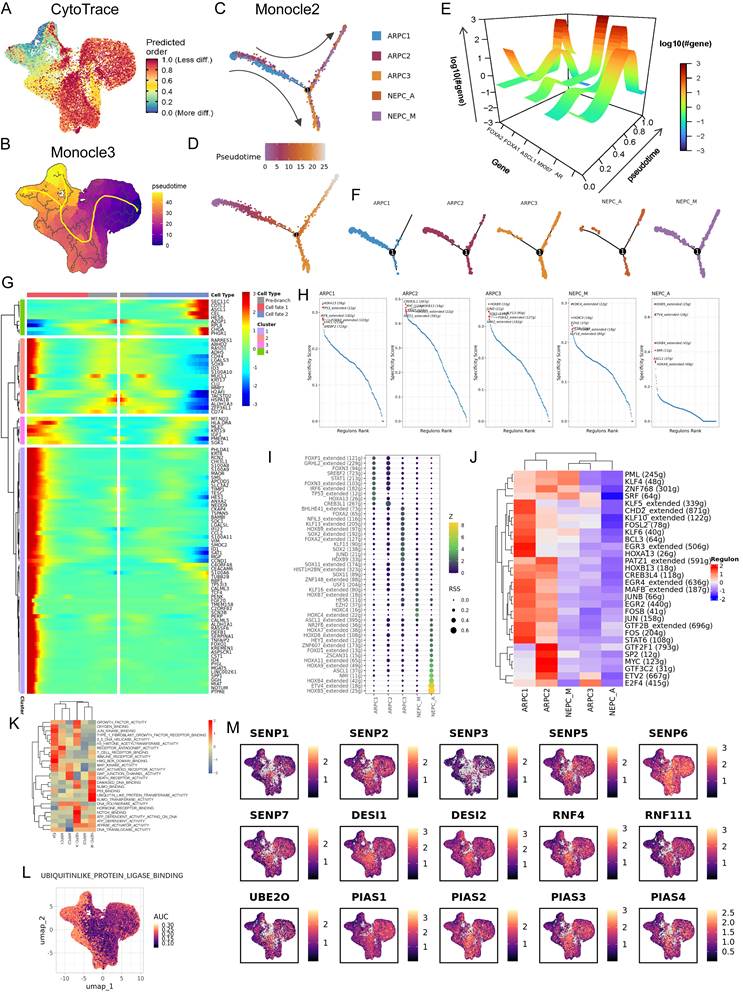
Pseudo-temporal trajectory analysis revealed that individual epithelial subpopulations followed distinct developmental paths. According to the CytoTRACE-based UMAP visualization, tumor cells positioned on the right branch generally exhibited higher CytoTRACE scores—indicating a lower degree of differentiation—whereas normal epithelial cells located on the left branch showed lower scores, reflecting higher differentiation (Fig. 3A). The inferred developmental trajectory of prostate cancer progressed from normal epithelial cells to AR⁺ prostate cancer (PCA) cells and ultimately to NEPC, consistent with classical models of prostate cancer evolution. Supporting this, the Monocle3 analysis suggested that tumor progression followed a path from the lower-right direction upward, then downward, and finally toward the upper-left region (Fig. 3B). Furthermore, as cells transitioned into the NEPC stage, the trajectory bifurcated into two distinct branches, implying that different NEPC subtypes may arise through divergent developmental routes, which could result in different biological behaviors. Next, Monocle2 was applied to identify genes that drive tumor progression (Fig. 3C, 3D). Five key genes—AR, FOXA1, FOXA2, ASCL1, and MKi67—were selected to examine dynamic expression patterns along pseudotime (Fig. 3E). Based on the 3D trajectory visualization, AR and FOXA1 displayed an initial increase followed by a decline at later stages, whereas FOXA2, ASCL1, and MKi67 exhibited low expression early in pseudotime and markedly increased expression during the NEPC phase. These findings are consistent with the known genetic alterations that accompany prostate cancer progression and further validate that the inferred trajectories reflect biological reality. Notably, the migration paths of tumor cells were clearly segregated: ARPC1 and ARPC2 were primarily distributed along the right trajectory, while ARPC3 and NEPC subtypes were mainly located along the two upper and lower branches on the left side (Fig. 3F). The gene expression heatmap was divided into four clusters, with the gray region representing pre-branch states, while Fate 1 corresponded to the upper branch and Fate 2 corresponded to the lower branch (Fig. 3G).
Tumor progression landscapes in prostate cancer. (A) CytoTRACE analysis showing the inferred differentiation potential of prostate cancer epithelial cells. (B) Monocle3 pseudotime trajectory illustrating epithelial tumor progression patterns. (C) Monocle2 trajectory after dimensionality reduction, showing the inferred progression path of prostate cancer epithelial cells. (D) Distribution of epithelial subtypes along the Monocle2 pseudotime trajectory. (E) Three-dimensional visualization of dynamic changes in AR, FOXA1, FOXA2, MKI67, and ASCL1 expression along the inferred tumor progression axis. (F) Branched Monocle2 trajectory showing divergent progression paths after dimensionality reduction. (G) Heatmap showing genes with significant branch-dependent expression changes along Monocle2 pseudotime. (H) SCENIC analysis identifying key transcription factors associated with epithelial subtype states. (I) Dot plot showing transcription factor activity across prostate cancer epithelial subtypes. (J) Heatmap showing transcription factor expression profiles across epithelial subtypes. (K) GSVA analysis showing hallmark pathway activity across cancer epithelial subtypes. (L) UMAP plot showing AUCell-estimated ubiquitin-like protein ligase pathway activity. (M) UMAP feature plots showing expression patterns of genes involved in SUMOylation regulatory balance.
SCENIC analyzes the key transcription factors of epithelial cells
Using SCENIC, we independently calculated the major transcription factors active at different stages of prostate cancer (Fig. 3H, 3I). In the early stage, canonical tumor-associated transcription factors—such as TP53, MYC, and STAT1—were predominantly involved (Fig. 3H). However, in the AR⁺ advanced stage represented by ARPC3, FOXA2 activity was markedly elevated (Fig. 3H). In addition, we observed that members of the HOX protein family became highly active during the NEPC stage (Fig. 3H). Correlation heatmap analysis further revealed that NEPCA, ARPC3, and NEPCM clustered closely together, suggesting that ARPC3 may represent a more malignant subtype (Fig. 3I). We also noted that PML activity decreased in ARPC3 and NEPCA, indicating that dysregulation of PML-mediated SUMOylation may play an important role in the later stages of prostate cancer progression (Fig. 3J).
GSVA and AUCell analysis of pathway enrichment
Based on GSVA analysis, SUMOylation-related pathways—including the SUMO binding pathway, the ubiquitin-like protein transferase activity pathway, and the SUMO transferase activity pathway—showed marked variation across different stages of prostate cancer, with particularly high activity observed in the NEPCM stage (Fig. 3K). We further applied AUCell to evaluate the activity of the ubiquitin-like protein ligase binding (ULPLB) pathway in the UMAP view. The ULPLB pathway exhibited a progressively increasing activity trend from the early to the terminal stages, suggesting that elevated SUMOylation levels may contribute to tumor progression. Expression levels of SUMO-regulated genes are displayed in Fig. 3M. Overall, the SENP family and RNF4 showed a pattern of reduced expression in the terminal stage, which may imply impaired SUMO deconjugation and dysregulated protein degradation during advanced prostate cancer.
Naïve CD4 T cell and M2 were concentrated in mCRPC
NK and T cells were divided into five clusters (Fig. S2A,Table S3), which were annotated as tissue-resident memory CD8 T cells (CD8⁺ TRM), exhausted CD8 T cells (CD8⁺ Exh), naïve CD4 T cells (CD4⁺ naïve), CD56^bright natural killer cells (NK^CD56bright), and regulatory T cells (Treg) (Fig. S2B). Density plots showed that CD8⁺ TRM, CD8⁺ Exh, and CD4⁺ naïve cells were predominantly enriched in the LPC, mHSPC, and mCRPC stages, respectively (Fig. S2C). The corresponding ratio plots (Fig. S2D) and Ro/e plots (Fig. S2E) demonstrated similar trends. Correlation heatmaps depicting the associations between immune cell subsets and tumor stages are presented in Fig. S2F and S2G. Differentially expressed genes (DEGs) for each T-cell subset were subsequently identified (Fig. S2H). GSVA analysis revealed significant enrichment of pathways associated with CD4⁺ naïve-cell DEGs (Fig. S2I). These findings suggest that CD4⁺ naïve cells may promote mCRPC progression by activating Wnt signaling, negatively regulating immune responses, and facilitating epithelial-mesenchymal transition.
Macrophages were classified into five subtypes (Fig. S3A), designated as plasmacytoid dendritic cells (DC2), macrophage 1 (M1), macrophage 2 (M2), monocytes, and macrophages with metallothionein expression (MTs) (Fig. S3B). LPC and mHSPC samples were dominated by M1 macrophages, whereas mCRPC samples primarily contained M2 macrophages (Fig. S3C, S3D). Correlation heatmaps for macrophage subsets are shown in Fig. S3E, F. DEG analysis for macrophage subsets is shown in Fig. S3G, and M2-specific DEGs are highlighted in Fig. S3H. We observed high expression of multiple HLA-related genes in M2 macrophages, indicating a potential role for M2 cells in modulating T-cell activation via HLA family molecules. GO analysis of the upregulated M2 DEGs revealed enrichment in pathways related to the positive regulation of MAPK, ERK1/2 cascades, ubiquitin-like protein binding, and NF-κB signaling, among others (Fig. S3I).
Cancer associated fibroblast (CAF) undergo stage-specific remodeling during prostate cancer progression
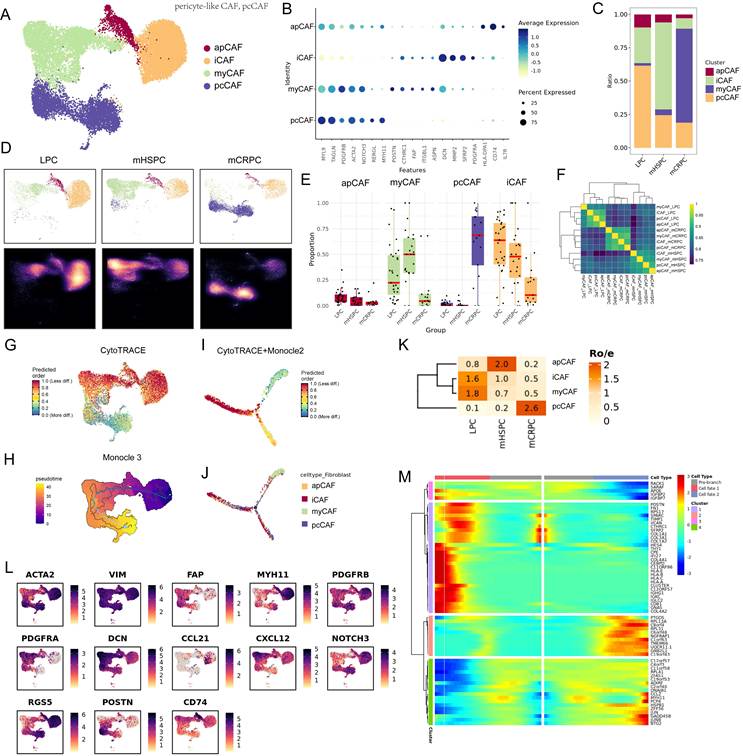
Clustering analysis of fibroblast subpopulations in prostate cancer tissues identified four major CAF subtypes: antigen-presenting CAFs (apCAF), inflammatory CAFs (iCAF), myofibroblast-like CAFs (myCAF), and pericyte-like CAFs (pcCAF) (Fig. 4A, B and 4L, Table S3). Ratio plots, density plots, and box-scatter diagrams demonstrated that apCAF and iCAF were most abundant in LPC, myCAF predominated in mHSPC, and pcCAF represented the dominant fibroblast subtype in mCRPC (Fig. 4C-4E). These data indicate that CAF composition undergoes stage-specific alterations during disease progression, which may contribute to tumor drug resistance. Correlation analysis further revealed that CAFs from the same tumor stage tend to cluster together, whereas CAFs across different stages show minimal correlation (Fig. 4F). This suggests substantial CAF heterogeneity across tumor progression. CytoTRACE was used to infer the developmental trajectory of CAFs, where red indicates early developmental states and blue indicates terminal states. The results showed that early-stage tumors were predominantly characterized by iCAF and apCAF, whereas pcCAF emerged as the dominant subtype in later stages (Fig. 4G). Consistently, trajectory inference using Monocle3 revealed a similar developmental pattern (Fig. 4H). Moreover, CytoTRACE integrated with Monocle2 for dimensionality reduction and trajectory reconstruction identified two distinct developmental branches among CAF subtypes (Fig. 4I, 4J). Ro/e analysis showed that apCAF increased during early progression and then declined, while iCAF and myCAF gradually decreased from initially high levels. In contrast, pcCAF displayed a steadily increasing trend across tumor progression (Fig. 4K). The Monocle2 heatmap was divided into four clusters, where the gray region represents gene expression in the pre-branch population, and fate 1 and fate 2 correspond to the upper and lower trajectory branches, respectively (Fig. 4M).
Fibroblast heterogeneity, dynamics, and developmental trajectories in prostate cancer. (A) UMAP plot identifying distinct fibroblast subtypes, including apCAF, iCAF, myCAF, and pcCAF. (B) Dot plot showing the expression patterns of stage-specific marker genes across fibroblast subtypes. (C) Stacked bar plot showing the relative proportions of fibroblast subtypes across tumor stages. (D) Density distribution of fibroblast subpopulations across LPC, mHSPC, and mCRPC stages. (E) Boxplots with overlaid scatter points showing the proportional abundance of each fibroblast subtype across tumor progression stages. (F) Correlation heatmaps showing the relationships between tumor samples and the identified fibroblast subtypes. (G) CytoTRACE analysis illustrating the developmental potential and trajectory of fibroblast cells. (H) Monocle3-inferred pseudotime trajectory showing fibroblast progression patterns. (I-J) Combined Monocle2 and CytoTRACE trajectory plots after dimensionality reduction, depicting the developmental progression paths of fibroblast subtypes. (K) Ro/e ratio plot highlighting significant enrichment or depletion of the four fibroblast subtypes across disease progression. (L) UMAP feature plots showing the expression patterns of key fibroblast-related marker genes. (M) Heatmap showing genes with significant expression changes along distinct pseudotime branches identified by Monocle2 analysis.
Combined spatial transcriptomics analysis of the resistance mechanisms in PC
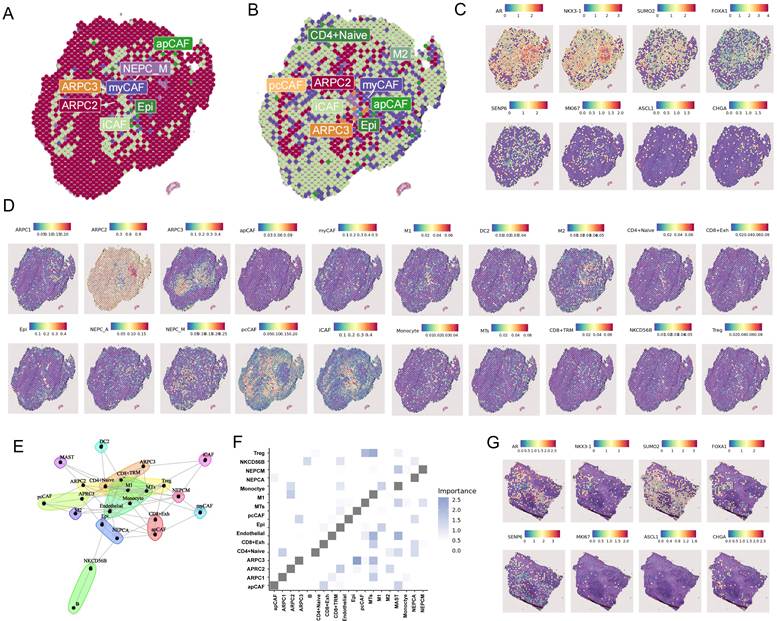
To characterize the spatial organization of tumor and stromal populations in advanced prostate cancer, we integrated mCRPC spatial transcriptomic data with our scRNA-seq reference. Spatial mapping revealed distinct distributions of major and minor cell populations across tumor regions (Fig. 5A, 5B). ARPC3 tumor cells were predominantly localized within central tumor regions and were spatially surrounded by CAF populations, particularly pcCAFs and iCAFs (Fig. 5C, 5D). Partial spatial overlap between M2 macrophages and ARPC3 tumor cells was also observed. Spatial co-localization analysis further demonstrated a strong association between ARPC3 cells and pcCAFs (Fig. 5E, 5F). These findings identify a spatially organized ARPC3-CAF niche in mCRPC and raise the possibility that CAF-associated stromal remodeling may contribute to a microenvironment favorable for the persistence of ARPC3 cells. Analysis of an independent mCRPC spatial transcriptomic dataset further showed widespread expression of SUMOylation-associated genes together with relatively low SENP6 expression in advanced tumor regions (Fig. 5G).
Spatial transcriptomic mapping and spatial organization of cell types in prostate cancer. (A) Spatial transcriptomic map showing the primary predicted cell type with the highest prediction score for each spatial spot. (B) Spatial transcriptomic map showing the secondary predicted cell type with the second-highest prediction score for each spatial spot. (C) Spatial feature plots showing the localization patterns of stage-specific marker genes across prostate cancer tissue sections. (D) Spatial distribution map showing the localization of different cell types within prostate cancer tissue sections. (E) Spatial co-localization analysis showing the spatial proximity and potential interaction patterns among different cell types. (F) Correlation matrix summarizing cell-type co-localization patterns identified by spatial transcriptomic analysis. (G) Expression levels of stage-specific marker genes across distinct spatial regions of prostate cancer tissues.
SENP6 suppresses the malignant features of PCa
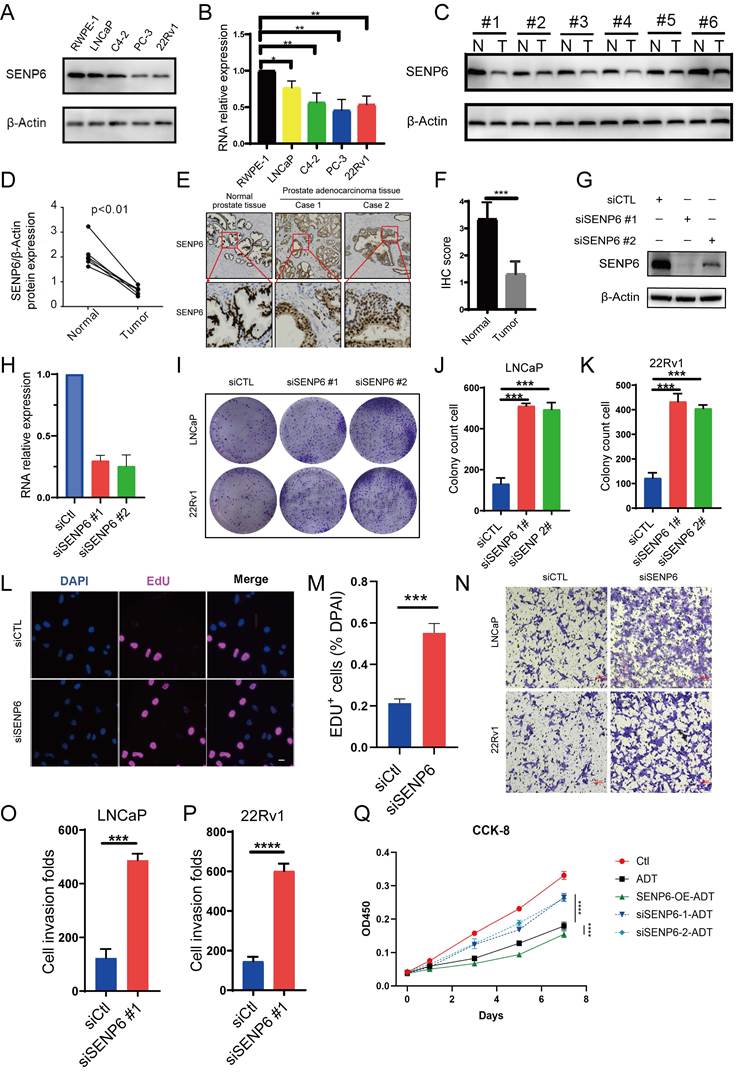
The expression of SENP6 was significantly lower in tumor tissues than in normal prostate tissues according to analyses of the TCGA and GSE14206[33] datasets, and its expression was further reduced in metastatic lesions (Fig. S4A-S4C), suggesting that SENP6 may play an important regulatory role in prostate cancer (PCa). Although SENP6 expression was not significantly associated with Disease Free Survival in the TCGA cohort (Fig. S4D), its reduced expression in advanced/metastatic prostate cancer suggests that SENP6 may be related to disease progression rather than serving as an independent prognostic marker in the current dataset. We further analyzed the differential expression of SENP6 across different cell subtypes and tissue origins, and found that SENP6 expression was higher in early-stage prostate cancer (Fig. S4E-S4G). These results suggest that SENP6 may play an important stage-dependent regulatory role in prostate cancer. Its lower expression in tumor tissues compared with normal prostate tissues, and its further reduction in metastatic lesions, indicate that SENP6 downregulation may be associated with PCa initiation, progression, and metastasis. In contrast, the relatively higher expression of SENP6 in early-stage PCa, followed by a subsequent decrease in advanced-stage PCa, may reflect its involvement in regulating cellular states or compensatory responses during early tumorigenesis. Therefore, we speculate that SENP6 may function as an important regulator of PCa progression and may have potential diagnostic and prognostic value. To validate this, we collected protein samples from a benign prostate epithelial cell line (RWPE-1) and four prostate cancer cell lines (LNCaP, C4-2, PC-3, and 22Rv1). Western blot analysis revealed that SENP6 was markedly downregulated in all prostate cancer cell lines compared with RWPE-1 (Fig. 6A), and qPCR results demonstrated a similar trend (Fig. 6B). Consistently, Western blot analysis of tumor tissues and matched adjacent normal tissues from six patients revealed consistently lower SENP6 protein expression in tumor tissues than in their paired normal counterparts. (Fig. 6C, 6D). Additional IHC data obtained from the Hospital pathology database further confirmed that SENP6 expression was significantly decreased in clinical PCa specimens compared with normal prostate tissue (Fig. 6E), and IHC scores were calculated based on both the proportion of positive staining cells and staining intensity (Fig.6F). Given the downregulation of SENP6 in PCa tissues, we hypothesized that SENP6 may function as a tumor suppressor in prostate cancer. To test this hypothesis, SENP6 was silenced using specific siRNAs in prostate cancer cell lines (Fig. 6G, 6H). Of the two lines used, LNCaP represents a hormone-sensitive PCa (HSPC) cell line[34], whereas 22Rv1 is derived from CWR xenografts grown under castration and is considered a CRPC cell line capable of androgen-independent growth[35, 36]. Colony formation assays showed that SENP6 knockdown markedly enhanced clonogenic capacity in both LNCaP and 22Rv1 cells (Fig. 6I-6K). In addition, EdU incorporation assays showed that SENP6 knockdown increased the proportion of DNA-synthesizing PCa cells, suggesting that SENP6 may restrain S-phase progression and DNA replication (Fig. 6L, 6M). Transwell migration and invasion assays indicated that SENP6 silencing significantly promoted the motility and invasive potential of prostate cancer cells (Fig. 6N-6P). To determine whether SENP6 modulates the therapeutic response to androgen deprivation therapy (ADT), we assessed ADT-mediated inhibition of cell proliferation in cells with SENP6 knockdown or overexpression(Fig. 6Q). SENP6 depletion significantly attenuated the antiproliferative effect of ADT, whereas SENP6 overexpression markedly enhanced cellular sensitivity to ADT. These results provide functional evidence that SENP6 contributes to the regulation of ADT sensitivity.
The expression of SENP6 in tumors and relationship with proliferation. (A) and (B) The protein and mRNA expression of SENP6 in the most commonly used PCa cell lines, the androgen-responsive cell lines LNCaP and 22Rv1, androgen-independent cell lines C4-2 and PC-3, and the benign prostate cell lines RWPE-1. (C), (D) Western blot analysis of SENP6 expression in 6 paired PCa tissues (T) and matched paracancerous non-tumor tissues (N) from the same patient. β-Actin was used as a loading control, and the protein levels of SENP6 in (C) were quantified with ImageJ software and are shown (D). (E) Representative images for IHC staining of SENP6 protein expression in normal prostate tissues and PCa tissues. (F) Bar graph of SENP6 expression in normal prostate tissue sections and PCa tissue sections, as determined by IHC scores (normal prostate tissues, n = 21; PCa tissues, n = 28). (G), (H) LNCaP cells were transfected with siSENP6 for 72 h. Then, the cells were harvested for western blot (G) and qRT‒PCR (H) analyses. (I), (J) and (K) LNCaP and 22Rv1 cells were transfected with siSENP6 or siCtl for 72 h. Then, the cells were used for colony formation assays. (I) Representative images of colony formation assays. (J), (K) Quantification of colony numbers. (L) and (M) LNCaP cells were transfected with siSENP6 for 72 h and treated with EdU cell proliferation detection kit (scale bar: 50 μm). (N), (O) and (P) LNCaP and 22Rv1 cells were transfected with siSENP6 or siCtl for 72 h. Then, the cells were used for Transwell assays (N), and the quantitative data are shown (O, P). (Q) LNCaP cells were transfected with siSENP6, OE-SENP6, or siCtl and cultured under ADT conditions. Cell viability was measured using the CCK-8 assay at the indicated time points. Data are presented as mean ± SD from three independent experiments. Statistical significance was determined using two-way ANOVA followed by Tukey's multiple comparisons test. *P < 0.05, ** P < 0.01, *** P < 0.001, **** P < 0.0001.
SENP6 can bind to the AR protein and inhibit the accumulation of SUMOylation modifications
Analysis of the TCGA dataset revealed a positive co-expression pattern between AR and SENP6 (Fig. S4H), ChIP-seq analysis of GSE83860[37] further showed AR occupancy at the regulatory region of the SENP6 gene, with enhanced AR binding following androgen stimulation (Fig. S4I). To determine whether AR regulates SENP6 expression, we assessed SENP6 protein and mRNA levels upon ADT or dihydrotestosterone (DHT) treatment. SENP6 expression decreased under ADT conditions and increased following DHT treatment at both the protein and transcript levels (Fig. 7A, 7B), supporting positive regulation of SENP6 by AR signaling. To explore the functional relevance, we mutated the catalytic cysteine residue of SENP6 (C1030A) to generate a de-SUMOylation-deficient SENP6-HA construct and transduced LNCaP cells with lentiviral vectors expressing either SENP6-WT or SENP6-C1030A (Fig. S4J). Immunofluorescence staining showed that SENP6-WT accumulated at AR foci, whereas SENP6-C1030A displayed even greater accumulation at AR sites (Fig. 7C), indicating that SENP6-AR binding is dynamic and that loss of de-SUMOylation activity traps SENP6 at AR loci without enabling catalytic removal of SUMO chains. In the SENP6-C1030A group, HA signal intensity at AR foci positively correlated with AR intensity, and both were significantly higher than in the SENP6-WT group (Fig. 7D, Fig. S4K). Co-immunoprecipitation further confirmed the interaction between SENP6 and AR (Fig. 7E). To further explore the potential structural basis of the SENP6-AR interaction, we performed AlphaFold 3-based structural modeling of the SENP6-AR complex. The predicted model suggested a potential interaction interface involving the N-terminal region of SENP6 and the N-terminal domain (NTD) of AR (Fig. S5A, S5B). In addition, the catalytic residue C1030 of SENP6 was positioned in proximity to AR K386 in the predicted complex, suggesting a possible spatial arrangement compatible with SENP6-mediated deSUMOylation of AR. These structural predictions provide a putative model for SENP6-AR recognition and catalytic positioning; however, the precise interaction domains remain to be experimentally defined by systematic truncation or mutagenesis analysis. Importantly, SENP6-C1030A retained its ability to interact with AR (Fig. S4L), indicating that the catalytic cysteine residue is not required for SENP6-AR binding.
SENP6 regulates AR expression in PCa cells. (A) Western blot analysis of SENP6 protein expression in LNCaP cells cultured under androgen deprivation therapy (ADT) conditions or treated with 1 nM dihydrotestosterone (DHT) for 24 h. (B) Relative SENP6 mRNA expression measured by qPCR in LNCaP cells following ADT or 1 nM DHT treatment for 24 h. (C) Representative immunofluorescence images of LNCaP cells transfected with HA-SENP6-WT or HA-SENP6-C1030A and stained for HA (red) and AR (green). Nuclei were counterstained with DAPI (blue). (scale bar: 5μm). (D) Quantification of the intensity of SENP6 signals co-localized with AR signals. (E) Co-immunoprecipitation assay detect the interaction between AR and SENP6. (F) and (G) LNCaP cells were transfected with siSENP6 for 72 h. Then, the cells were harvested for western blot. (H) Representative immunofluorescence images of LNCaP cells transfected with siSENP6 for 72h and stained for SUMO (red) and AR (green). Nuclei were counterstained with DAPI (blue). (scale bar: 5μm). (I) and (J) Quantification of AR signal count and SUMO/AR colocalization foci between SUMO and AR signals. (K) Western Blot analysis of SENP6 and AR protein expression in LNCaP cells transfected with siSENP6 followed by re-expression of siRNA-resistant SENP6-WT or the catalytically inactive mutant SENP6-C1030A at physiological levels. (L) SUMOylation of AR in LNCaP cells transfected with HA-SUMO-2 under the same conditions. Proteins covalently bound to HA-SUMO-2 were purified under denaturing conditions using HA-resin. The presence of the indicated proteins was evaluated by immunoblotting. *P < 0.05, ** P < 0.01, *** P < 0.001, **** P < 0.0001.
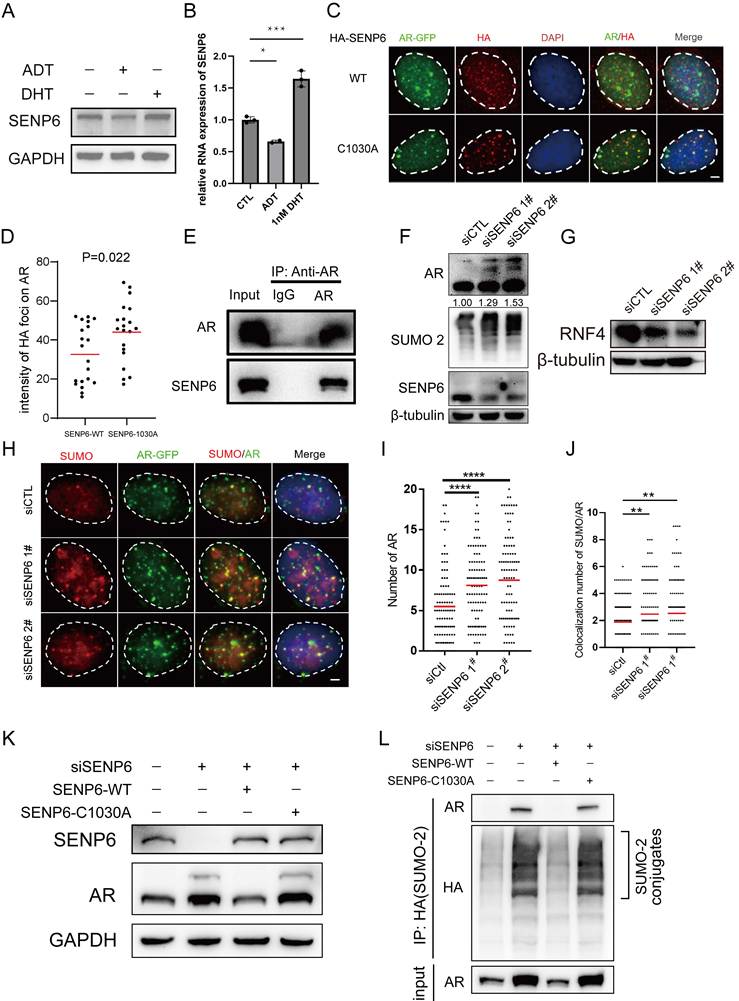
Given that AR undergoes multiple post-translational modifications and SUMOylation plays a critical regulatory role in AR function[38, 39], and based on the observation that SENP6 suppresses PCa cell growth in vitro and in vivo, we next examined the impact of SENP6 loss on AR modification. SENP6 depletion modestly increased total AR protein abundance and resulted in the appearance of higher-molecular-weight AR species, consistent with increased AR post-translational modification (Fig. 7F). Consistently, global SUMOylation levels were elevated after SENP6 knockdown (Fig. 7F). RNF4, a SUMO-targeted ubiquitin ligase (STUbL), recognizes poly-SUMO substrates via SUMO-SIM interactions and promotes their ubiquitination-mediated degradation[40]. In parallel, RNF4 protein levels were reduced after SENP6 knockdown (Fig. 7G), indicating that SENP6 depletion is accompanied by broader alterations in SUMO-related protein regulation. Because SENP6 predominantly localizes to the nucleoplasm and specifically removes poly-SUMO2/3 chains from modified substrates[16, 17, 41], we hypothesized that SENP6 directly binds SUMOylated AR and removes SUMO modifications to prevent AR hyper-polymerization. Immunofluorescence staining for AR and SUMO2/3 after SENP6 knockdown showed markedly increased foci number and intensity (Fig. 7H-7J), indicating that loss of SENP6 promotes SUMO2/3 accumulation and enhances AR clustering.
To further validate the regulatory role of SENP6 in AR SUMOylation, we reconstituted SENP6 expression in SENP6-depleted cells using siRNA-resistant SENP6-WT or the de-SUMOylation-deficient SENP6-C1030A. Re-expression of SENP6-WT reduced the protein levels of both full-length AR and its higher-molecular-weight species, whereas SENP6-C1030A failed to produce comparable effects (Fig. 7K), indicating that the deSUMOylase activity of SENP6 is required for the regulation of AR SUMOylation. To directly assess AR SUMOylation, cells were transfected with HA-tagged SUMO-2, and HA-SUMO-2-conjugated proteins were purified under denaturing conditions followed by immunoblotting for AR. AR was detected among the HA-SUMO-2-conjugated proteins, and AR SUMOylation increased following SENP6 depletion. Re-expression of SENP6-WT reduced AR SUMOylation, whereas SENP6-C1030A failed to reverse the increased SUMOylation (Fig. 7L). Taken together, these results indicate that SENP6 functions as a critical regulator of AR SUMOylation.
SENP6 suppresses AR signaling and prostate cancer growth in vitro and in vivo
Overexpression of SENP6 led to a marked reduction in AR protein levels in LNCaP cells (Fig. 8A, 8B) and significantly suppressed cell proliferation, as demonstrated by colony formation assays (Fig. 8C-8E). Invasion assays further showed that SENP6 overexpression inhibited the invasive capacity of both LNCaP and 22Rv1 cells (Fig. 8F-8H). Moreover, SENP6 overexpression substantially decreased the expression of AR downstream targets, including TMPRSS2, KLK3, and NKX3-1, and this suppressive effect became even more pronounced following DHT stimulation (Fig. 8I-8K). Conversely, SENP6 depletion increased the expression of these AR target genes to varying degrees compared with the siCTL group (Fig. S4M-S4O), further supporting the regulatory effect of SENP6 on AR transcriptional activity.
SENP6 suppresses PCa cell proliferation in vitro and in vivo. (A), (B) LNCaP cells were transfected with the indicated plasmids. Then the expression of HA-SENP6 and AR was measured by Western blot. (C), (D) and (E) LNCaP and 22Rv1 cells were transfected with the indicated plasmids. Then, the cells were used for colony formation assays. The quantitative data are shown in (D, E). (F), (G) and (H) LNCaP and 22Rv1 cells were transfected with the indicated plasmids. Then, the cells were used for Transwell assays (F), and the quantitative data are shown (G, H). (I), (J) and (K) LNCaP cells were transfected with the indicated plasmids. Then, the cells were harvested for qRT‒PCR analyses. (L) Schematic illustration of the in vivo experimental design. (M) The photograph of the xenografts. (N) H&E and IHC staining for SENP6, AR and Ki67were performed. Representative images were taken from each group. Scale bars = 50 μm. (O) Ki67 positive cells in the tissue sections from (N) were quantified. The number of positive cells from at least five fields was counted and analyzed. (P) and (Q) The tumor weight and tumor volume curve were measured and analyzed. *P < 0.05, ** P < 0.01, *** P < 0.001, **** P < 0.0001
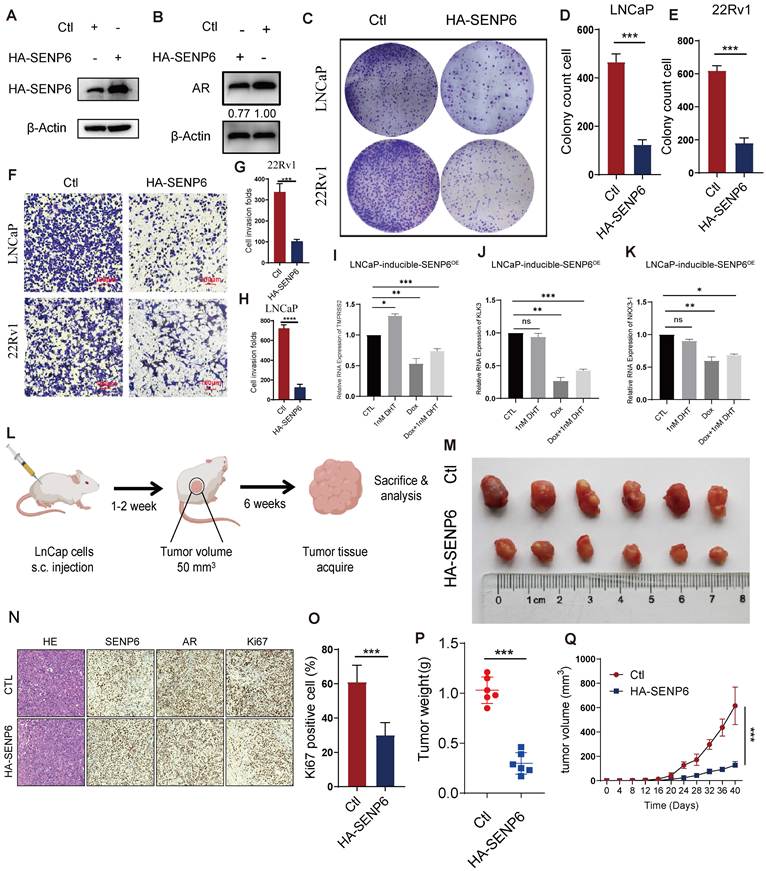
To further validate the function of SENP6 in vivo, LNCaP cells stably expressing HA-SENP6 were injected subcutaneously into the right flank of castrated male NOD/SCID mice, and tumors were allowed to establish until reaching approximately 50 mm³ (Fig. 8L). SENP6-overexpressing tumors exhibited reduced tumor growth compared with control tumors (Fig. 8M, 8P and 8Q). IHC analysis of the xenograft tumors showed increased SENP6 expression, reduced AR staining, and a lower proportion of Ki-67-positive tumor cells in the SENP6-overexpressing group (Fig. 8N-8O). Together, these findings demonstrate that SENP6 suppresses prostate cancer cell proliferation in vitro and tumor growth in vivo and is associated with reduced AR expression and transcriptional activity.
Discussion
Androgen deprivation therapy (ADT) remains the backbone of treatment for advanced prostate cancer, yet castration-resistant prostate cancer (CRPC) is increasingly recognized as a biologically heterogeneous rather than uniform endpoint. Recent molecular classifications have separated CRPC into AR-dependent, neuroendocrine, WNT-dependent, and stem cell-like states, indicating that therapeutic escape can be achieved through distinct transcriptional programs[42]. This concept is consistent with earlier studies showing that modest increases in AR abundance can amplify responses to residual androgen and promote antiandrogen resistance, whereas TP53/RB1 loss can instead drive lineage plasticity and transition toward AR-indifferent states[43-45]. Our data fit this broader framework and suggest that progression toward mCRPC may follow branching evolutionary routes rather than a single linear trajectory. One route may preserve AR dependence while changing the conditions under which AR remains transcriptionally productive, whereas another may progressively abandon canonical AR signaling through lineage reprogramming. Such a model may explain why advanced tumors with similar clinical resistance to hormonal therapy retain markedly different degrees of AR activity.
The ARPC3 population is particularly informative in this regard. Its presence in localized prostate cancer and marked enrichment in mCRPC resemble the pre-existing CRPC-like populations described by Cheng et al., who identified a small fraction of highly plastic CRPC-like cells in hormone-naïve primary tumors and linked them to subsequent resistance and disease progression [11]. However, our cross-sectional data do not demonstrate that ARPC3 is intrinsically resistant. A more plausible interpretation is that ARPC3 represents a pre-existing AR-adaptable state that gains a relative fitness advantage when androgen availability becomes limiting. This view is compatible with classical observations that increased AR abundance can make low residual androgen sufficient to maintain transcriptional output[43], as well as with the emergence of AR-V7 during castration resistance[46]. Thus, AR-driven resistance may involve quantitative amplification, altered ligand dependence, or reorganization of AR-associated transcription rather than simple persistence of an unchanged luminal program. The key biological question is therefore not only whether ARPC3 survives ADT, but which molecular features allow it to convert weak androgenic input into a productive growth signal.
The NEPC-associated states observed in localized disease may represent a different route of adaptation. Genetic and epigenetic studies have established that TP53/RB1 loss, SOX2 activation, and chromatin reprogramming can promote lineage plasticity and antiandrogen resistance[44, 45]. Beltran et al. further showed that CRPC adenocarcinoma and CRPC-NE can arise through divergent clonal evolution from a common ancestor[47], while prospective clinical studies have demonstrated the emergence of treatment-related small-cell/neuroendocrine differentiation in a subset of heavily treated mCRPC[48]. At the same time, treatment-naïve primary tumors with small-cell/neuroendocrine-like transcriptional features have been reported[12], and pre-existing neuroendocrine-like populations have been detected by single-cell analysis[11]. These observations suggest that “neuroendocrine priming” and “neuroendocrine commitment” may represent distinct biological states. A localized adenocarcinoma cell could partially activate an ASCL1/FOXA2-associated program without fulfilling the histological criteria for bona fide NEPC, while subsequent treatment pressure and genomic or epigenetic alterations may stabilize that program and promote full lineage conversion. This interpretation reconciles the detection of rare NEPC-associated transcriptional states in our single-cell data with the absence of clearly SYP-, FOXA2-, or ASCL1-positive tumor cells in our limited LPC IHC cohort.
The spatial association between ARPC3 and CAFs further suggests that resistance is not exclusively cell autonomous. Prostate CAFs can modulate hormonal adaptation through mechanisms that are more specific than simple extracellular-matrix accumulation. Cui et al. showed that CAF-secreted glucosamine increases epithelial HSD3B1 expression, enhances intratumoral androgen synthesis, and restores AR activation under castrate conditions[49]. Other studies have implicated CD105-dependent stromal-epithelial signaling in neuroendocrine differentiation and AR-pathway adaptation [50, 51]. CAFs can also cooperate with M2 macrophages; reciprocal signaling between these populations has been shown to promote fibroblast activation, macrophage polarization, and malignant behavior in prostate cancer[52]. Together, these studies support a more biologically plausible interpretation of our spatial findings than a physical drug-barrier model. We propose that the CAF-rich regions surrounding ARPC3 constitute an AR-supportive niche in which metabolites, steroid precursors, cytokines, and matrix-derived cues lower the threshold of androgenic signaling required for tumor-cell persistence. The concurrent enrichment of M2 macrophages may therefore reflect coordinated ecological remodeling rather than an independent immune event.
The SUMOylation results provide a potential intracellular counterpart to this stromal adaptation. AR SUMOylation has often been described as transcriptionally repressive: PIAS-mediated SUMO1 modification can suppress AR-dependent transcription, whereas SENP1- or SENP2-mediated deSUMOylation can enhance selected AR programs[53, 54]. However, genome-wide studies have shown that SUMOylation is not a simple binary “off” switch. AR SUMOylation can alter target-gene selection and chromatin occupancy in a pathway-selective manner[55], and recent chromatin-proteomic work demonstrated extensive overlap between the SUMO2/3 network and AR-associated transcriptional complexes[38]. Earlier studies also suggested that SUMO2/3 can enhance endogenous AR activity in some prostate cancer contexts[56]. These findings indicate that the biological consequence of AR SUMOylation depends on SUMO paralogue identity, chain topology, chromatin context, and the composition of the modified protein complex. This framework helps explain why SENP6 depletion in our study increased SUMO2/3-modified AR while also enhancing AR-associated transcriptional output.
The distinction between SENP1 and SENP6 is particularly informative. Androgen-activated AR induces SENP1, and SENP1 can enhance AR-dependent transcription by removing SUMO1 from AR or associated regulators[54, 57]. SENP6, in contrast, belongs to a distinct SENP subclass with a strong preference for editing poly-SUMO2/3 chains[17]. Our rescue experiments showed that catalytically inactive SENP6-C1030A retained AR binding but failed to reverse the increase in AR SUMOylation caused by SENP6 depletion, indicating that the regulatory effect of SENP6 depends on deSUMOylase activity rather than simply on physical interaction. We therefore propose that different SENPs occupy distinct positions within an “AR-SUMO code.” SENP1 may facilitate selected androgen-responsive programs through SUMO1 deconjugation, whereas SENP6 may restrain the accumulation of poly-SUMO2/3-modified AR complexes. In this model, the direction of AR regulation cannot be predicted by the generic terms “SUMOylation” or “deSUMOylation”; instead, it depends on which SUMO species is present, whether polymeric chains form, and which SENP edits that modification.
The androgen responsiveness of SENP6 suggests an additional regulatory layer. Previous work established an AR-SENP1 positive-feedback relationship, in which androgen-activated AR induces SENP1 and SENP1 can further enhance AR transcription[54, 57]. Our data suggest that SENP6 may constitute a contrasting androgen-induced negative-feedback arm: DHT increases SENP6 expression, ADT decreases it, and SENP6 restrains AR SUMO2/3 accumulation and AR target-gene expression. Under androgen-replete conditions, AR activation may therefore induce SENP6 to limit excessive poly-SUMO2/3 modification of AR-associated complexes. ADT would suppress the initiating androgen signal but simultaneously reduce this feedback restraint. In surviving cells, lower SENP6 could permit a different SUMO2/3 state of AR and thereby alter the efficiency or selectivity of residual AR transcription. This model offers one possible explanation for the otherwise counterintuitive persistence of AR output despite reduced androgen availability. It remains a working model, however, because our experiments do not yet establish how SENP6 loss changes the AR cistrome. AR ChIP-seq, CUT&RUN, or AR-centered proteomics after SENP6 perturbation will be required to determine whether altered SUMO2/3 changes AR genomic occupancy or cofactor recruitment.
In summary, our findings support a model in which castration resistance develops through divergent but potentially coexisting evolutionary strategies. Some tumor cells may reduce their dependence on AR through lineage plasticity, whereas others may preserve AR signaling by exploiting pre-existing epithelial states, stromal support, and altered post-translational regulation. Within the latter route, SENP6 may function as an androgen-responsive negative-feedback regulator of poly-SUMO2/3-dependent AR signaling. Loss of this restraint during androgen deprivation, together with an AR-supportive stromal niche, may facilitate persistence of AR-driven tumor cells under therapeutic pressure. This framework shifts the interpretation of mCRPC from a uniform androgen-independent endpoint toward an ecosystem of distinct resistance states that may require different therapeutic strategies.
Supplementary Material
Supplementary methods and figures.

Supplementary tables.
Acknowledgements
In this study, results shown here are based on data publicly available at the TCGA, GEO, HPA, CPGEA and 10x Genomics database. We thank all patients and all investigators who participated in above dataset for supplying data.
Funding
This study was supported by National Natural Science Foundation of China (NO. 82472857).
CRediT authorship contribution statement
Xin'an Wang: Conceptualization, Data curation, Validation, Writing - original draft. Chang Lu: Conceptualization, Data curation, Validation, Visualization. Hanchu Ye: Conceptualization, Data curation, Software, Supervision, Writing - original draft. Chengdang Xu: Data curation, Formal analysis, Software. Wei Wu: Conceptualization, Investigation. Yicong Yao: Software, Visualization. Wei Jiang: Conceptualization, Data curation, Validation. Qiang Wu: Funding acquisition, Supervision, Writing - review & editing. Denglong Wu: Funding acquisition, Supervision, Writing - review & editing. Licheng Wang: Conceptualization, Funding acquisition, Supervision, Visualization, Writing - review & editing.
Availability of data and material
In this study, data were generated by TCGA, GEO, HPA, CPGEA and 10x Genomics database with the cancer type of prostate cancer. Derived data supporting the findings are available from the corresponding author on reasonable request.
Ethics approval and consent to participate
Human PCa specimens and patient clinical data were obtained from the Tongji Hospital, with the approval of the Tongji Hospital Research Ethics Committee. All mouse experiments were approved by the Institutional Animal Care and Use Committee of the Tongji hospital.
Declaration of generative AI and AI-assisted technologies in the manuscript preparation process
During the preparation of this work the authors used ChatGPT to improve the clarity and fluency of the language. After using this tool, the authors reviewed and edited the content as needed and take full responsibility for the content of the published article.
Competing Interests
The authors have declared that no competing interest exists.
References
1. Sandhu S, Moore CM, Chiong E. Prostate cancer. Lancet. 2021;398:1075-90
2. Sung H, Ferlay J, Siegel RL, Laversanne M, Soerjomataram I, Jemal A. et al. Global Cancer Statistics 2020: GLOBOCAN Estimates of Incidence and Mortality Worldwide for 36 Cancers in 185 Countries. CA Cancer J Clin. 2021;71:209-49
3. Sartor O, de Bono JS. Metastatic Prostate Cancer. The New England journal of medicine. 2018;378:645-57
4. Perez-Romero K, Rodriguez RM, Amedei A, Barcelo-Coblijn G, Lopez DH. Immune Landscape in Tumor Microenvironment: Implications for Biomarker Development and Immunotherapy. International journal of molecular sciences. 2020 21
5. Li J, Xu C, Lee HJ, Ren S, Zi X, Zhang Z. et al. A genomic and epigenomic atlas of prostate cancer in Asian populations. Nature. 2020;580:93-9
6. da Silva-Diz V, Lorenzo-Sanz L, Bernat-Peguera A, Lopez-Cerda M, Muñoz P. Cancer cell plasticity: Impact on tumor progression and therapy response. Seminars in Cancer Biology. 2018;53:48-58
7. Alabi BR, Liu S, Stoyanova T. Current and emerging therapies for neuroendocrine prostate cancer. Pharmacol Ther. 2022;238:108255
8. Yamada Y, Beltran H. Clinical and Biological Features of Neuroendocrine Prostate Cancer. Curr Oncol Rep. 2021;23:15
9. Conteduca V, Oromendia C, Eng KW, Bareja R, Sigouros M, Molina A. et al. Clinical features of neuroendocrine prostate cancer. Eur J Cancer. 2019;121:7-18
10. Song H, Weinstein HNW, Allegakoen P, Wadsworth MH 2nd, Xie J, Yang H. et al. Single-cell analysis of human primary prostate cancer reveals the heterogeneity of tumor-associated epithelial cell states. Nature communications. 2022;13:141
11. Cheng Q, Butler W, Zhou Y, Zhang H, Tang L, Perkinson K. et al. Pre-existing Castration-resistant Prostate Cancer-like Cells in Primary Prostate Cancer Promote Resistance to Hormonal Therapy. Eur Urol. 2022;81:446-55
12. Alshalalfa M, Liu Y, Wyatt AW, Gibb EA, Tsai HK, Erho N. et al. Characterization of transcriptomic signature of primary prostate cancer analogous to prostatic small cell neuroendocrine carcinoma. Int J Cancer. 2019;145:3453-61
13. Xia Z, De Wever O. The plasticity of cancer-associated fibroblasts. Trends Cancer. 2025;11:770-89
14. Jia H, Chen X, Zhang L, Chen M. Cancer associated fibroblasts in cancer development and therapy. J Hematol Oncol. 2025;18:36
15. Wang Y, Yu J. Dissecting multiple roles of SUMOylation in prostate cancer. Cancer Lett. 2021;521:88-97
16. Nayak A, Muller S. SUMO-specific proteases/isopeptidases: SENPs and beyond. Genome Biol. 2014;15:422
17. Lima CD, Reverter D. Structure of the human SENP7 catalytic domain and poly-SUMO deconjugation activities for SENP6 and SENP7. J Biol Chem. 2008;283:32045-55
18. Schick M, Zhang L, Maurer S, Maurer HC, Isaakaidis K, Schneider L. et al. Genetic alterations of the SUMO isopeptidase SENP6 drive lymphomagenesis and genetic instability in diffuse large B-cell lymphoma. Nature communications. 2022;13:281
19. Qian J, Luo Y, Gu X, Wang X. Inhibition of SENP6-induced radiosensitization of human hepatocellular carcinoma cells by blocking radiation-induced NF-kappaB activation. Cancer Biother Radiopharm. 2013;28:196-200
20. Lyu A, Fan Z, Clark M, Lea A, Luong D, Setayesh A. et al. Evolution of myeloid-mediated immunotherapy resistance in prostate cancer. Nature. 2025;637:1207-17
21. Dong B, Miao J, Wang Y, Luo W, Gao WQ. Single-cell analysis supports a luminal-neuroendocrine transdifferentiation in human prostate cancer. Communications Biology. 2020 3
22. Chen S, Zhu G, Yang Y, Wang F, Xiao YT, Zhang N. et al. Single-cell analysis reveals transcriptomic remodellings in distinct cell types that contribute to human prostate cancer progression. Nat Cell Biol. 2021;23:87-98
23. Hirz T, Mei S, Sarkar H, Kfoury Y, Wu S, Verhoeven BM. et al. Dissecting the immune suppressive human prostate tumor microenvironment via integrated single-cell and spatial transcriptomic analyses. Nature communications. 2023;14:663
24. Chan JM, Zaidi S, Love JR, Zhao JL, Setty M, Wadosky KM. et al. Lineage plasticity in prostate cancer depends on JAK/STAT inflammatory signaling. Science. 2022;377:1180-91
25. Kiviaho A, Eerola SK, Kallio HML, Andersen MK, Hoikka M, Tiihonen AM. et al. Single cell and spatial transcriptomics highlight the interaction of club-like cells with immunosuppressive myeloid cells in prostate cancer. Nature communications. 2024;15:9949
26. Jain S, Lyons CA, Walker SM, McQuaid S, Hynes SO, Mitchell DM. et al. Validation of a Metastatic Assay using biopsies to improve risk stratification in patients with prostate cancer treated with radical radiation therapy. Ann Oncol. 2018;29:215-22
27. Varambally S, Yu J, Laxman B, Rhodes DR, Mehra R, Tomlins SA. et al. Integrative genomic and proteomic analysis of prostate cancer reveals signatures of metastatic progression. Cancer Cell. 2005;8:393-406
28. Hao Y, Stuart T, Kowalski MH, Choudhary S, Hoffman P, Hartman A. et al. Dictionary learning for integrative, multimodal and scalable single-cell analysis. Nat Biotechnol. 2024;42:293-304
29. Li R, Ferdinand JR, Loudon KW, Bowyer GS, Laidlaw S, Muyas F. et al. Mapping single-cell transcriptomes in the intra-tumoral and associated territories of kidney cancer. Cancer Cell. 2022;40:1583-99.e10
30. Zhang H, Pan Y, Zheng L, Choe C, Lindgren B, Jensen ED. et al. FOXO1 inhibits Runx2 transcriptional activity and prostate cancer cell migration and invasion. Cancer Res. 2011;71:3257-67
31. Eyunni S, Mannan R, Zhang Y, Young E, Zhang Q, Luo J. et al. Divergent FOXA1 mutations drive prostate tumorigenesis and therapy-resistant cellular plasticity. Science. 2025;389:eadv2367
32. Han M, Li F, Zhang Y, Dai P, He J, Li Y. et al. FOXA2 drives lineage plasticity and KIT pathway activation in neuroendocrine prostate cancer. Cancer Cell. 2022;40:1306-23.e8
33. Kunderfranco P, Mello-Grand M, Cangemi R, Pellini S, Mensah A, Albertini V. et al. ETS transcription factors control transcription of EZH2 and epigenetic silencing of the tumor suppressor gene Nkx3.1 in prostate cancer. PLoS One. 2010;5:e10547
34. Lu S, Tsai SY, Tsai MJ. Regulation of androgen-dependent prostatic cancer cell growth: androgen regulation of CDK2, CDK4, and CKI p16 genes. Cancer Res. 1997;57:4511-6
35. Sramkoski RM, Pretlow TG 2nd, Giaconia JM, Pretlow TP, Schwartz S, Sy MS. et al. A new human prostate carcinoma cell line, 22Rv1. In vitro Cell Dev Biol Anim. 1999;35:403-9
36. Attardi BJ, Burgenson J, Hild SA, Reel JR. Steroid hormonal regulation of growth, prostate specific antigen secretion, and transcription mediated by the mutated androgen receptor in CWR22Rv1 human prostate carcinoma cells. Mol Cell Endocrinol. 2004;222:121-32
37. Malinen M, Niskanen EA, Kaikkonen MU, Palvimo JJ. Crosstalk between androgen and pro-inflammatory signaling remodels androgen receptor and NF-κB cistrome to reprogram the prostate cancer cell transcriptome. Nucleic acids research. 2017;45:619-30
38. Launonen KM, Varis V, Aaltonen N, Niskanen EA, Varjosalo M, Paakinaho V. et al. Central role of SUMOylation in the regulation of chromatin interactions and transcriptional outputs of the androgen receptor in prostate cancer cells. Nucleic acids research. 2024;52:9519-35
39. Poukka H, Karvonen U, Janne OA, Palvimo JJ. Covalent modification of the androgen receptor by small ubiquitin-like modifier 1 (SUMO-1). Proceedings of the National Academy of Sciences of the United States of America. 2000;97:14145-50
40. Rojas-Fernandez A, Plechanovova A, Hattersley N, Jaffray E, Tatham MH, Hay RT. SUMO chain-induced dimerization activates RNF4. Molecular cell. 2014;53:880-92
41. Hattersley N, Shen L, Jaffray EG, Hay RT. The SUMO protease SENP6 is a direct regulator of PML nuclear bodies. Mol Biol Cell. 2011;22:78-90
42. Tang F, Xu D, Wang S, Wong CK, Martinez-Fundichely A, Lee CJ. et al. Chromatin profiles classify castration-resistant prostate cancers suggesting therapeutic targets. Science. 2022;376:eabe1505
43. Chen CD, Welsbie DS, Tran C, Baek SH, Chen R, Vessella R. et al. Molecular determinants of resistance to antiandrogen therapy. Nat Med. 2004;10:33-9
44. Ku SY, Rosario S, Wang Y, Mu P, Seshadri M, Goodrich ZW. et al. Rb1 and Trp53 cooperate to suppress prostate cancer lineage plasticity, metastasis, and antiandrogen resistance. Science. 2017;355:78-83
45. Mu P, Zhang Z, Benelli M, Karthaus WR, Hoover E, Chen CC. et al. SOX2 promotes lineage plasticity and antiandrogen resistance in TP53- and RB1-deficient prostate cancer. Science. 2017;355:84-8
46. Sharp A, Coleman I, Yuan W, Sprenger C, Dolling D, Rodrigues DN. et al. Androgen receptor splice variant-7 expression emerges with castration resistance in prostate cancer. J Clin Invest. 2019;129:192-208
47. Beltran H, Prandi D, Mosquera JM, Benelli M, Puca L, Cyrta J. et al. Divergent clonal evolution of castration-resistant neuroendocrine prostate cancer. Nat Med. 2016;22:298-305
48. Aggarwal R, Huang J, Alumkal JJ, Zhang L, Feng FY, Thomas GV. et al. Clinical and Genomic Characterization of Treatment-Emergent Small-Cell Neuroendocrine Prostate Cancer: A Multi-institutional Prospective Study. J Clin Oncol. 2018;36:2492-503
49. Cui D, Li J, Zhu Z, Berk M, Hardaway A, McManus J. et al. Cancer-associated fibroblast-secreted glucosamine alters the androgen biosynthesis program in prostate cancer via HSD3B1 upregulation. J Clin Invest. 2023 133
50. Kato M, Placencio-Hickok VR, Madhav A, Haldar S, Tripathi M, Billet S. et al. Heterogeneous cancer-associated fibroblast population potentiates neuroendocrine differentiation and castrate resistance in a CD105-dependent manner. Oncogene. 2019;38:716-30
51. Smith BN, Mishra R, Billet S, Placencio-Hickok VR, Kim M, Zhang L. et al. Antagonizing CD105 and androgen receptor to target stromal-epithelial interactions for clinical benefit. Mol Ther. 2023;31:78-89
52. Comito G, Giannoni E, Segura CP, Barcellos-de-Souza P, Raspollini MR, Baroni G. et al. Cancer-associated fibroblasts and M2-polarized macrophages synergize during prostate carcinoma progression. Oncogene. 2014;33:2423-31
53. Nishida T, Yasuda H. PIAS1 and PIASxalpha function as SUMO-E3 ligases toward androgen receptor and repress androgen receptor-dependent transcription. J Biol Chem. 2002;277:41311-7
54. Kaikkonen S, Jääskeläinen T, Karvonen U, Rytinki MM, Makkonen H, Gioeli D. et al. SUMO-specific protease 1 (SENP1) reverses the hormone-augmented SUMOylation of androgen receptor and modulates gene responses in prostate cancer cells. Mol Endocrinol. 2009;23:292-307
55. Sutinen P, Malinen M, Heikkinen S, Palvimo JJ. SUMOylation modulates the transcriptional activity of androgen receptor in a target gene and pathway selective manner. Nucleic acids research. 2014;42:8310-9
56. Zheng Z, Cai C, Omwancha J, Chen SY, Baslan T, Shemshedini L. SUMO-3 enhances androgen receptor transcriptional activity through a sumoylation-independent mechanism in prostate cancer cells. J Biol Chem. 2006;281:4002-12
57. Bawa-Khalfe T, Cheng J, Wang Z, Yeh ET. Induction of the SUMO-specific protease 1 transcription by the androgen receptor in prostate cancer cells. J Biol Chem. 2007;282:37341-9
Author contact
Corresponding author: Licheng Wang, 1911633edu.cn, Denglong Wu, wudenglong2009edu.cn, Qiang Wu, wuqiangedu.cn