Impact Factor ISSN: 1449-2288




Int J Biol Sci 2027; 23(1):376-390. doi:10.7150/ijbs.138648 This issue Cite
Research Paper
PNRC1 drives self-reinforcing activation of p53 in colorectal cancer
Chen Xiong1,2#, Qinghua Zhang1,2#, Tengfei Chao3#, Bangxiang Xie4#, Jing Tong1,2, Yu Gan5, Ruiwen Ruan5, Jun Deng5, Jianchun Chen6, Tao Han7, Xiang Zhou1,2,8,9  , Chunmeng Wang2,10 , Qian Hao1,2,8,9
1. Cancer Institute, Fudan University Shanghai Cancer Center, Shanghai 200032, China
2. Department of Oncology, Shanghai Medical College, Fudan University, Shanghai 200032, China
3. Department of Oncology, Tongji Hospital, Tongji Medical College, Huazhong University of Science and Technology, Wuhan 430030, Hubei, China
4. Beijing Institute of Hepatology, Beijing Youan Hospital, Capital Medical University, Beijing 100069, China
5. The First Affiliated Hospital, Jiangxi Medical College, Nanchang University, Nanchang 330006, Jiangxi, China
6. Department of Neurosurgery, Changhai Hospital, Naval Medical University (Second Military Medical University), Shanghai 200433, China
7. Xinxiang Key laboratory for Molecular Oncology, Institutes of Health Central Plains, Henan Medical University, Xinxiang 453003, China
8. Shanghai Key Laboratory of Radiation Oncology, Department of Radiation Oncology, Fudan University Shanghai Cancer Center, Shanghai 200032, China
9. Key Laboratory of Breast Cancer in Shanghai, Department of Breast Surgery, Fudan University Shanghai Cancer Center, Shanghai 200032, China
10. Department of Musculoskeletal Oncology, Fudan University Shanghai Cancer Center, Shanghai 200032, China
# Equal contribution
Received 2026-6-1; Accepted 2026-8-26; Published 2027-1-1
Abstract
The tumor suppressor p53 is central to maintaining cellular integrity through transcriptional activation of diverse target genes. Aberrations in p53 signaling significantly contribute to colorectal cancer (CRC) progression. A thorough understanding of p53 regulation is crucial for deciphering its tumor-suppressive mechanisms. Here, we identify proline-rich nuclear receptor coactivator 1 (PNRC1) as a direct transcriptional target of p53. Upon activation by p53, PNRC1 interacts with the N-terminal domain of p53 and competitively displaces MDM2. This interaction stabilizes p53 by blocking MDM2-mediated ubiquitination and subsequent degradation. Overexpression of PNRC1 inhibits, whereas its depletion promotes, CRC cell proliferation, colony formation, and migration in a p53-dependent manner. Consistently, PNRC1 is underexpressed in tumors compared to normal tissues, and its reduced expression correlates with poor patient prognosis. Furthermore, Pnrc1-deficient mice exhibit reduced p53 expression in colorectal tissues and display increased tumorigenesis in the AOM/DSS-induced inflammation-driven CRC model. Collectively, our findings establish PNRC1 as a critical positive regulator of p53 and provide novel mechanistic insights into CRC carcinogenesis.
Keywords: p53, PNRC1, feedback loop, carcinogenesis, colorectal cancer
Introduction
Colorectal cancer (CRC) is one of the most prevalent malignancies worldwide, associated with high incidence and mortality rates. According to the Global Cancer Statistics published by the International Agency for Research on Cancer (IARC) in 2022 [1], CRC ranks third in terms of new cancer diagnoses and second in cancer-related deaths, accounting for approximately 1.93 million new cases and 900,000 deaths annually, thereby representing a significant threat to global health. Despite substantial advancements in multidisciplinary treatments including surgery, radiotherapy, chemotherapy, and targeted therapy, the long-term survival of CRC patients remains unsatisfactory, partially due to treatment resistance and cancer relapse arising from p53 pathway inactivation [2-4].
The tumor suppressor p53 is a crucial transcription factor that plays a central role in tumor suppression by regulating various target genes involved in DNA damage repair [5, 6], cell cycle arrest [7], cell death [8-10], and metabolic rewiring [11, 12]. Mutations or functional loss of p53 are widespread across multiple cancer types [13] and represent one of the principal characteristics of tumorigenesis [14, 15]. In CRC, aberrations in the p53 pathway are particularly prevalent and have profound clinical and research significance [16, 17]. Recent studies have expanded the p53-regulated gene network and highlighted its crucial role in CRC [18-22]. Therefore, elucidating the regulatory mechanisms controlling p53 activity is critical for deciphering the molecular pathogenesis of CRC.
With the rapid development of high-throughput sequencing technologies and bioinformatics analysis, numerous novel p53 transcriptional target genes have been identified, extending the complexity of the p53 regulatory network significantly [20-24]. In a screening for p53-responsive genes using RNA sequencing, we identified proline-rich nuclear receptor coactivator 1 (PNRC1) as a markedly upregulated gene in response to 5-fluorouracil (5-FU)-induced DNA damage stress, drawing our attention to its potential significance in CRC development. PNRC1 was initially characterized as a nuclear receptor (NR) coactivator, capable of interacting with multiple NRs to transactivate exogenous NR-responsive reporter genes in a ligand-dependent manner [25]. Subsequently, PNRC1 was shown to negatively regulate cytoplasmic RAS signaling pathways [26]. Further investigation revealed that PNRC1 localizes to the nucleolus and interacts with nucleolar protein NPM1 [27], and is involved in ribosomal RNA (rRNA) maturation [28]. These findings suggest that PNRC1 may play a potentially critical role in cellular growth and tumor progression, although its specific biological functions and underlying mechanisms, particularly in CRC, remain unclear.
In this study, we demonstrate that PNRC1 is a transcriptional target gene of p53. Subsequent database analyses revealed that PNRC1 expression is downregulated in CRC tissues, which correlates with a poor prognosis. Mechanistic investigation further showed that PNRC1 interacts with the N-terminal domain of p53 and disrupts MDM2 binding, thereby protecting p53 from MDM2-mediated ubiquitination and degradation. Consistently, overexpression of PNRC1 suppresses, while its depletion promotes, the growth of CRC cells in vitro and in xenograft tumor models. Notably, Pnrc1-knockout (Pnrc1-KO) mice exhibit reduced p53 expression in colorectal tissues and develop an increased tumor burden in the AOM/DSS-induced inflammation-driven CRC model. Collectively, our study reveals that PNRC1 activates the p53 signaling pathway via a positive feedback mechanism, providing novel insights into p53 regulation and CRC carcinogenesis.
Results
p53 transcriptionally activates PNRC1 expression
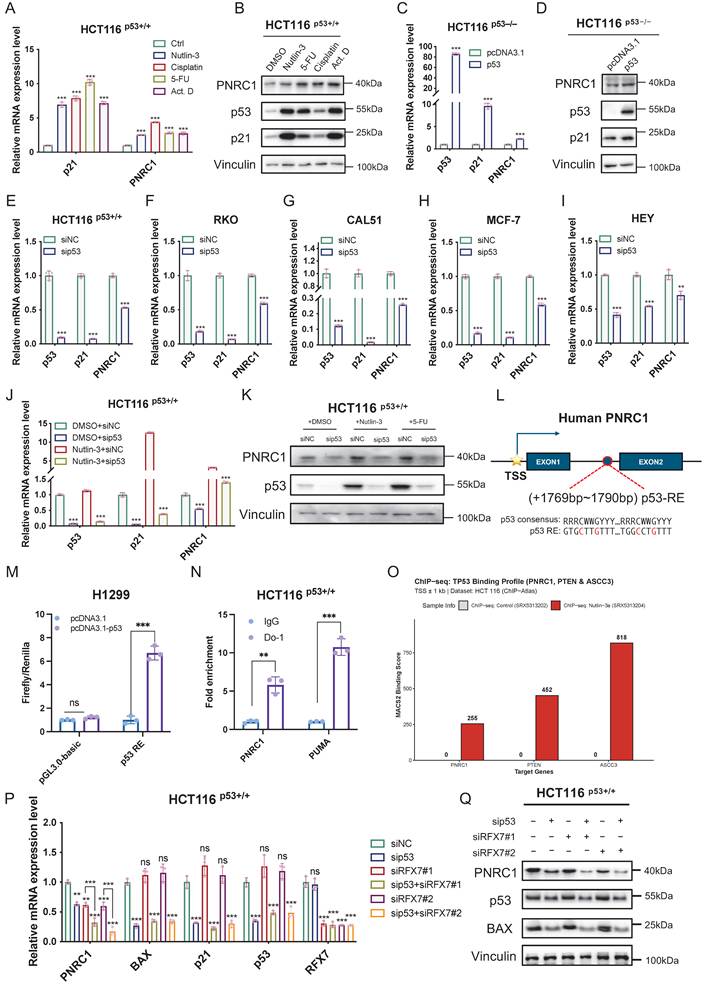
To determine the key molecules in response to p53 activation, we performed RNA-sequencing analysis of HCT116 p53+/+ cells either untreated or treated with the genotoxic agent 5-fluorouracil (5-FU). The result indicated that PNRC1 is one of the potential p53-responsive genes (Figures S1A-S1B). To further validate this result, we treated cells with the p53-inducing agents including Nutlin-3, 5-FU, cisplatin and actinomycin D (Act. D). Following the treatment of HCT116 p53+/+ cells with these agents, we observed a significant increase in PNRC1 mRNA and protein levels (Figures 1A-1B). However, there were no obvious changes under the treatments in p53-null HCT116 p53-/- and H1299 cells (Figures S1C-S1F). Moreover, PNRC1 expression at both the mRNA and protein levels was induced by the ectopic expression of p53 in cancer cells (Figures 1C-1D, S1G-S1H) but was reduced by the knockdown of p53 in HCT116 p53+/+, RKO, CAL51, MCF-7, and HEY cells (Figures 1E-1I). Furthermore, ablation of p53 dramatically prevented 5-FU- or Nutlin-3-induced upregulation of PNRC1 mRNA and protein levels (Figures 1J-1K). By searching the 5' flanking sequence of PNRC1 for potential p53-responsive elements (p53-RE) using the p53MH algorithm [29], we identified a conserved intronic p53-RE at +1769 bp after the transcription start site (TSS) (Figure 1L). As expected, overexpression of p53 drastically induced the luciferase activity driven by the p53 RE (Figure 1M). In addition, chromatin immunoprecipitation (ChIP) assays revealed that p53 binds to this regulatory intronic region (Figure 1N). Consistently, p53 occupancy at the proximal promoter region of PNRC1 was further confirmed with HCT116 p53+/+ ChIP-seq datasets (Figure 1O). MACS2 binding scores represent the enrichment levels in the DMSO control (SRX5313202) and the Nutlin-3 treatment group (SRX5313204). PNRC1 was analyzed alongside PTEN, a recognized p53 target [30], and ASCC3, which was verified as a target gene in our lab [21]. However, depletion of p53 did not completely abolish PNRC1 expression, suggesting that additional transcriptional regulators may contribute to PNRC1 regulation. Since RFX7 has been reported as a component of the p53-dependent tumor suppressor network [31], we examined whether RFX7 also regulates PNRC1 expression. Knockdown of either p53 or RFX7 reduced PNRC1 expression, while combined depletion further decreased PNRC1 levels (Figures 1P-1Q), suggesting that p53 and RFX7 cooperatively regulate PNRC1 transcription. These findings collectively demonstrate that PNRC1 is a bona fide transcriptional target gene of p53 in different human cancer cells, including CRC cells.
p53 transcriptionally activates PNRC1 expression. (A, B) p53-inducing agents upregulate both mRNA and protein levels of PNRC1. RT-qPCR (A) and immunoblotting (IB) (B) were performed to assess PNRC1 expression in HCT116 p53+/+ cells treated with or without Nutlin-3, cisplatin, 5-fluorouracil (5-FU), and actinomycin D (Act. D) for 16 h. (C, D) Ectopic p53 upregulates both mRNA and protein levels of PNRC1. RT-qPCR (C) and IB (D) were performed to assess PNRC1 expression in HCT116 p53-/- cells transfected with plasmids as indicated. (E-I) Knockdown of p53 downregulates PNRC1 mRNA levels. HCT116 p53+/+ (E), RKO (F), CAL-51 (G), MCF-7 (H) and HEY (I) cells were transfected with control or p53 siRNA for 48 h and harvested for RT-qPCR. (J, K) Knockdown of p53 impairs Nutlin-3- and 5-FU-induced PNRC1 expression in HCT116 p53+/+ cells. Cells were transfected with control or p53 siRNA and treated with or without the indicated agents for 18 h before harvesting for RT-qPCR (J) and IB (K). (L) Schematic shows the potential p53-responsive element (p53-RE) in the first intronic region of the PNRC1 gene. (M) p53 induces the expression of the luciferase reporter gene driven by the intronic p53-RE of PNRC1. (N) p53 associates with the intronic region harboring the p53-RE of the PNRC1 gene by the ChIP assay. PUMA serves as a positive control. RT-qPCR were performed to detect the bound DNA elements. (O) p53 occupancy at the proximal promoter region of PNRC1 was confirmed with HCT116 p53+/+ ChIP-seq datasets. PTEN and ASCC3 serve as positive controls. (P, Q) RFX7 contributes to PNRC1 transcriptional regulation together with p53. HCT116 p53+/+ cells were transfected with control siRNA, p53 siRNA, RFX7 siRNAs, or combined p53 and RFX7 siRNAs as indicated. The mRNA expression levels of the indicated genes were analyzed by RT-qPCR (P). The protein expression levels of PNRC1, p53, and BAX were examined by IB (Q). Data are represented as mean ± standard deviation (SD), n = 3 biological replicates. p values were calculated by two-tailed paired t test. ** p < 0.01, *** p < 0.001, ns, not significant. See also Figure S1.
PNRC1 is underexpressed in colorectal cancer
We then searched the TIMER database to investigate the correlation between PNRC1 expression and human cancers. The results showed that the levels of PNRC1 are significantly reduced in various types of cancers (cancer vs. normal), including CRC (Figure S1I). In addition, we analyzed mRNA expression of PNRC1 using the UALCAN database. Compared with normal tissues, PNRC1 expression is significantly reduced in colon adenocarcinoma (COAD) and rectal adenocarcinoma (READ) tissues (Figure S1J). The same results have also been observed in other types of cancer, including breast cancer, lung adenocarcinoma, stomach adenocarcinoma, pancreatic adenocarcinoma, hepatocellular carcinoma, and cervical squamous cell carcinoma (Figure S1J). Furthermore, we searched the HPA database to explore the protein expression of PNRC1 in CRC. The results showed that PNRC1 staining is stronger in normal colon tissues (Figure S1K, Patient ID: 2690) than in the majority of CRC tissues (Figure S1K, Patient ID: 1454, 1958, 2117, 2616, 2735, 3041, and 3062), indicating that PNRC1 is underexpressed in CRC. The Kaplan‒Meier Plotter analysis showed that low PNRC1 expression was associated with poor overall survival in multiple cancer types, including CRC, although statistical significance in CRC requires validation with a larger cohort (Figure S1L). Overall, these results indicate that PNRC1 is a prognostic marker and may exert tumor-suppressive functions in CRC.
PNRC1 activates the p53 signaling pathway
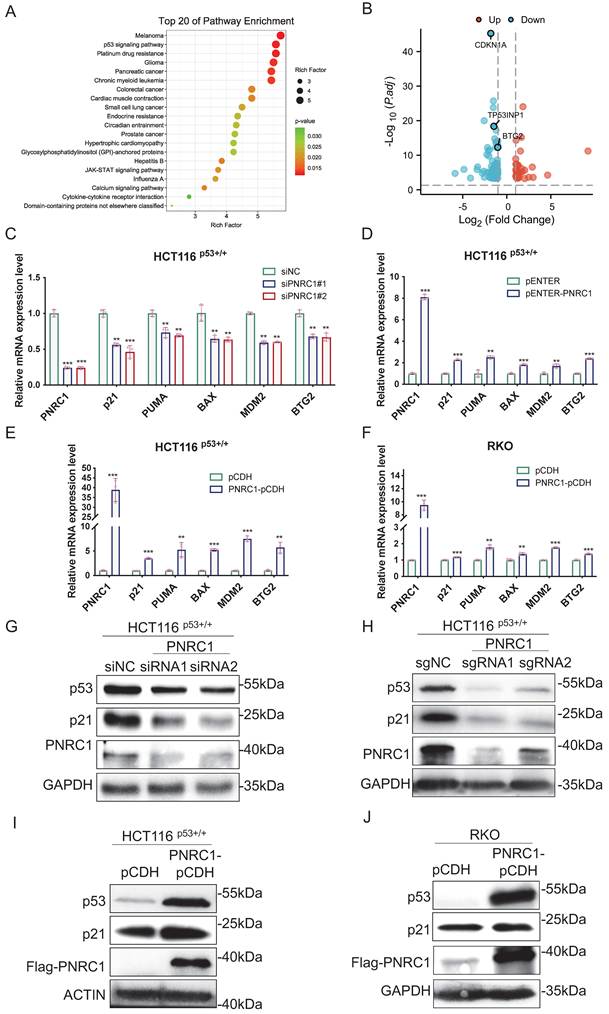
To investigate the potential functions of PNRC1 in CRC, we conducted RNA sequencing analysis of HCT116 p53+/+ cells with or without PNRC1 knockdown. KEGG pathway analysis showed that differentially expressed genes were significantly associated with the p53 signaling pathway (Figure 2A). Particularly, several known p53 target genes, such as CDKN1A (also known as p21), TP53INP1, and BTG2, are significantly downregulated in PNRC1-depleted cells (Figure 2B), suggesting that PNRC1 may play a critical role in regulating p53 activity. In addition, qPCR validation confirmed that PNRC1 knockdown significantly reduces the mRNA levels of p53 target genes including CDKN1A, PUMA, BAX, MDM2, and BTG2 (Figure 2C), whereas transient or stable overexpression of PNRC1 increases these transcripts in both HCT116 p53+/+ and RKO cells (Figures 2D-2F). Consistently, ablation of PNRC1 via siRNA knockdown or CRISPR-Cas9 knockout dramatically reduced the protein levels of p53 and p21 (Figures 2G-2H), while overexpression of PNRC1 elevates these protein levels (Figures 2I-2J) in CRC cells. Together, these results indicate that PNRC1 functions as a positive feedback regulator of the p53 pathway in CRC.
PNRC1 activates the p53 signaling pathway. (A) KEGG pathway analysis of RNA-seq data shows that differentially expressed genes after PNRC1 knockdown are significantly associated with the p53 signaling pathway in HCT116 p53+/+ cells. (B) Volcano plot analysis reveals the downregulation of p53 target genes in PNRC1-depleted HCT116 p53+/+ cells compared to controls. (C) Knockdown of PNRC1 downregulates the mRNA levels of p53 target genes. HCT116 p53+/+ cells were transfected with control or PNRC1 siRNAs for 48 h and harvested for RT-qPCR. (D-F) Overexpression of PNRC1 upregulates the mRNA levels of p53 target genes. HCT116 p53+/+ (D, E) and RKO (F) cells were transiently transfected with pENTER-PNRC1 or stably transfected with pCDH-PNRC1 and harvested for RT-qPCR. (G) Knockdown of PNRC1 downregulates the protein levels of p53 and p21. HCT116 p53+/+ cells were transfected with control or PNRC1 siRNA for 48 h and harvested for IB. (H) Knockout of PNRC1 via CRISPR-Cas9 downregulates the protein levels of p53 and p21 in HCT116 p53+/+ cells. (I, J) Stable overexpression of PNRC1 in HCT116 p53+/+ (I) and RKO (J) cells upregulates the protein levels of p53 and p21. Data are represented as mean ± standard deviation (SD), n = 3 biological replicates. p values were calculated by two-tailed paired t test. ** p < 0.01, *** p < 0.001, ns, not significant.
PNRC1 interacts with p53
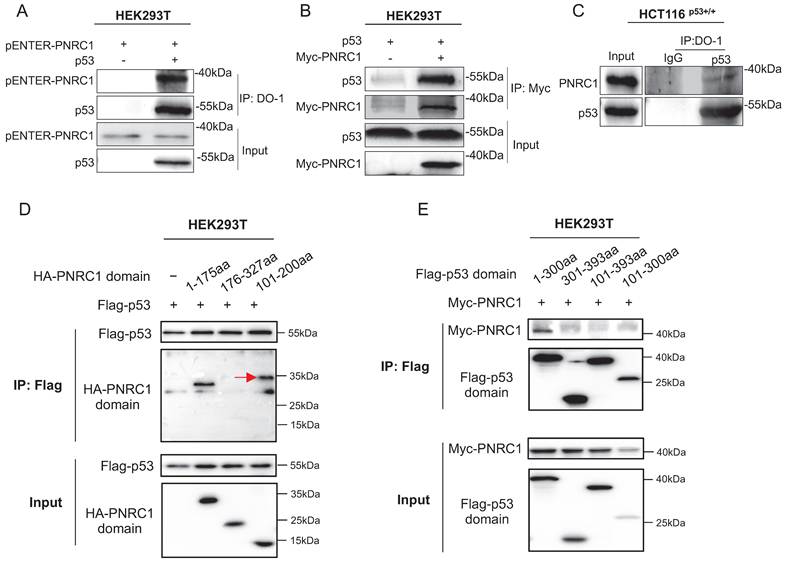
Since PNRC1 regulates the p53 protein level, we speculated that the two proteins may bind to each other. To test this hypothesis, we performed the co-immunoprecipitation (co-IP) assay, followed by the immunoblotting (IB) analysis. Indeed, the interactions between exogenous PNRC1 and p53 proteins were observed by reciprocal co-IP-IB assays (Figures 3A-3B). Additionally, the endogenous interaction between the two proteins was further validated in HCT116 p53+/+ cells (Figure 3C). Through domain-mapping analysis, we identified that this interaction is mediated by the 1-100 amino acid region of PNRC1 and the 1-100 amino acid region of p53 (Figures 3D-3E). These findings suggest that PNRC1 elevates the p53 protein level through their physical interaction.
PNRC1 interacts with the transactivation domain of p53. (A, B) PNRC1 interacts with p53. Cells were transfected with the indicated plasmids, followed by co-IP-IB analysis using antibodies as indicated. (C) Endogenous interaction between PNRC1 and p53. HCT116 p53+/+ cells were treated with MG132 for 6 h and subjected to co-IP-IB analysis. (D) p53 binds to the N-terminal amino acids 1-100 of PNRC1. Cells were transfected with plasmids as indicated, followed by co-IP-IB analysis. The arrow indicates a non-specific band. (E) PNRC1 binds to the transactivation domain (amino acids 1-100) of p53. Cells were transfected with plasmids as indicated, followed by co-IP-IB analysis.
PNRC1 induces p53 stabilization by inhibiting MDM2-mediated degradation
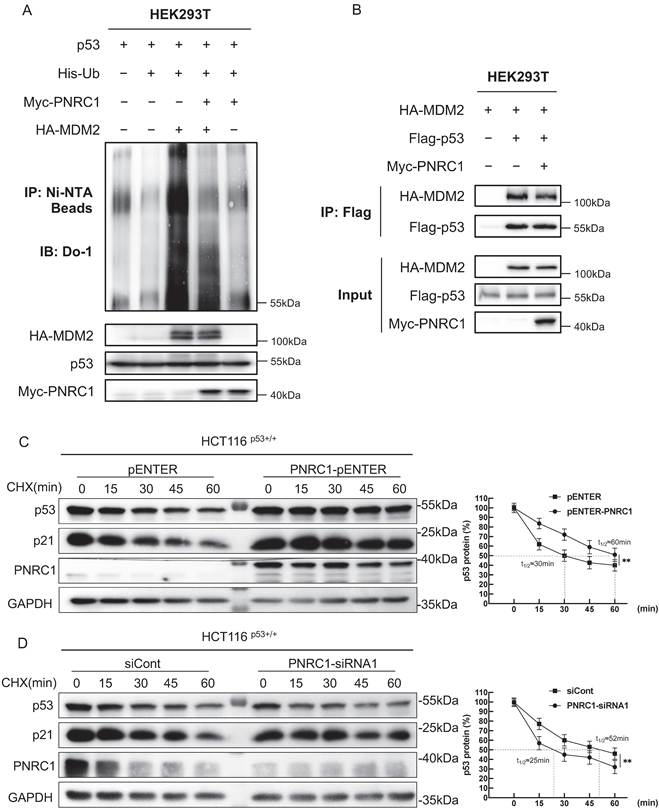
The key inhibitor of p53 is the E3 ubiquitin ligase MDM2, which binds to its transactivation (TA) domain (residues 1-62) [32, 33]. We hypothesized that PNRC1 may compete with MDM2 for binding to the TA domain of p53. To test this idea, we performed the ubiquitination assay to determine if PNRC1 affects MDM2-mediated p53 ubiquitination. As expected, overexpression of MDM2 dramatically increased the poly-ubiquitination of p53. However, the addition of PNRC1 significantly reduced MDM2-mediated p53 ubiquitination (Figure 4A). Importantly, our result further demonstrated that PNRC1 overexpression reduced the interaction between MDM2 and p53, as evidenced by the co-IP-IB assay (Figure 4B). To determine the effect of PNRC1 on p53 protein stability, we performed the cycloheximide-chase assay to measure the half-life of the p53 protein in the presence or absence of PNRC1. Our results indicated that overexpression of PNRC1 significantly prolongs the half-life of the p53 protein (Figure 4C), whereas knockdown of PNRC1 shortens its protein half-life (Figure 4D), demonstrating a crucial role of PNRC1 in stabilizing the p53 protein. Our results demonstrate that PNRC1 represses the MDM2-p53 interaction, thereby inhibiting MDM2-induced p53 ubiquitination and degradation.
PNRC1 induces p53 stabilization by inhibiting MDM2-mediated degradation. (A) PNRC1 reduces MDM2-induced p53 ubiquitination. Cells were transfected with the indicated plasmids and treated with MG132 for 6 h, followed by the in vivo ubiquitination assay. (B) PNRC1 impairs the interaction between p53 and MDM2. Cells were transfected with the indicated plasmids, followed by co-IP-IB analysis. (C) Overexpression of PNRC1 prolongs the half-life of the p53 protein. HCT116 p53+/+ cells were transfected with the indicated plasmids, treated with 100 μg/mL CHX at different time points, and subjected to IB analysis. (D) Knockdown of PNRC1 shortens the half-life of the p53 protein. HCT116 p53+/+ cells were transfected with the indicated siRNAs, treated with 100 μg/mL CHX at different time points, and subjected to IB analysis. Data are represented as mean ± standard deviation (SD), n = 3 biological replicates. p values were calculated by two-tailed paired t test. ** p < 0.01.
PNRC1 suppresses the growth and migration of colorectal cancer cells
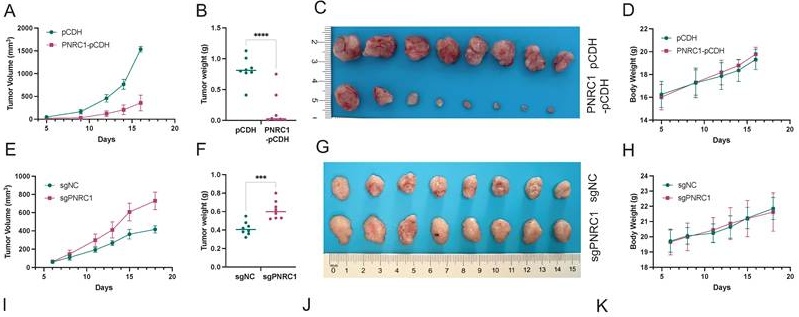
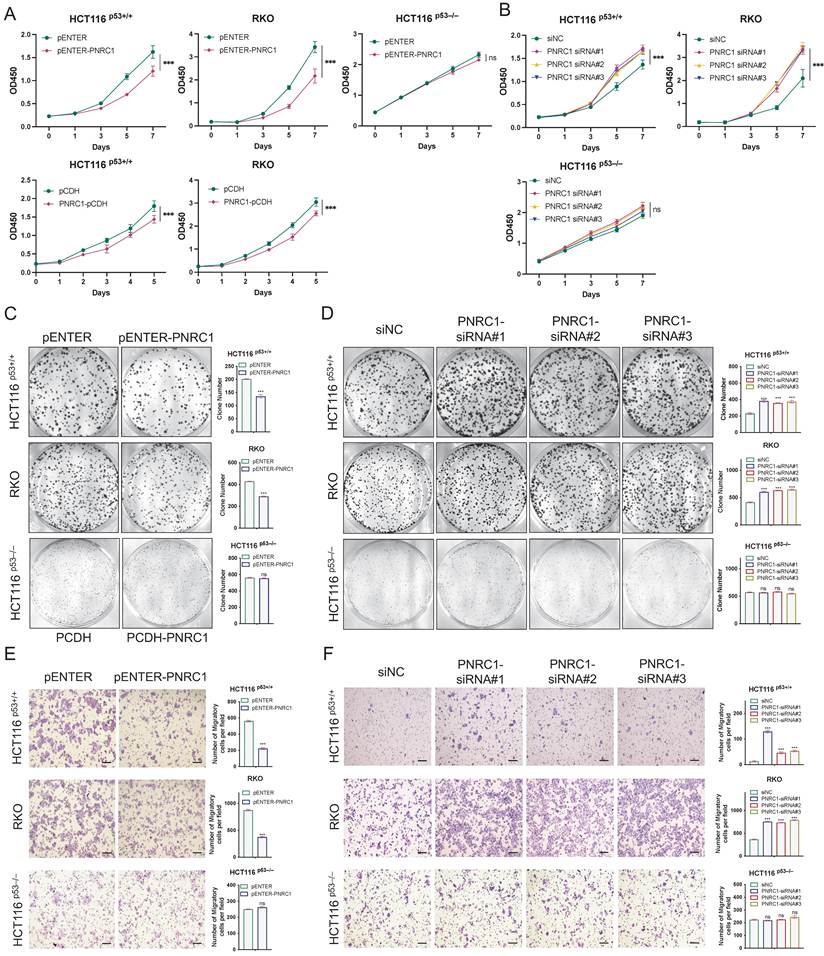
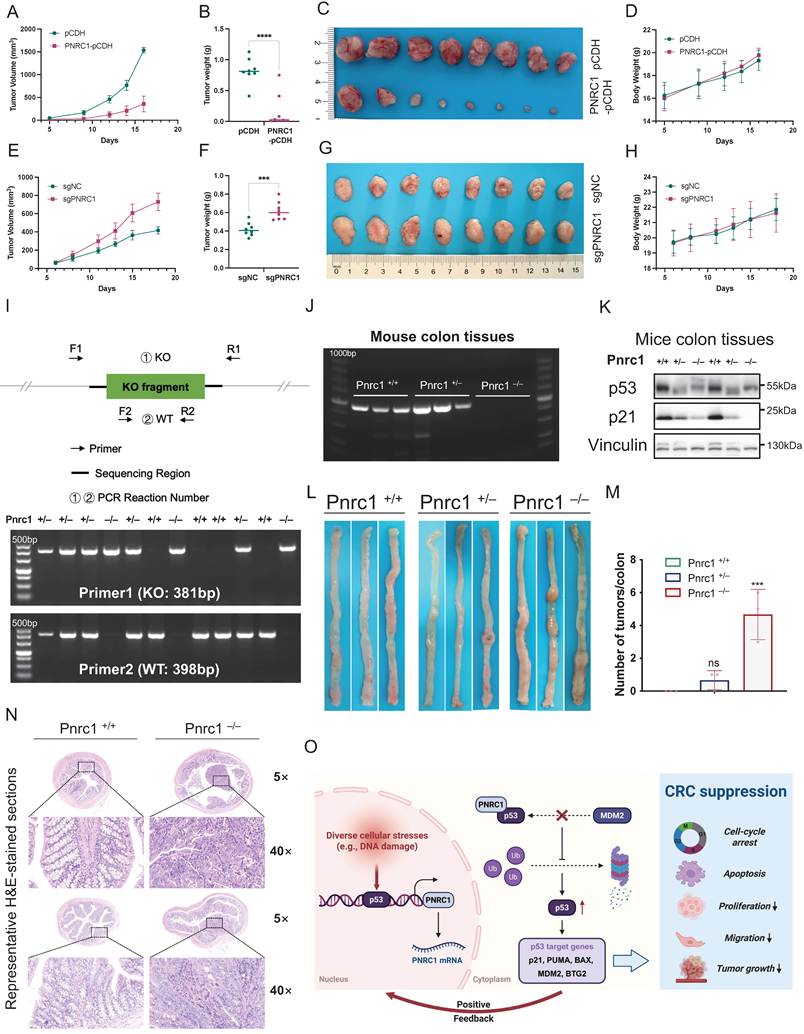
Then, we determined the biological function of PNRC1 in CRC. First, we conducted cell viability assays by transiently or stably overexpressing PNRC1 into HCT116 p53+/+ and RKO cells. Our results showed that ectopic PNRC1 significantly reduces CRC cell growth, but has a marginal effect on the growth of p53-null HCT116 p53-/- cells (Figure 5A). Conversely, knockdown of PNRC1 by three independent siRNAs markedly increased CRC cell growth in a p53-dependent fashion (Figure 5B). In addition, PNRC1 overexpression inhibited colony formation in CRC cells, while its knockdown promoted this phenotype (Figures 5C-5D). Furthermore, ectopic PNRC1 suppressed CRC cell migration, an effect conversely enhanced by PNRC1 knockdown (Figures 5E-5F). While our study does not mechanistically explain how p53 activation inhibits cell migration, previous reports indicate that p53 promotes MDM2-mediated degradation of the EMT transcription factor Slug, thereby sustaining E-cadherin expression and impeding invasion [34]. Additionally, p53 induces the miR-200 and miR-192 families, which repress ZEB1/2 [35], and upregulates miR-34 to suppress Snail1-driven EMT [36]. Since p53 activation is closely associated with apoptosis induction, we next examined whether PNRC1 affects apoptotic responses in CRC cells. PNRC1 overexpression increased apoptotic cell death, whereas PNRC1 depletion reduced apoptosis in HCT116 p53+/+ and RKO cells (Figures S2A-S2B). These findings suggest that PNRC1 promotes apoptosis as part of its tumor-suppressive function. To further determine whether the tumor-suppressive effects of PNRC1 are mediated through p53 signaling, we performed rescue experiments by knocking down p53 in PNRC1-overexpressing HCT116 p53+/+ and RKO cells. Silencing of p53 significantly attenuated the inhibitory effects of PNRC1 on cell proliferation, colony formation, and migration (Figures S2C-S2E). Notably, this attenuation was only partial, as the siRNA-mediated knockdown was insufficient to completely abrogate p53 expression. These PNRC1-dependent effects correlated with p53 status, suggesting that functional p53 signaling may be required for PNRC1-mediated suppression of CRC progression. Interestingly, PNRC1 has previously been reported to significantly suppress proliferation in several cancer cells and fibroblasts harboring wild-type p53 [28]. The tumor-suppressive role of PNRC1 was further validated in xenograft tumor models. PNRC1 overexpression dramatically suppressed the growth of HCT116 p53+/+ cell-derived xenograft tumors, as indicated by the reduced tumor growth rate, weight, and size (Figures 6A-6D), whereas depletion of PNRC1 significantly promoted the growth of xenograft CRC tumors (Figures 6E-6H). Together, our results demonstrate that PNRC1 suppresses the growth of CRC in vitro and in vivo.
PNRC1 suppresses the growth and migration of colorectal cancer cells. (A) Overexpression of PNRC1 reduces proliferation of HCT116 p53+/+ and RKO cells, but not HCT116 p53-/- cells. Cells were transiently or stably transfected with the indicated plasmids, followed by the cell viability assay. (B) Knockdown of PNRC1 increases proliferation of HCT116 p53+/+ and RKO cells, but not HCT116 p53-/- cells. Cells were transfected with the indicated siRNAs, followed by the cell viability assay. (C) Overexpression of PNRC1 reduces the colony-forming ability of HCT116 p53+/+ and RKO cells, but not HCT116 p53-/- cells. Cells were transfected with the indicated plasmids, followed by the colony formation assay. (D) Knockdown of PNRC1 enhances the colony-forming ability of HCT116 p53+/+ and RKO cells, but not HCT116 p53-/- cells. Cells were transfected with the indicated siRNAs, followed by the colony formation assay. (E) Overexpression of PNRC1 reduces migration of HCT116 p53+/+ and RKO cells, but not HCT116 p53-/- cells. Cells were transfected with the indicated plasmids, followed by the Transwell migration assay. (F) Knockdown of PNRC1 increases migration of HCT116 p53+/+ and RKO cells, but not HCT116 p53-/- cells. Cells were transfected with the indicated siRNAs, followed by the Transwell migration assay. Data are represented as mean ± standard deviation (SD), n = 3 biological replicates. p values were calculated by two-tailed paired t test. ** p < 0.01, *** p < 0.001, ns, not significant. Scale bars, 100 μm. See also Figure S2.
PNRC1 suppresses colorectal tumorigenesis in vivo. (A-D) Stable overexpression of PNRC1 inhibits the growth rate (A), weight (B), and size (C) of HCT116 p53+/+ cell-derived xenograft tumors; no body weight loss was observed during the experiment (D). (E-H) Depletion of PNRC1 increases the growth rate (E), weight (F), and size (G) of HCT116 p53+/+ cell-derived xenograft tumors. No body weight loss was observed during the experiment (H). (I) Schematic of genotyping primer design for Pnrc1-KO Mice. (J) RT-PCR analysis of Pnrc1 mRNA expression in mouse colon tissues. (K) IB analysis of p53 and p21 protein expression in mouse colon tissues. (L) Representative images of colons from Pnrc1+/+, Pnrc1+/-, and Pnrc1-/- mice treated with AOM/DSS. (M) Quantification of tumor burden in Pnrc1+/+ (n = 3), Pnrc1+/- (n = 3), and Pnrc1-/- (n = 3) mice. (N) Representative H&E-stained colon sections from Pnrc1+/+ and Pnrc1-/- mice. Images were acquired at 5× and 40× magnification. Scale bar = 20 μm. (O) Schematic model illustrating the p53-PNRC1 positive feedback loop in colorectal cancer suppression. Created with BioRender.com. See also Figure S3.
Knockout of Pnrc1 promotes colorectal carcinogenesis by inactivating p53
To define the role of PNRC1 in colorectal carcinogenesis, we generated Pnrc1-KO mice and induced CRC using azoxymethane (AOM)/dextran sulfate sodium (DSS) treatment. The Pnrc1 genotyping PCR strategy is shown in Figure 6I. Genotyping was conducted using specific primers targeting the deletion site, and the genotypes of mice (Pnrc1+/+, Pnrc1+/-, and Pnrc1-/-) were validated through PCR analysis (Figure 6J). Consistent with our cell-based findings, depletion of Pnrc1 in mice reduced p53 and p21 expression in colon (Figure 6K) and liver tissues (Figure S3A). Nevertheless, Pnrc1-KO mice did not display obvious developmental abnormalities under standard conditions and the potential physiological roles of Pnrc1 in other tissues require further investigation. Furthermore, we established the colitis-associated colorectal carcinogenesis model via the AOM/DSS treatment (Figure S3B). Following the 10-week treatment period, Pnrc1-KO mice exhibited a significant increase in colon tumor burden compared with wild-type or heterozygous littermates (Figures 6L-6M), demonstrating that Pnrc1-KO promotes colorectal carcinogenesis under inflammatory conditions. Finally, hematoxylin and eosin (H&E) staining revealed distinct histopathological characteristics, with Pnrc1-KO colon tissues exhibiting clear neoplastic features compared to the normal architecture observed in wild-type mice (Figure 6N). Together, these findings demonstrate that loss of PNRC1 facilitates CRC development in vivo, likely through the impairment of the p53 pathway. Notably, the use of the AOM/DSS model—which mimics inflammation-driven CRC—further supports the relevance of the PNRC1-p53 axis in tumor suppression under chronic inflammatory conditions. Collectively, these findings establish PNRC1 as a positive feedback regulator of p53 and reveal a mechanism by which PNRC1 reinforces p53-mediated tumor suppression in colorectal cancer (Figure 6O).
Discussion
p53 undergoes complex autoregulation through feedback loops—such as MDM2-mediated degradation—which are critical for tumorigenesis [37]. In this study, we found that PNRC1 expression is significantly induced by various DNA-damaging agents, including 5-FU and cisplatin, and the p53 agonist Nutlin-3. This finding partially aligns with prior work demonstrating that the transcription factor RFX7 induces PNRC1 expression upon p53 activation [31]. Interestingly, our results revealed that p53 can also associate with the intronic p53-RE of PNRC1 to activate its transcription. Although p53 represents a major regulator of PNRC1 transcription, our findings suggest that PNRC1 expression is controlled by multiple upstream mechanisms. Knockdown of either p53 or RFX7 reduced PNRC1 expression, whereas combined depletion further decreased PNRC1 levels, suggesting that RFX7 contributes to PNRC1 regulation together with p53. Future studies are needed to further define the transcriptional network controlling PNRC1 expression in different tumor contexts. Together, these findings indicate that p53 activates PNRC1 transcription both directly and indirectly through RFX7.
It is well-established that the stability and transcriptional activity of p53 are strictly regulated by MDM2, which binds directly to the TA domain of p53 [32, 38, 39]. Our results demonstrated that PNRC1 competes with MDM2 for binding to the TA domain, thereby protecting p53 from MDM2-induced ubiquitination and prolonging its half-life. This study provides the first evidence that PNRC1 activates p53 by inhibiting MDM2-induced degradation through a positive feedback circuit.
Functionally, our studies consistently demonstrated the significant tumor-suppressive role of PNRC1 in CRC cell lines and mouse xenograft models, and further validated this effect in Pnrc1-KO mice using an inflammation-driven intestinal cancer model. Remarkably, the tumor suppressive effect of PNRC1 is, at least partially, associated with wild-type p53, because overexpression or depletion of PNRC1 affects the growth and migration of HCT116 p53+/+ and RKO cells, but not p53-null CRC cells. Consistently, further rescue experiments demonstrated that p53 depletion attenuated the inhibitory effects of PNRC1 on CRC cell proliferation, colony formation, and migration, indicating that PNRC1-mediated tumor suppression is largely dependent on functional p53 signaling. More importantly, Pnrc1-KO mice showed significantly reduced expression levels of p53 and p21 in colon tissues, which consequently elevated tumor burden after AOM/DSS exposure. The results also emphasize a critical role of p53 in preventing inflammation-induced carcinogenesis. Database analyses further revealed that PNRC1 expression is markedly reduced across CRC and various other cancer types, and lower PNRC1 expression strongly correlates with poor patient prognosis. These clinical data align closely with our experimental findings and further support the notion that PNRC1 functions as a tumor suppressor in CRC. The mechanisms underlying PNRC1 downregulation in cancer remain largely unknown. Although reduced PNRC1 expression has been observed across multiple cancer types [28], whether this alteration results from genetic alterations, epigenetic regulation, or transcriptional suppression requires further investigation [40]. Understanding the upstream mechanisms responsible for PNRC1 loss may provide additional opportunities for restoring endogenous p53 activity in tumors retaining wild-type p53.
Furthermore, our results reveal a previously unrecognized dimension of the p53 regulatory network. While Gaviraghi et al. reported that PNRC1 inhibits the RNA decapping complex by binding to DCP1A [28], our recent work demonstrates that p53 transcriptionally activates DCP1B, another component of the same complex, thereby suppressing the non-canonical MAPK4-AKT signaling pathway [23]. This mechanistic contrast not only highlights a novel p53-dependent regulation of decapping activity but also suggests a sophisticated model whereby p53 broadly orchestrates gene expression at the post-transcriptional level by modulating the RNA decapping machinery.
While our study offers new insights into the functional interplay between PNRC1, p53, and MDM2 in CRC, several limitations should be acknowledged. First, the precise molecular mechanism by which PNRC1 disrupts the MDM2-p53 interaction remains incompletely understood. Future structural biology studies, such as those employing cryo-electron microscopy, are needed to elucidate these details. Furthermore, PNRC1 may regulate additional signaling pathways, including RAS signaling [26] or RNA metabolism [28], warranting further investigation to comprehensively define its broader biological functions. In addition, given the diverse roles of p53 in regulating inflammation and tumor immunity, PNRC1 may potentially influence the tumor microenvironment through modulation of p53-dependent immune pathways [41, 42]. However, the present study mainly focused on tumor cell-intrinsic mechanisms, and future studies involving immune profiling and immune-competent models will be required to determine whether PNRC1 contributes to anti-tumor immune responses.
Our findings also suggest that targeting PNRC1 represents a potential strategy for enhancing endogenous p53 activity, particularly in tumors retaining wild-type TP53. Although direct PNRC1 agonists are currently unavailable, future approaches aimed at restoring PNRC1 expression, enhancing PNRC1-p53 interaction, or preventing PNRC1 downregulation may provide new opportunities for p53 pathway reactivation.
In conclusion, our study identifies PNRC1 as a positive feedback regulator of p53 in CRC. Our results demonstrate that PNRC1 stabilizes p53 by engaging in a physical interaction that competes with and abrogates MDM2 binding, thereby inhibiting colorectal tumorigenesis and progression. These findings provide novel insights into the complexity of p53 signaling and establish the groundwork for developing PNRC1 as a potential biomarker and therapeutic target in CRC.
Materials and Methods
Plasmids, antibodies, and reagents
Flag-tagged pENTER-PNRC1 plasmid was obtained from Vigene Biosciences (Shandong, China). For subsequent experiments, human PNRC1 was cloned into Flag-tagged pCDH and Myc-tagged pcDNA3.1 expression vectors. The p53-responsive element (p53-RE) was inserted into the pGL3-basic vector. Plasmids expressing His-tagged ubiquitin and p53 were generated by Hua Lu's lab. Antibodies were procured from several vendors: anti-Flag (F1804) from Sigma-Aldrich (St. Louis, MO, USA), anti-p53 (sc-126) from Santa Cruz Biotechnology (Santa Cruz, CA, USA), and anti-p21 (#2947) along with normal rabbit IgG (#2729) from Cell Signaling Technology (Danvers, MA, USA). A panel of primary antibodies against PNRC1 (51052-1-AP), Myc (60003-2-Ig, 16286-1-AP), HA (51064-2-AP), GAPDH (60004-1-Ig), and Vinculin (66305-1-Ig), as well as anti-rabbit (SA00001-2) and anti-mouse (SA00001-1) secondary antibodies, were all purchased from Proteintech (Wuhan, Hubei, China). Additionally, chemical compounds including Nutlin-3, cisplatin, 5-fluorouracil (5-FU), actinomycin D (Act. D), MG132, and cycloheximide (CHX) were purchased from MedChemExpress (Shanghai, China).
Cell culture and transient transfection
Human cancer cell lines, HCT116 p53+/+, HCT116 p53-/-, H1299, RKO, HEY, HEK293T, CAL-51, and MCF-7 were maintained in Dulbecco's modified Eagle's medium (DMEM). The culture medium was supplemented with 10% fetal bovine serum (FBS), 100 U/mL penicillin, and 100 μg/mL streptomycin. Prior to the experiments, all cell lines were verified to be free of mycoplasma contamination and authenticated via PCR. For experimental assays, cells were plated at an appropriate density 12-24 h prior to transfection. Liposome-mediated transfection was then performed utilizing the Hieff Trans reagent (Yeasen, Shanghai, China) in strict accordance with the manufacturer's instructions.
Reverse transcription and quantitative RT-PCR analysis
Total cellular RNA was isolated utilizing RNAiso Plus (Takara) in strict accordance with the manufacturer's guidelines. Subsequently, 0.2 to 0.5 μg of the purified RNA was reverse-transcribed into complementary DNA (cDNA) using the Hiscript III qRT SuperMix (Vazyme, Nanjing, China). Real-time quantitative PCR assays were then executed with the SYBR qPCR Master Mix (Vazyme). To evaluate relative mRNA expression, the comparative Ct method was applied, with transcript levels normalized to the endogenous control, GAPDH. All primer sequences designed for these RT-qPCR assays are detailed in Table S1.
RNA interference
All small interfering RNAs (siRNAs) employed in this research were obtained from GenePharma (Shanghai, China) and are detailed in Table S2. For gene silencing, cells were transfected with the respective siRNAs following the manufacturer's protocol using Hieff Trans Liposome Transfection Reagent (Yeasen, Shanghai, China).
CRISPR/Cas9-mediated gene editing
The lentiCRISPR v2 plasmid was acquired from Addgene (Cambridge, MA, USA). Specific single guide RNA (sgRNA) sequences targeting PNRC1 (detailed in Table S3) were designed on the website (https://www.atum.bio/eCommerce/cas9/input). To generate lentiviral particles, the annealed sgRNA oligonucleotides were inserted into the BsmBI restriction site of the lentiCRISPR v2 backbone. Following lentiviral transduction, the infected cells underwent selection with 1 μg/mL puromycin for one week. Ultimately, a successfully edited single-cell clone, designated as PNRC1-KO, was isolated and expanded for all subsequent experiments.
Luciferase reporter assay
To construct the reporter plasmid, the intronic p53-RE sequence of PNRC1 (+1769 to +1790 bp) was amplified from genomic DNA of HCT116 p53+/+ cells and cloned into the pGL3-basic vector (designated as p53-RE-WT). For the reporter assay, cells were seeded into 24-well plates and co-transfected with plasmids encoding p53, p53-RE-WT, and Renilla luciferase. Luciferase activity was determined 48 h after transfection using a dual-luciferase reporter system (Vazyme, Nanjing, China) following the manufacturer's instructions.
Immunoblotting and immunoprecipitation assays
Cells were harvested and lysed in lysis buffer [50 mM Tris-HCl (pH 7.5), 150 mM NaCl, 0.5% NP-40, 1 mM EDTA, 1 mM dithiothreitol (DTT), supplemented with 0.2 mM PMSF, 10 mM pepstatin A, and 1 mM leupeptin] or RIPA buffer [50 mM Tris-HCl (pH 8.0), 150 mM NaCl, 5 mM EDTA, 1% NP-40, 0.5% deoxycholate, 0.1% SDS, containing a protease inhibitor cocktail]. The lysates were cleared by centrifugation, and equivalent amounts of protein were subjected to immunoblotting (IB) analysis. For immunoprecipitation assays, 500 to 1,000 μg of total protein was incubated with specific primary antibodies at 4 °C for 4 h or overnight. Protein A or G beads (Santa Cruz Biotechnology) were then added into the mixture for an additional 1-2 h at 4 °C. The beads were washed at least three times with lysis buffer. Bound proteins were detected by IB with antibodies as indicated in the Figures. The original blots used in the manuscript are included in the Supplemental Material.
Chromatin immunoprecipitation assay
Cells were crosslinked with 1% formaldehyde for 10 min at room temperature, followed by quenching with 0.2 M glycine for 5 min. After washing three times with cold PBS, cells were harvested and solubilized in a chilled cell lysis buffer [50 mM Tris-HCl (pH 7.5), 140 mM NaCl, 1 mM EDTA, 10% glycerol, 0.5% NP-40, 0.25% Triton X-100, supplemented with a protease inhibitor cocktail] for 30 min on ice. Nuclei were subsequently collected and resuspended in 0.5 mL of nuclear lysis buffer [50 mM Tris-HCl (pH 8.0), 10 mM EDTA, 1% SDS, and protease inhibitor cocktail]. Chromatin was sheared via sonication (30 cycles with 30 s on and 30 s off). The resulting homogenates were clarified by centrifugation at 12,000 × g for 5 min. The cleared supernatants were incubated overnight with either an anti-p53 antibody or a control IgG, followed by a 2 h incubation with Protein A/G beads at 4°C. The bead-bound immunocomplexes were subjected to sequential washes using Low Salt Buffer [50 mM Tris-HCl (pH 8.0), 0.1% SDS, 0.5% deoxycholate, 1 mM EDTA, 1% NP-40, and 150 mM NaCl], High Salt Buffer (same formulation but with 500 mM NaCl), LiCl Buffer [50 mM Tris-HCl (pH 8.0), 250 mM LiCl, 0.1% SDS, 0.5% deoxycholate, 1 mM EDTA, and 1% NP-40], and finally TE Buffer [10 mM Tris-HCl (pH 8.0) and 1 mM EDTA]. Target protein-DNA complexes were eluted using a ChIP elution buffer (1% SDS and 0.1 M NaHCO3). Following reverse crosslinking at 62°C for 2 h, the immunoprecipitated DNA was purified and subjected to qPCR analysis. The primers for ChIP-qPCR are listed in Table S4.
In vivo ubiquitination assay
To evaluate intracellular ubiquitination, cells transiently expressing the designated plasmids (as detailed in the figures) were treated with the proteasome inhibitor MG132 for 6 h prior to harvesting. Following collection, 10% of the total cell lysate was reserved as an input control, while the remaining 90% was subjected to the ubiquitination assay. Cell pellets were solubilized in Buffer I [8 M urea, 0.1 M Na2HPO4/NaH2PO4 (pH 8.0), 10 mM Tris-HCl (pH 8.0), 10 mM β-mercaptoethanol, and 5 mM imidazole]. To isolate His-tagged ubiquitinated conjugates, the denatured lysates were incubated with Ni-NTA agarose beads (Takara) for 4 h at room temperature. Beads were washed twice with buffer I, then twice with buffer II (8 M urea, 0.1 M Na2HPO4/NaH2PO4 (pH 6.3), 10 mM Tris-HCl (pH 6.3), and 10 mM β-mercaptoethanol). Finally, the enriched target proteins were eluted and subjected to IB analysis using the antibodies indicated in the figure legends.
Cell viability assay
The Cell Counting Kit-8 (CCK-8) assay (Yeasen, Shanghai, China) was employed in accordance with the manufacturer's protocol. Briefly, at 6-12 h post-transfection, cells were harvested and seeded into 96-well microplates at a density of 2,000 to 4,000 cells per well. 10 μL of CCK-8 solution (10% of culture medium volume) was added to each well every 24 h, and the absorbance of the samples was measured at 450 nm.
Colony formation assay
At 6-12 h post-transfection, cells were harvested and seeded into 6-well plates at a density of 500 to 800 cells per well. The cultures were maintained for approximately two weeks, with the growth medium replenished every three days. Upon termination of the assay, the macroscopic colonies were fixed with methanol and subsequently stained with a crystal violet solution for 30 min. Colonies were counted using the ImageJ software.
Transwell migration assay
Cell migration was evaluated utilizing 24-well transwell chamber inserts. Briefly, 1-2 × 10⁵ cells suspended in 200 μL of serum-free medium were seeded into the upper chamber of the insert. The lower chamber was filled with complete medium. Following a 24-36 h incubation at 37 °C, non-migratory cells remaining on the upper surface of the membrane were carefully removed. The cells that had successfully migrated to the lower surface were subsequently fixed with methanol and stained overnight with a crystal violet solution. The migratory cells were photographed with at least three fields of view per chamber. ImageJ was used to calculate the number of migratory cells.
RNA-sequencing
HCT116 p53+/+ cells treated with DMSO or 5-FU for 24 h, and either a control siRNA or siRNA targeting PNRC1 were harvested for RNA isolation using RNAiso Plus following the manufacturer's protocol (Takara, Japan). RNA sequencing and bioinformatic analysis was provided by Shanghai Biotechnology Corporation (Shanghai, China). To identify differentially expressed genes (DEGs), the limma package in R was utilized. Transcripts meeting the stringent criteria of an adjusted P-value < 0.05 and an absolute log2(fold change) > 1 were defined as significantly differentially expressed. For data visualization, volcano plots and differential ranking diagrams were generated via the ggplot2 package, while hierarchical clustering heatmaps were constructed using the ComplexHeatmap package (version 2.13.1). Finally, Gene Ontology (GO) functional annotation and Kyoto Encyclopedia of Genes and Genomes (KEGG) pathway enrichment analyses of the DEGs were executed using the clusterProfiler package (version 3.18.0) in R software.
Animal experiments
Female BALB/c nude mice (5-6 weeks old) were purchased and maintained at the Laboratory Animal Science of Fudan University Shanghai Cancer Center. HCT116 p53+/+ cells were subcutaneously injected into the flanks of nude mice for in vivo studies. Specifically, 5×10⁶ HCT116 p53+/+ cells expressing pCDH or PNRC1-pCDH and 2×10⁶ HCT116 p53+/+ cells expressing Ctrl-Cas9 or PNRC1-Cas9 were injected. The volume of xenograft tumors was monitored and calculated using the following formula: volume (mm3) =length×width2×0.52. When the tumors reached an appropriate volume, the mice were sacrificed and the tumors were harvested, weighed, and photographed. The animal protocols complied with the ethical guidelines and were approved by the Animal Welfare Committee of Fudan University Shanghai Cancer Center. PNRC1-KO mice (strain no. T045673) with a C57BL/6J background (C57BL/6JGpt-Pnrc1em1Cd9316/Gpt) were sourced from GemPharmatech (Nanjing, China). The knockout mice were crossbred with other mouse strains to yield double gene-positive homozygous offspring. For each mouse model, heterozygous mice were crossed to obtain homozygous mutants, heterozygous mice, and wild-type littermates. Mice were maintained under specific pathogen-free standard housing conditions (25-27°C, 45-55 % humidity, 12 h day/night cycle, with food ad libitum). To distinguish between wild-type, heterozygous, and homozygous knockout alleles of the Pnrc1 gene, two primer sets were designed. The first set (F1/R1) amplifies a 381 bp fragment specific to the KO allele. The corresponding wild-type segment is 9702 bp in length, which is too large to be amplified under standard PCR conditions. The second primer set (F2/R2) produces a 398 bp amplicon from the wild-type allele; no product is generated from the KO allele due to the disruption of primer binding sites. Genotyping results are interpreted as follows: a single band with F2/R2 indicates wild-type (Pnrc1+/+); bands from both primer sets indicate heterozygosity (Pnrc1+/-); and a band only with F1/R1 identifies the homozygous KO (Pnrc1-/-). For AOM/ DSS-induced CRC model, mice were injected with AOM, and after 7 days, fed with 2.5% DSS for 5 days. The mice were sacrificed after 10 weeks for analysis. Tumor formation and histopathological changes were observed in the colon tissues, and tumor numbers were quantified to assess the effects of PNRC1 knockout on colorectal cancer progression.
Hematoxylin and eosin (H&E) staining
Colon tissues were excised, rinsed gently with PBS, and fixed in 10% neutral buffered formalin for 24-48 h at room temperature. Fixed tissues were dehydrated through graded ethanol, cleared in xylene, and embedded in paraffin. Serial sections of 4 μm thickness were cut using a rotary microtome, mounted onto poly-L-lysine-coated slides, and dried at 60°C for 1 h. For staining, sections were deparaffinized in xylene, rehydrated through graded ethanol to distilled water, and stained with hematoxylin for 3-5 min. After rinsing and differentiation in acid alcohol, sections were blued in running tap water, counterstained with eosin for 30-60 s, dehydrated, cleared, and mounted with neutral resin. Histopathological changes were examined under a bright-field microscope at both low (×5) and high (×40) magnifications. Representative images were captured using a digital imaging system, and all samples were processed under identical conditions.
Flow cytometry analysis of cell apoptosis
Cell apoptosis was evaluated utilizing the Annexin-V-PE/7-AAD Apoptosis Detection Kit (Yeasen, China) in accordance with the manufacturer's instructions. Briefly, cells were seeded in 6-well plates and subjected to the indicated treatments. Following the incubation period, both adherent and floating cells were harvested, pooled, and washed twice with ice-cold PBS. The cell pellets were then resuspended in 1× Binding Buffer at an approximate density of 1 × 10⁶ cells/mL. Subsequently, 100 μL of the cell suspension was transferred to a flow cytometry tube and gently mixed with 5 μL of Annexin V-PE and 10 μL of 7-AAD. The mixture was incubated for 15 min at room temperature in the dark. Finally, an additional 400 μL of 1× Binding Buffer was added to each tube to terminate the reaction. The percentages of apoptotic cells were measured by flow cytometry (Beckman Coulter).
Databases
We searched the Tumor Immune Estimation Resource (TIMER) database (https://cistrome.shinyapps.io/timer/) for the pancancer gene expression of PNRC1 (Cancer vs. Normal). The mRNA profiles for PNRC1 in multiple cancer datasets from The Cancer Genome Atlas (TCGA) were obtained from the UALCAN database (http://ualcan.path.uab.edu). The protein expression of PNRC1 was searched in the Human Protein Atlas (HPA) database (http://www.proteinatlas.org). Survival analysis of PNRC1 was conducted using the Kaplan‒Meier Plotter database (http://kmplot.com).
Quantification and statistical analysis
The mean ± SD of at least three independent experiments was used to represent the quantitative data. Student's t test or one-way ANOVA was used to compare the differences between two or more groups. Kaplan-Meier survival analysis and log-rank test were used to analyze significant differences in patient survival. Statistical significance was set at p < 0.05. Non-significant differences are labeled as ns, * p < 0.05, ** p < 0.01, *** p < 0.001.
Supplementary Material
Supplementary figure legends and tables.

Supplementary figures.
Acknowledgements
We thank the laboratory members for active and helpful discussion.
Funding
This work was supported by the National Natural Science Foundation of China (82173022 to Q.H., 82273098 and 82472714 to X.Z., and 82403120 to Y.G.), the Shanghai Leading Talent Program of Eastern Talent Plan (BJKJ2025059 to X.Z.), and Jiangxi Provincial Natural Science Foundation (20262BAC200272 to Y.G.)
Availability of data and materials
All data supporting the findings of this study are available within the paper and its Supplementary Information.
Ethics approval and consent to participate
The animal protocols complied with the ethical guidelines and were approved by the Animal Welfare Committee of Fudan University Shanghai Cancer Center.
Author contributions
C.X., Q.Z., T.C. and B.X. conducted most of the experiments and analyzed the data; J.T., Y.G. and R.R. conducted part of the experiments; J.D., J.C. and T.H. analyzed the data; X.Z., C.W. and Q.H. conceived, designed and supervised the study and analyzed the data; C.X., X.Z., C.W. and Q.H. wrote the paper.
Competing Interests
The authors have declared that no competing interest exists.
References
1. Bray F, Laversanne M, Sung H, Ferlay J, Siegel RL, Soerjomataram I. et al. Global cancer statistics 2022: GLOBOCAN estimates of incidence and mortality worldwide for 36 cancers in 185 countries. CA Cancer J Clin. 2024;74:229-63
2. Goh HS, Chan CS, Khine K, Smith DR. p53 and behaviour of colorectal cancer. Lancet. 1994;344:233-4
3. Kressner U, Inganäs M, Byding S, Blikstad I, Påhlman L, Glimelius B. et al. Prognostic value of p53 genetic changes in colorectal cancer. J Clin Oncol. 1999;17:593-9
4. Liebl MC, Hofmann TG. The Role of p53 Signaling in Colorectal Cancer. Cancers (Basel). 2021;13:2125
5. Bieging KT, Mello SS, Attardi LD. Unravelling mechanisms of p53-mediated tumour suppression. Nat Rev Cancer. 2014;14:359-70
6. Williams AB, Schumacher B. p53 in the DNA-Damage-Repair Process. Cold Spring Harb Perspect Med. 2016;6:a026070
7. Engeland K. Cell cycle regulation: p53-p21-RB signaling. Cell Death Differ. 2022;29:946-60
8. Xiong C, Ling H, Hao Q, Zhou X. Cuproptosis: p53-regulated metabolic cell death? Cell Death Differ. 2023;30:876-84
9. Liu Y, Stockwell BR, Jiang X, Gu W. p53-regulated non-apoptotic cell death pathways and their relevance in cancer and other diseases. Nature reviews Molecular cell biology. 2025;26:600-614
10. Hao Q, Chen J, Lu H, Zhou X. The ARTS of p53-dependent mitochondrial apoptosis. J Mol Cell Biol. 2023;14:mjac074
11. Kruiswijk F, Labuschagne CF, Vousden KH. p53 in survival, death and metabolic health: a lifeguard with a licence to kill. Nat Rev Mol Cell Biol. 2015;16:393-405
12. Liu Y, Gu W. The complexity of p53-mediated metabolic regulation in tumor suppression. Seminars in cancer biology. 2022;85:4-32
13. Vousden KH, Prives C. Blinded by the Light: The Growing Complexity of p53. Cell. 2009;137:413-31
14. Sabapathy K, Lane DP. Therapeutic targeting of p53: all mutants are equal, but some mutants are more equal than others. Nat Rev Clin Oncol. 2018;15:13-30
15. Zhou X, Hao Q, Lu H. Mutant p53 in cancer therapy-the barrier or the path. J Mol Cell Biol. 2019;11:293-305
16. Muller PA, Vousden KH. Mutant p53 in cancer: new functions and therapeutic opportunities. Cancer Cell. 2014;25:304-17
17. Munro AJ, Lain S, Lane DP. P53 abnormalities and outcomes in colorectal cancer: a systematic review. Br J Cancer. 2005;92:434-44
18. Tan Z, Ko HM, Naji P, Zhu R, Wang J, Huang S. et al. Tripartite motif-containing protein 26 promotes colorectal cancer growth by inactivating p53. Cell Death Differ. 2025;32:1142-52
19. Chen Y, Hao Q, Wang S, Cao M, Huang Y, Weng X. et al. Inactivation of the tumor suppressor p53 by long noncoding RNA RMRP. Proc Natl Acad Sci U S A. 2021;118:e2026813118
20. Liao Q, Deng J, Tong J, Gan Y, Hong W, Dong H. et al. p53 induces circFRMD4A to suppress cancer development through glycolytic reprogramming and cuproptosis. Molecular cell. 2025;85:132-149.e7
21. Cao M, Gan Y, Huang Y, Tong J, Xiong C, Chen Y. et al. p53 activates circASCC3 to repress R-loops and enhance resistance to chemotherapy. Proc Natl Acad Sci U S A. 2025;122:e2415869122
22. Huang Y, Xiong C, Wang C, Deng J, Zuo Z, Wu H. et al. p53-responsive CMBL reprograms glucose metabolism and suppresses cancer development by destabilizing phosphofructokinase PFKP. Cell Rep. 2023;42:113426
23. Chen S, Hao Q, Gan Y, Tong J, Xiong C, Liao Q. et al. p53 transcriptionally activates DCP1B to suppress tumor progression and enhance tumor sensitivity to PI3K blockade in non-small cell lung cancer. Cell death and differentiation. 2025;32:1722-1733
24. Hao Q, Chen J, Liao J, Huang Y, Gan Y, Larisch S. et al. p53 induces ARTS to promote mitochondrial apoptosis. Cell Death Dis. 2021;12:204
25. Zhou D, Quach KM, Yang C, Lee SY, Pohajdak B, Chen S. PNRC: a proline-rich nuclear receptor coregulatory protein that modulates transcriptional activation of multiple nuclear receptors including orphan receptors SF1 (steroidogenic factor 1) and ERRalpha1 (estrogen related receptor alpha-1). Mol Endocrinol. 2000;14:986-98
26. Zhou D, Chen B, Ye JJ, Chen S. A novel crosstalk mechanism between nuclear receptor-mediated and growth factor/Ras-mediated pathways through PNRC-Grb2 interaction. Oncogene. 2004;23:5394-404
27. Wang Y, Chen B, Li Y, Zhou D, Chen S. PNRC accumulates in the nucleolus by interaction with B23/nucleophosmin via its nucleolar localization sequence. Biochim Biophys Acta. 2011;1813:109-19
28. Gaviraghi M, Vivori C, Pareja Sanchez Y, Invernizzi F, Cattaneo A, Santoliquido BM. et al. Tumor suppressor PNRC1 blocks rRNA maturation by recruiting the decapping complex to the nucleolus. EMBO J. 2018;37:e99179
29. Hoh J, Jin S, Parrado T, Edington J, Levine AJ, Ott J. The p53MH algorithm and its application in detecting p53-responsive genes. Proc Natl Acad Sci U S A. 2002;99:8467-72
30. Stambolic V, MacPherson D, Sas D, Lin Y, Snow B, Jang Y. et al. Regulation of PTEN transcription by p53. Mol Cell. 2001;8:317-25
31. Coronel L, Riege K, Schwab K, Förste S, Häckes D, Semerau L. et al. Transcription factor RFX7 governs a tumor suppressor network in response to p53 and stress. Nucleic Acids Res. 2021;49:7437-56
32. Oliner JD, Pietenpol JA, Thiagalingam S, Gyuris J, Kinzler KW, Vogelstein B. Oncoprotein MDM2 conceals the activation domain of tumour suppressor p53. Nature. 1993;362:857-60
33. Wade M, Li YC, Wahl GM. MDM2, MDMX and p53 in oncogenesis and cancer therapy. Nat Rev Cancer. 2013;13:83-96
34. Wang SP, Wang WL, Chang YL, Wu CT, Chao YC, Kao SH. et al. p53 controls cancer cell invasion by inducing the MDM2-mediated degradation of Slug. Nat Cell Biol. 2009;11:694-704
35. Kim T, Veronese A, Pichiorri F, Lee TJ, Jeon YJ, Volinia S. et al. p53 regulates epithelial-mesenchymal transition through microRNAs targeting ZEB1 and ZEB2. J Exp Med. 2011;208:875-83
36. Kim NH, Kim HS, Li XY, Lee I, Choi HS, Kang SE. et al. A p53/miRNA-34 axis regulates Snail1-dependent cancer cell epithelial-mesenchymal transition. J Cell Biol. 2011;195:417-33
37. Zhou X, Cao B, Lu H. Negative auto-regulators trap p53 in their web. J Mol Cell Biol. 2017;9:62-8
38. Karni-Schmidt O, Lokshin M, Prives C. The Roles of MDM2 and MDMX in Cancer. Annu Rev Pathol. 2016;11:617-44
39. Moll UM, Petrenko O. The MDM2-p53 interaction. Mol Cancer Res. 2003;1:1001-8
40. Beroukhim R, Mermel CH, Porter D, Wei G, Raychaudhuri S, Donovan J. et al. The landscape of somatic copy-number alteration across human cancers. Nature. 2010;463:899-905
41. Muñoz-Fontela C, Mandinova A, Aaronson SA, Lee SW. Emerging roles of p53 and other tumour-suppressor genes in immune regulation. Nat Rev Immunol. 2016;16:741-50
42. Efe G, Rustgi AK, Prives C. p53 at the crossroads of tumor immunity. Nat Cancer. 2024;5:983-95
Author contact
Corresponding authors: Xiang Zhou, Email: xiangzhouedu.cn; Chunmeng Wang, Email: cmwang1975com; Qian Hao, Email: haoqianedu.cn