Impact Factor ISSN: 1449-2288




Int J Biol Sci 2027; 23(1):444-461. doi:10.7150/ijbs.142712 This issue Cite
Research Paper
Morc4 suppresses breast cancer lung metastasis by restricting Tslp-driven Naïve T cell accumulation
Xin Zhang1,2, Min Deng1,2,3, Sek Man Su1,2, Yuqing Wang1, Haipeng Lei1, Tingting An1,3, Jianjie Li1, Jun Xu1, Kai Miao1,2, Xiaoling Xu1,2 
1. Ministry of Education Frontiers Science Center for Precision Oncology, University of Macau, Taipa, Macau SAR, China.
2. Zhuhai UM Science & Technology Research Institute, Hengqin, China.
3. Faculty of Synthetic Biology, Shenzhen University of Advanced Technology, Shenzhen 518107, China.
Received 2026-5-1; Accepted 2026-10-11; Published 2027-1-1
Abstract
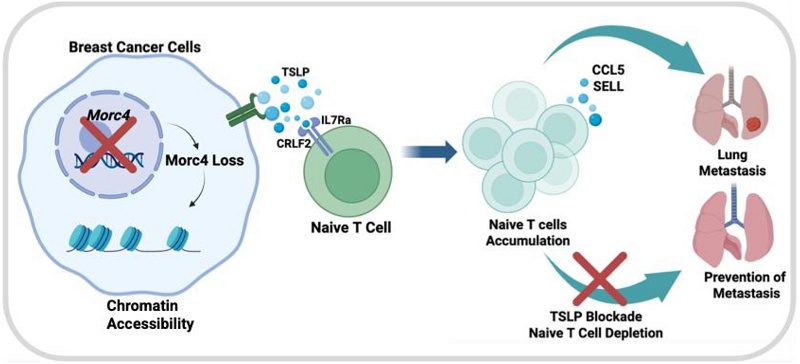
Breast cancer lung metastasis remains a leading cause of cancer-related mortality, yet the tumor cell-intrinsic mechanisms governing metastatic dissemination within an intact immune microenvironment are poorly understood. Here, an in vivo genome-wide CRISPR/Cas9 knockout screen is performed in murine triple-negative breast cancer (TNBC) models, identifying Morc4 as a previously uncharacterized suppressor of lung metastasis. Loss of Morc4 promotes metastatic outgrowth specifically in immunocompetent hosts, increasing chromatin accessibility and thymic stromal lymphopoietin TSLP secretion from tumor cells. This activates the Il7rα axis on T cells, driving accumulation of naïve T cells and elevated secretion of CCL5 and SELL from Naïve T cell to promote metastatic behavior. In human TNBC, low MORC4 expression correlates with naïve T cell enrichment. Notably, TSLP neutralization or Naïve T cell depletion suppresses tumor growth and metastasis in Morc4-deficient contexts. These findings establish Morc4 as an epigenetic regulator of metastasis and identify the Tslp-Il7rα axis as a potential therapeutic target.
Keywords: breast cancer, metastasis, naïve T cell, TSLP-IL7Ra axis, microenvironment, CRISPR/Cas9
Introduction
Breast cancer accounts for approximately 25% of all new cancer cases in women worldwide [1]. Among these patients, about 10% are initially diagnosed with distant metastasis, most commonly involving the bone, lung, liver, and brain [2]. Lung metastasis represents 21-32% of distant recurrences in breast cancer and is associated with a particularly poor prognosis, conferring a median survival of only 25 months following diagnosis [3]. Despite its clinical significance, treatment options for metastatic breast cancer remain limited due to the lack of effective targeted strategies [4]. Thus, identifying tumor cell-intrinsic factors that promote lung metastasis is critical for the development of more effective therapeutic interventions.
Metastasis is not solely cell-autonomous but is profoundly influenced by the tumor microenvironment (TME), particularly the immune compartment [5]. While the role of cytotoxic T cells in anti-tumor immunity is well established [6], the contribution of less differentiated T cell subsets, such as naïve T cells in cancer progression, remains poorly understood. Moreover, the molecular mechanisms by which tumor cells epigenetically remodel their gene expression programs to shape the immune landscape and promote metastasis are only beginning to emerge.
MORC (MORC family CW-type zinc finger) proteins are conserved nuclear proteins characterized by several domains, including a GHKL-type ATPase domain, a CW-type zinc finger domain, a MORC-S5 domain, and a coiled-coil domain [7]. Current research on MORC family members include MORC1, MORC2, and MORC3 has primarily focused on their roles in epigenetic regulation, chromatin remodeling, and oncogenic function in cancer progression [8]. These genes are frequently overexpressed in multiple cancer types, including breast and liver cancer, and their high expression correlates with poor overall survival, supporting their classification as putative oncogenes. However, mutations in MORC family genes have also been identified in tumors and other diseases [9]. Within this family, MORC1 has been implicated in breast cancer development [10], MORC2 functions as an oncogene in liver [11] and breast cancer [12], and MORC3 has been identified as a regulator of bone homeostasis [13]. In contrast, MORC4 remains the least understood family member. Its ATPase activity is dependent on binding to DNA and histone H3K4me3. It has been shown to promote nuclear body formation, stabilize nucleosome core particles, enhance DNA wrapping around the histone core, and restrict access to DNA-associated proteins, thereby facilitating S-phase progression [14]. MORC4 is overexpressed in Acute pancreatitis [15] and other cancers [16]. Nevertheless, its specific function in cancer remains largely unexplored. Whether MORC4 regulates chromatin accessibility to control the expression of immunomodulatory genes and whether such regulation influences metastatic progression are important unanswered questions.
In this study, we performed an in vivo genome-wide CRISPR/Cas9 knockout screen in 4T1 cells and identified Morc4 as a previously uncharacterized suppressor of lung metastasis. Through integrated epigenomic, transcriptomic, and functional analyses, we show that loss of Morc4 leads to increased deposition of H3K27ac and enhanced chromatin accessibility. We demonstrated that thymic Stromal Lymphopoietin (TSLP), a pleiotropic, epithelial-cell-derived cytokine that functions primarily as an "alarmin"[17], is highly elevated in Morc4 deficient tumor cells. The upregulated TSLP activates the Il7rα signaling axis in T cells, promoting the intratumoral accumulation of naïve CD4⁺ and CD8⁺ T cells exhibiting impaired differentiation. These accumulated naïve T cells, in turn, secrete CCL5 and SELL, which may bind to cognate receptors on tumor epithelial cells and promote tumor cells outgrowth and metastasis. Notably, therapeutic targeting of the Tslp-Il7rα pathway via TSLP neutralization or antibody-mediated depletion of naïve T cells could effectively suppresses primary tumor growth and lung metastasis in Morc4-deficient contexts.
Collectively, our study identifies Morc4 as a breast cancer metastasis suppressor that operates through epigenetic silencing of a pro-metastatic cytokine signaling axis. These findings establish a linking of chromatin regulation in cancer cells to T cell differentiation, and they reveal targetable vulnerabilities for the treatment of MORC4-low TNBC.
Materials and Methods
Mice
The two mice strains were utilized in this study: balb/c mice and Nude/ICR mice. To establish tumor allografts that mimic breast cancer lung metastasis in patients, 4T1 and EMT6 cell line (5 × 10^5 cells) were implanted into the right mammary fat pads of nude mice (4 weeks old) and balb/c mice (6-8weeks old). Tumor samples were collected when the tumors were smaller than or approximately 2 cm in diameter, which is the maximum tumor size permitted by the University of Macau Animal Ethics Committee. Tumor volume (in mm^3) was calculated using the formula: V = 0.5 × H^2 × L, where H is the shorter diameter and L is the longer diameter.
Cell Line
MDA-MB-231 cell line (catalog CRM-HTB-26) and human embryonic kidney (HEK) 293T cells (catalog ACS-4500) were acquired from the ATCC and they were cultured in Dulbecco's Modified Eagle's Medium (DMEM; Gibco Life Technologies, 11965092, USA). 4T1 cells, a triple-negative breast cancer (TNBC) line lacking p53 but wild-type for Brca1 and Brca2, were cultured in RPMI 1640 medium (Gibco Life Technologies, 11875093). EMT6 cells were also cultured in RPMI 1640. All culture media were supplemented with 10% fetal bovine serum (Gibco Life Technologies, 26140-079) and 100IU penicillin-streptomycin (10000 IU/ml: 100x, Gibco, 15140163).
Lentivirus Preparation and Transfection
For library lentivirus production, Lipofectamine 3000 (Thermo Fisher) was used following the manufacturer's protocol. HEK293T cells at ~90% confluency in 10-cm dishes were transfected with a mix of 1.5 mL Opti-MEM, 41 µL Lipofectamine 3000 (Tube 1) and 1.5 mL Opti-MEM, 12 µg packaging mix (8 µg GpCMV-DR8.2 + 4 µg pCMV-VSV-G), 4.3 µg GeCKOv2 sgRNA (Addgene), and 35 µL P3000 (Tube 2). After 10-20 min incubation, the mix was added dropwise to cells. Medium was replaced after 6 h. Viral supernatant was harvested at 48 h, centrifuged (2000 rpm, 15 min), and filtered (0.45 µm). 20 mL fresh virus was added to 4T1-GFP cells for 48 h, followed by puromycin selection to establish stable lines.
For single-gene knockout/overexpression, lentivirus was produced using 3 µg GpCMV-DR8.2, 2 µg pCMV-VSV-G, 4 µg transfer plasmid, and 27 µL PEI (1:3 DNA:PEI ratio) incubated for 20 min. Viral titer was tested on 293T cells. 4T1, EMT6, or 231 cells were infected in 6-well plates for 48 h, selected with puromycin, and Clover-positive cells were sorted by FACS after culture in RPMI 1640 for ≥ 48 h.
Next-generation Sequencing of the Amplified sgRNA Library and Statistical Analysis
The initial PCR used custom primers (forward: 5'-CCCGAGGGGACCCAGAGAG-3'; reverse: 5'-GCGCACCGTGGGCTTGTAC-3') to amplify a 400-bp region around the sgRNA cleavage site. Cycling conditions were: 98 °C for 30 s; 24 cycles of 98 °C for 1 s, 62 °C for 5 s, and 72 °C for 35 s; and a final 72 °C for 1 min. Products were purified (Qiagen-20051) and amplified in a second round using barcoded primers and high-fidelity polymerase, enabling multiplex sequencing on a NextSeq run. Sequencing was performed on an Illumina HiSeq X Ten system. sgRNA reads were analyzed with MAGeCK-VISPR (default parameters) [36]. Enrichment in metastatic vs. primary tumors was calculated as a ratio; genes with a higher ratio in BALB/c vs. nude mice were considered immune-related suppressors. sgRNAs enriched in single organs were deemed organ specific. Abundances were visualized with Complex Heatmap (v2.22.0) [38].
CRISPR Library Screening Strategy
Raw sgRNA read counts were normalized, converted to counts per million (CPM) to adjust for sequencing depth, and log₂-transformed. To control the false discovery rate (FDR), p-values were adjusted for multiple comparisons using the Benjamini-Hochberg method; significance was set at an FDR < 0.05 and a fold change > 0.25. To identify immune-dependent enrichment, we calculated the difference in log₂ CPM for each sgRNA between BALB/c and nude mice in the primary tumor group log2 CPM (BALB/c-input cell) -log2 CPM (nude-input cell). Applying a threshold difference of > 3 (approximately an 8-fold difference between hosts) yielded 1,012 sgRNAs.
Fat Pad Implantation of Tumor Cell
Cells transduced with GeCKOv2 sgRNA were washed in 1x phosphate-buffered saline (PBS) and adjusted to a concentration of 1x10^6 cells/ml. A volume of 60 µL of these tumor cells was injected into the fourth pair of mammary glands of the mice. For single gene knockout or overexpression experiments, 5x10^5 cells per mouse were injected. Tumor volumes were measured every 3 days and tumors collected on day 16 for nude mice and day 30 for balb/c mice.
Statistical Analysis of Bulk Tumor Sample
Bulk RNA-Seq was performed, and the raw data were preprocessed using Trim Galore (v0.6.7) to remove low-quality bases and discard reads shorter than 36 bp. Detailed information about is available at http://www.bioinformatics.babraham.ac.uk/projects/trim_galore/. The cleaned paired-end reads were subsequently aligned to the mouse reference genome (mm10) using hisat2 (v2.2.1) [40] with default parameters. Gene-level reading counts were then obtained using feature Counts (v2.0.1) [40].
Differentially expressed genes were identified using a negative binomial generalized linear model fitted to the median of ratios normalized values, as recommended in the DESeq2 (v1.41.0) R package manual [41]. Differentially expressed genes were classified by cutoffs of Benjamini-Hochberg with adjusted p < 0.05 and log2FoldChanges of at least 0.5 in absolute value.
IF/IHC Staining of Tissue Slides
Paraffin-embedded tissues are sectioned at 5 μm thickness, mounted on slides, deparaffinized in xylene, and rehydrated through graded alcohols. Slides are washed with PBS five times, then subjected to heat-induced antigen retrieval using R-Buffer-A (10×). After cooling, sections are permeabilized with 0.1-0.5% Triton X-100 in PBS for 10-20 min at RT, followed by three PBS washes (5 min each). Sections are incubated with blocking buffer (50% 3% BSA + 50% Animal-Free Blocker) for 60 min at RT (or overnight at 4 °C for IHC).
IHC-Specific Steps: 1, After antigen retrieval, block endogenous peroxidase with 3% H₂O₂ in methanol for 20 min at RT, then wash with PBS three times (5 min each). 2, Incubate with primary antibody overnight at 4°C. 3, Wash with PBS three times (5 min each). 4, Incubate with HRP-conjugated secondary antibody for 1h at RT. 5, Detect signals using DAB substrate, then counterstain with hematoxylin. 6, Rinse under running tap water for 5 min. 7, Dehydrate through graded alcohols, clear in xylene (5 min), air-dry, and mount with DPX mounting medium and coverslip.
Single-Cell Dissociation, Library Preparation, and Sequencing
Primary tumors were minced and digested in 10 mL of Digestion I medium (DMEM/F12 with 5% FBS, 5 μg/mL insulin, 500 ng/mL hydrocortisone, 10 ng/mL EGF, 300 U/mL collagenase III, and 100 U/mL hyaluronidase) for 2 h at 37 °C with rotation. RBCs were lysed with 1× RBC lysis buffer (3 min, RT), washed with PBS, filtered through a 40 μm strainer, and centrifuged at 300×g for 5 min (washed twice in serum-free medium). Single-cell RNA-seq libraries were generated using the 10x Chromium Next GEM Single Cell 3' Kit (v3.1) and sequenced on an Illumina HiSeq X-Ten. Reads were aligned to GRCm39 using CellRanger (v8.0) to generate cell matrix files.
Single-Cell Data Processing and Quality Control
Data were imported into Seurat (v5.1.0) in R. Cells with 200-10,000 transcripts, > 200 detected genes, and < 10% mitochondrial reads were retained. Doublets were removed with Doublet Finder. Batch effects were corrected using scVI. The final cohort comprised 87,614 cells for downstream analysis.
Western Blot
Cells or tissues are lysed in RIPA buffer (10 mM Tris-HCl, pH 8.0, 150 mM NaCl, 1% Triton X-100, 1% deoxycholic acid, 0.1% SDS, and a protease inhibitor cocktail). The lysate was centrifuged at 10,000×g for 20 minutes at 4 °C, the protein concentration is measured using a BCA assay. (Thermo Scientific™ Pierce™ BCA Protein Assay Kit, #23227). Protein samples were denatured in 5× loading buffer (Beyotime-P0286) and heated at 95 °C for 10 minutes. The denatured proteins were then transferred from 8-12% SDS-polyacrylamide gels to polyvinylidene difluoride (PVDF) membranes (Millipore) or nitrocellulose membrane. The membrane is incubated with a blocking solution (e.g., 3% BSA in TBS-T) for 1 hour at room temperature, The membrane was put in the primary antibody specific to the target protein overnight:Morc4(1:250,LisBo,LSC146327).βactin(1:4000,Sigma,A5316).H3(1:1000,abcam,ab10799).H3K27ac(1:1000,sigma,07360).H3K27me3(1:1000,sigma,07-449). The membrane is then incubated with a secondary antibody that binds to the primary antibody. The intensity of the bands is quantified using ImageJ, with the values normalized to the first band. and results are normalized to β-actin levels.
Cross-linking Chromatin Immunoprecipitation (ChIP-Qpcr)
4T1 parental, Morc4-KO, and overexpression cells were grown to 90% confluence in 10 cm dishes. Cross-linking was performed with 1% formaldehyde for 10 min at RT with rotation, then quenched with 125 mM glycine for 5 min. Cells were washed with PBS, scraped, pelleted (300×g, 5 min, 4 °C), and lysed in 300 μL Buffer B on ice for 10 min. Nuclei were pelleted (1700×g, 5 min, 4 °C), resuspended in Buffer C, and chromatin was sheared to 200-500 bp in Buffer D3 by sonication (M220). Sheared chromatin was diluted 1:10 and pre-cleared with protein A magnetic beads (1 h, 4 °C), then incubated with specific antibody overnight at 4 °C with rotation. Beads were added for 2 h at 4 °C, and protein-DNA complexes were eluted. Cross-links were reversed (65 °C, 4-6 h or overnight) with Proteinase K, RNase A, and 5M NaCl. DNA was purified using Qiagen QIAquick PCR Purification Kit and analyzed by qPCR.
RNA Isolation and Quantitative RT-PCR
RNA was extracted using TRIzol reagent (Thermo Fisher Scientific) following the manufacturer's protocol. Complementary DNA (cDNA) was synthesized using the QuantiTect Reverse Transcription Kit (Qiagen, catalog no. 05313). Real-time PCR was performed with the FastStart SYBR Green Master Mix (Roche, catalog no. 04913850001) on a Quant Studio 7 Flex Real-Time PCR System (Thermo Fisher Scientific). Relative quantification of gene expression was normalized to the levels of 18S rRNA.
Flow Cytometry
Single-cell suspensions were collected and washed once with PBS. The supernatant was removed, and the cells were resuspended at a concentration of 3-5×10^6 cells in 100 μl of Flow Cytometry Staining Buffer (1× PBS + 10% FBS). The cells were incubated with 0.1-10 μg/ml of antibodies (CD25-APC, Biolegend-102012; CD44-PE, Biolegend-103024) on ice for 30 minutes to 1 hour at 4 °C in the dark to prevent photobleaching. After incubation, the cells were washed again with FACS Buffer and then incubated with Brilliant Violet 510 (1:1000) for 15 minutes at room temperature. The cells were washed with 1 ml of PBS and centrifuged for 5 minutes at 300×g at 4 °C. Finally, the cells were resuspended in 200 μl of FACS Buffer, filtered through a 40 μm cell strainer, and loaded into the flow cytometer (Cyto FLEX 5). data were analyzed using Flowjo 10.0 software.
CyTOF Analysis
Single-cell suspensions (prepared as described) were resuspended at 2×10⁷ cells/mL in 500 µL serum-free medium. An equal volume of 10 µM cisplatin was added (final 5 µM) and incubated for 5 min at RT. Cells were centrifuged at 300×g for 5 min and washed once with Maxpar Cell Staining Buffer. Fifty microliters of antibody cocktail were added and incubated for 30 min at RT. Cells were washed twice with staining buffer, then resuspended in 1 mL cell intercalation solution (125 nM Cell-ID Intercalator-Ir in Maxpar Fix and Perm Buffer) and incubated overnight at 4 °C.
On the day of analysis, cells were washed twice with staining buffer and once with Maxpar water. Concentration was adjusted to 2.5-5×10⁵ cells/mL with EQ Four Element Calibration Beads. Samples were analyzed on a Helios CyTOF (Fluidigm). Ionized metal tags were detected by time-of-flight mass spectrometry to generate single-cell mass spectra.
FCS files were manually gated in FlowJo 7.6.1. CyTOF data were analyzed using the R-based cytofWorkflow. Cell population percentages were analyzed with GraphPad Prism 8.
ChIP-sequence
ChIP-seq was performed on three biological samples: MDA-MB-231 control cells (231-control), MDA-MB-231 MORC4 knockout cells (231-Morc4-KO), and MDA-MB-231 MORC4 overexpressing cells (231-Morc4-OE). Cells were crosslinked with 1% formaldehyde for 10 minutes at room temperature, and the reaction was quenched with 125 mM glycine. Chromatin was extracted, sheared to an average fragment size of 200-500 bp by sonication, and immunoprecipitated using an anti-MORC4 antibody (ab121099,abcam). The immunoprecipitated DNA was purified, and libraries were prepared followed by sequencing. Library preparation and sequencing were performed by igenebook company.
Co-culture of Naïve T Cell and Tumor Cell
Spleens from wild type balb/c mice were collected and washed once in 1x PBS. The spleens were then crushed using a 3 ml syringe plunger on a 100 µm cell strainer. The cells were rinsed several times with ice-cold HBSS medium and centrifuged at 400 x g for 15 minutes at 4 °C. The supernatant was discarded, and 1x RBC lysis buffer was added to the tube, followed by incubation on ice for 3 minutes. To stop the lysis, 5 ml of T cell culture medium was added, and the sample was centrifuged at 400 x g for 5 minutes. The cells were resuspended in 10 ml of fresh ice-cold PBS and counted. Naive T cell isolation was performed according to the instructions of the Pan-naïve T cell isolation kit (STEMCELL-19848). The upper layer of a 6-well plate was pre-cultured with 2 ml of 1640 medium for 2 hours to increase permeability. The lower layer of the dish was coated with CD3 and CD28 antibodies (Biolegend-100340, for T cell activation), anti-CD28 (Biolegend-102116 for T cell activation) for at least 1 hour, then washed three times with 1x PBS. Tumor cells (0.5 x 10^6) were cultured in the upper layer, and 3 x 10^6 naive T cells were cultured in the lower dish with 2 ml of RPMI 1640 medium. The cells were covered with a lid and incubated at 37 °C in 5% CO2 and 100% humidity for 3 days. After incubation, the cells were collected for qPCR experiments.
ATAC Sequencing and Peak Calling
4T1 cell with different genotype were treated with a hyperactive Tn5 transposase mutant to tag the target DNA with adapters, each sample will require a combination of one i7 Indexed Primer and one i5 Indexed Primer in the PCR amplification reaction. then the libraries are ready for quantification and sequencing (ATAC-seq-Kit-53150). All ATAC-seq reads were trimmed using TrimGalore (v0.6.4) to remove primers and low-quality bases, with reads smaller than 36 bp being discarded. The quality of the trimmed reads was then assessed using fastq (v0.23.4). The paired-end reads were aligned to the GRCm39 reference genome using bowtie2 (Langmead and Salzberg, 2012), with a maximum insert size of 2000 bp and the parameters --no-mixed and --no-discordant. Reads with a mapping quality below 35 were discarded. Duplicates were removed using sambamba and reads mapping to blacklist regions and mitochondrial DNA were also excluded. Peaks were called on the aligned fragments using the macs2 (Zhang et al., 2008) pipeline with a q-value cutoff of 0.05 and overlapping peaks among replicates were merged.
Elisa
Cancer cell from different genotype were cultured in the medium, and then. Collected the supernatant and centrifuge at 3000rpm for 10 mi. Keep the supernatant for the processing of Elisa according to the kit instruction Tslp-Mouse Elisa kit (Easy Biotech-shanghai). The plate after incubating with substrate was measured the absorbance at the 450nm using a plate reader.
Cell-cell Communication Analysis
Using scRNA-seq data, cell-cell communication interactions were identified with the help of CellCall, an R package that analyzes ligand-receptor expression levels. This approach was used to investigate whether there is communication between tumor epithelium cells and Naïve T cells.
Statistical Analysis
To quantify tumor cell or immune cell density, images of tumor sections with immunofluorescence (IF) staining were captured and analyzed using ImageJ software. Statistical analyses were conducted with GraphPad Prism 8.0. Differences between two groups were compared using unpaired two-tailed Student's t-tests. For comparisons involving multiple groups, one-way ANOVA or two-way ANOVA were employed. Correlations were assessed using two-tailed Pearson tests. Statistical details, including means and significance values, are provided in the text or figure legends. In graphs, bars represent either the range or standard deviations (SDs), as specified in the legends. Survival benefits for animal and human datasets were evaluated using Kaplan-Meier analysis. P values less than 0.05 were considered statistically significant.
Results
Morc4 is a Breast Cancer Metastasis Suppressor Identified by In vivo CRISPR Screening
To identify metastasis suppressor genes in breast cancer, we conducted an in vivo genome-wide CRISPR/Cas9 knockout screen. We used the GeCKOv2 library (The GeCKOv2 sgRNA library consists of two sub libraries, A and B, each containing three sgRNAs per gene, for a total of 130,209 sgRNAs targeting 20,611 genes. This study utilized only the B sub library of GeCKOv2.) in murine 4T1 triple-negative breast cancer cells, followed by functional validation and mechanistic studies to identify the gene whose loss leads to the greatest increase in metastasis in immunocompetent mice. (Figure 1A). Primary tumors and lung metastases were collected at serial time points (Figure S1A) in both nude (n = 9) and Balb/c mice (n = 9). In nude mice, library-transduced cells exhibited accelerated primary tumor growth and a significant increase in lung metastasis nodules from day 18 compared to controls (Figures 1B, S1B, S1C). In balb/c mice, while primary tumor did not show growth advantage, metastatic burden was still markedly elevated by day 30 (Figure s1C, S1D, S1E), This indicates that genetic perturbations promote tumor growth in both nude mice (which lack effector T cells) and immunocompetent Balb/c mice, relative to their respective control groups.
Breast Cancer Metastasis: Unravelling the Role of Tumour Suppressor Genes Through Genome-wide CRISPR Screening. A. Design of the CRISPR/Cas9(GeCKOv2-sgRNA) library screening by Bio Render. B. The quantity of nodules in the metastatic lungs of nude mice (n = 3 mice per time point per genotype, with three time points analyzed ,total n = 9 biologically independent mice per genotype). student's t-test, with p < 0.05 considered significant. C. The quantity of nodules in the metastatic lungs of balb/c mice (n=3) at three time points. student's t-test, with p < 0.05 considered significant. D. Pearson's correlation statistic between sgRNA enrichment of lung and primary tumor in both balb/c and nude mice. Pearson's correlation test. E. The Venn diagram depicts the intersection of 1,012 sgRNAs that are preferentially enriched in BALB/c over nude cells (log₂CPM difference >3) with known human suppressor genes. Significance was determined at FDR <0.05 and fold change >0.25. F. Average number of enriched sgRNAs targeting the 14 common candidate genes in primary tumors and lung metastases from balb/c mice. (14 common genes were identified as having all corresponding sgRNAs consistently enriched across the 36 tumors). G. RNA expression levels of MORC4 in human triple-negative breast cancer (TNBC) samples (n=2986 cells) compared to healthy individuals (n=3328 cells).
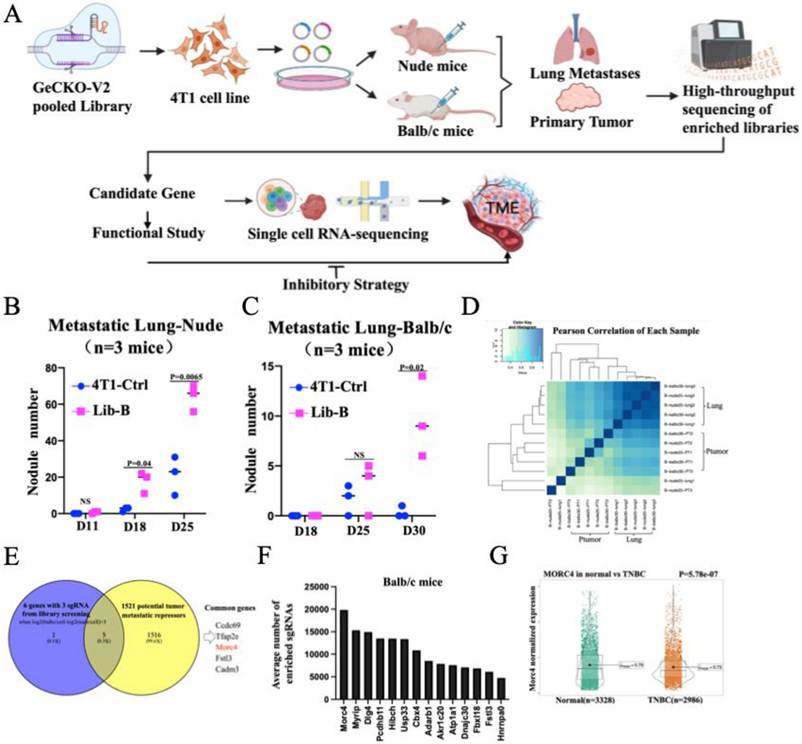
To identify genes involved in lung metastasis, we performed an in vivo CRISPR-Cas9 knockout screen using the GeCKO v2 Library B. Primary tumors and metastatic lung tumors were collected from BALB/c and nude mice at three time points post-injection, along with the original plasmid library and pre-injection input cells (3 replicates each) and subjected to deep sequencing. Raw sgRNA read counts were normalized to CPM and log₂-transformed.
Quality control assessment revealed high concordance among replicates: Pearson correlation coefficients were consistently > 0.99 for both the plasmid library replicates and the pre-injection input cell replicates (Figure S1F), confirming robust sequencing quality. A high correlation was also observed between primary tumor and metastatic lung tumor samples (Figure 1D).
We first compared normalized read counts between primary tumor samples and the input reference to calculate fold change (tumor vs. input) for defining sgRNA enrichment or depletion. This analysis recovered some known tumor suppressors and oncogenes, validating the screening approach (Supplementary Table S2-4).
To specifically identify immune-dependent enrichment, we calculated the difference in sgRNA abundance between BALB/c and nude mouse primary tumors: Δlog₂ CPM = log₂ CPM(BALB/c-input) - log₂ CPM(nude-input). Applying a threshold of Δlog₂ CPM > 3 (≈8-fold difference) yielded 1,012 sgRNAs. Among these, six genes were targeted by all three independent sgRNAs, with MORC4 emerging as a top candidate (Supplementary Table S5-6). Cross-referencing these six genes against a published dataset of 1,521 human tumor suppressor genes (Reference 18) revealed five overlapping genes, strongly supporting their biological relevance (Supplementary Table S7, Figure 1E).
By calculating the average sgRNA enrichment per gene across all 36 tumor samples from both mouse strains, we identified 14 common genes (one duplicated gene:Usp33). Among those, Morc4 ranked as the top hit overall (Figure S1G and Supplementary Table S8). Specifically, in balb/c mice, sgMorc4 was also the most enriched sgRNA (Figure 1F). Notably, while sgMorc4 ranked eighth in primary tumors, it became the most enriched in lung metastases (Figures S1H, S1I and Supplementary Table S8). This striking contrast underscores a specific role for Morc4 in promoting metastatic dissemination to the lung.
In human triple-negative breast cancer (TNBC) samples, MORC4 expression showed a modest but statistically significant decrease in triple-negative breast cancer (TNBC) compared to healthy controls [19] (Figure 1G). Collectively, our results identify Morc4 as a conserved metastasis suppressor in breast cancer playing a critical role in immunocompetent settings, highlighting its potential clinical relevance in TNBC.
Morc4 Deficiency Drives Immune Evasion in Breast Cancer Lung Metastasis in Mice
To functionally validate Morc4 as a metastasis suppressor, we established Morc4-knockout models in 4T1 cells using three independent sgRNAs. The efficient deletion at both mRNA and protein levels was confirmed by sequencing, Q-PCR and Western blot (Figure 2A, Figure S2A-B).
Morc4 Deficiency Drives Immune-Evasion and Metastatic Outgrowth in Murine Breast Cancer Models. A. Morc4 Protein levels in the clover-tagged 4T1 cell with the expressions of either sg1Morc4, sg2Morc4, or sg3Morc4 by Western blots. B. Representative Images of GFP-positive metastatic nodules in the lungs of balb/c mice after implantation of sgMorc4 and parental 4T1 cells into the fat pad for 30 days. C. The Quantification of nodule number in the metastasis lung tissue as same showed in Figure 2B. (n=12 mice in Morc4-KO, n=15 mice in Ctrl). D. Immunohistochemical (IHC) staining using the K14 antibody in metastatic lung samples from balb/c mice as same in Figure 2B. E. The quantification of K14 antibody-positive cells from 16 randomly selected views of three mice in Figure 2D were counted with Image J software. F. Protein levels of the MORC4 gene in the clover-tagged 4T1 cell and Luc-GFP labeled 4T1 cells with transfection of Morc4 cDNA by Western blots. G. Representative images of GFP-positive metastatic nodules in the lungs of balb/c mice post-implantation of 4T1 parental cells and 4T1 cells overexpressing Morc4 for 35 days (n=6 mice). H. Quantification of nodules on the surface of lung tissue from balb/c mice as same showed in Figure 2G. I. Images of spleen and primary tumors after implantation of Morc4-KO 4T1 cells,Morc4-cDNA-reconstituted Morc4-KO 4T1 cells and parental 4T1 cells into the fat pad of balb/c mice for 25 days. (n=6 mice in each group). J. The spleen weight (g) and tumor weight of balb/c mice shown in Figure 2I. Student's t-test, with p < 0.05 considered significant. K. Images of lung tissue from balb/c mice same as shown in Figure 2I. L. Quantification of nodules on the surface of metastatic lungs in balb/c mice same as shown in Figure 2K. Student's t-test, with p < 0.05 considered significant.
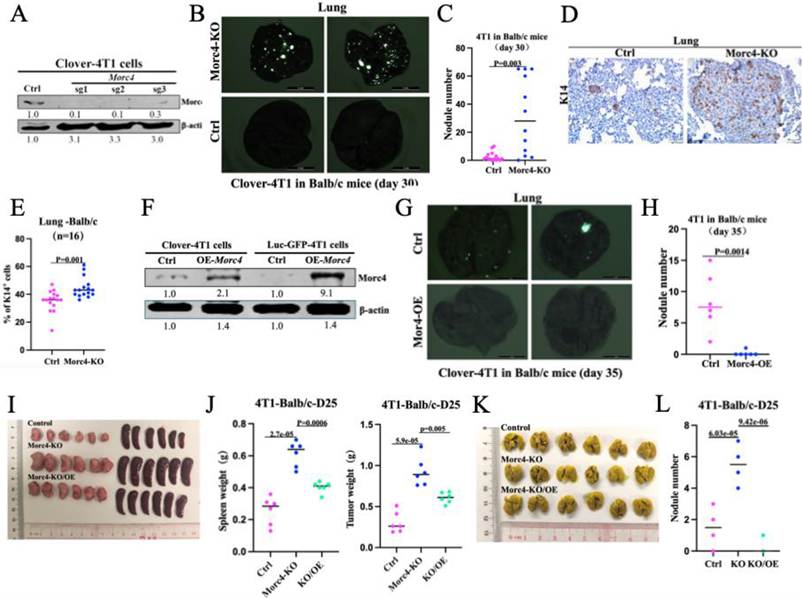
To evaluate the in vivo effect of Morc4 loss on breast cancer lung metastasis, we utilized two mouse models: T cell-deficient nude mice and immunocompetent balb/c mice. And inject the transfected 4T1 cells into mammary gland of mice. In nude mice, no significant differences were observed in lung metastatic modules, lung size, spleen size, or primary tumor burden when the largest tumor size reached at end point between the parental control and sgMorc4 mice (Figure S2C-E), suggesting that loss Morc4 in mammary tumor cells did not have affect lung metastasis in the T cell-deficient nude mice. Conversely, in balb/c mice, Morc4 deficiency led to a significant increase in lung metastatic nodules and splenomegaly at day 30 (Figure 2B-C, S2F-G) suggesting that loss of Morc4 may impair adaptive immune effector function. To evaluate the lung metastasis caused by migration of mammary tumor cells, we performed Immunohistochemistry staining with the epithelial marker of K14 (KRT14 gene) and confirmed a greater abundance of K14+ tumor cells within lung metastases in Morc4-KO balb/c mice, supporting enhanced metastatic dissemination (Figure 2D-E). These results demonstrate that the pro-metastasis effect of Morc4 loss requires an intact immune system.
To rule out potential confounding effects from fluorescent proteins (clover), we implanted unlabeled parental 4T1 cells transfected with parental or Morc4-KO plasmid into mammary gland of balb/c mice and obtained consistent results in the lung metastatic nodules (Figure S2H-I). This immune-dependent phenotype was recapitulated using a second TNBC model, EMT6, where Morc4 knockdown also enhanced metastasis specifically in immunocompetent hosts (Figure S2J-L).
To evaluate the causal role of Morc4 as a repressor of tumor growth and metastasis, we performed a gain-of-function experiment by overexpressing Morc4 (OE-Morc4) in two independent 4T1 cell clones (Figure 2F). Upon implantation into BALB/c mice, these cells yielded significantly reduced primary tumor growth, final tumor weight (Figure S2M-N), and lung metastatic burden (Figure 2G-H) compared to controls, further supporting the function of Morc4 as a tumor and metastasis suppressor.
To confirm the oncogenic role of Morc4 loss, we overexpressed Morc4 in the Morc4-KO cell line (sgRNA 3) and transplanted these cells into BALB/c mice. On day 25, Morc4-KO tumors showed significantly increased tumor weight, spleen weight, and lung metastasis nodules compared to controls, whereas reintroduction of Morc4 (Morc4-KO/OE) attenuated these phenotypes. These findings validate that Morc4 loss promotes tumor growth and metastatic dissemination in vivo (Figure 2I-L).
Collectively, these studies define Morc4 as a suppressor of breast cancer progression in vivo and reveal that its function is critically linked to the immune microenvironment.
Morc4 Deficiency Drives the Accumulation of Naïve T Cells
To investigate the impact of Morc4 on the tumor immune microenvironment, we performed single-cell RNA sequencing on cells isolated from primary tumors of parental, sgMorc4, and OE-Morc4 genotypes. Unsupervised clustering based on the expression of 25 canonical marker genes identified 10 major cell populations, including macrophages, neutrophils, dendritic cells, T cells, NK cells, B cells, fibroblasts, endothelial cells, and mast cells (Figure S3A). Down sampling analysis across genotypes revealed that T cell compartment was the most substantially altered: it was expanded in sgMorc4 tumors but significantly reduced in OE-Morc4 tumors compared to controls (Figure 3A, 3B), indicating a specific role for Morc4 in modulating T cell abundance. We next characterized the T cell subtypes affected by Morc4 status. Re-clustering of T cells defined 7 distinct subsets: naïve CD4+ T, naïve CD8+ T, exhausted CD4+ T (CD4 Tex), exhausted CD8+ T (CD8 Tex), proliferating T, Th17, and regulatory T (Treg) cells (Figure S3B, S3C). Down sampling analysis demonstrated that naïve CD4+ and naïve CD8+ T cells were markedly increased in Morc4-KO tumors and conversely decreased in OE-Morc4 tumors relative to parental tumors (Figure 3C, 3D and Supplementary Table S9).
Expansion of Naïve T cells caused by loss function of Morc4. A. Uniform manifold approximation and projection (UMAP) plot of the major cell types in primary tumor annotated in scRNA-seq data. Libraries were sequenced on an Illumina HiSeq X-Ten platform, aligned to the mouse genome (GRCm39) using Cell Ranger (v8.0), and imported into R with Seurat (v5.1.0). B. UMAP plots display temporal alterations in each cluster of primary tumors among Ctrl, Morc4-KO, and Morc4-OE groups. C. UMAP plots of different subclusters in T cell populations across primary tumors from Ctrl, Morc4-KO, and Morc4-OE groups. D. Mean cell composition of T cell populations as shown in Figure 3C. E. Naïve T cell score comparison between Morc4-KO and control (Ctrl) groups in primary tumors(left) and spleen (right). F. Trajectory Analysis of Single-Cell RNA Sequencing Data from Primary Tumors with Morc4-KO and Morc4-Ctrl by using Monocle 3 software. G. CyTOF dot plots of immune cell subsets in primary tumor of BALB/c mice from control,Morc4-KO,and Morc4-OE groups. Cell populations are color-coded for subset identification. H. Quantification of immune cell populations in BALB/c mice from CyTOF analysis in Figure 3G. I. Representative images of IHC staining for SELL in primary tumors derived from balb/c mice implanted with 4T1-Morc4-KO and control (Ctrl) cells for 30 days. J. The number of SELL-positive cells in Figure 3I was quantified in each section using Image J(n=9). K. Representative images of IHC staining for SELL in lymph nodes derived from balb/c mice implanted with 4T1-Morc4-KO and control (Ctrl) cells. L. The number of SELL-positive cells in Figure 3K was quantified using Image J(n=9). M. UMAP plot showing the major cell types of 56280 single cell populations in 17 human breast cancer patients(GSE169246, GSE199515, GSE176078). N. Mean cell composition of T cell populations across MORC4high and MORC4low in human breast cancer patients from Figure 3M. O. Morc4 mRNA expression in normal human samples versus TNBC patient samples. Data are shown as mean ± SEM. P= 0.0238 (t-test). (n = 3 per group). P. Morc4 mRNA expression in TCGA primary breast cancer samples stratified by metastatic status (no metastasis, n = 836; metastasis, n = 81). P = 0.0136 (Wilcoxon rank-sum test).
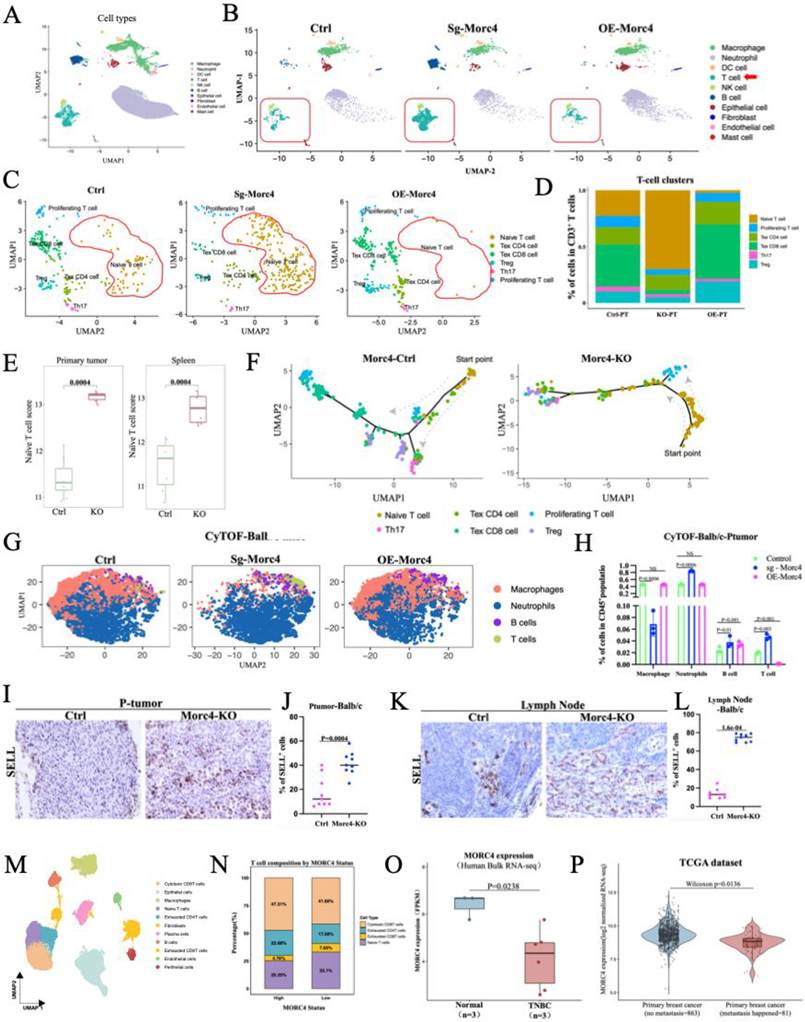
Consistent with this, the expression of naïve T cell marker genes including Tcf7, Lef1, and Sell was significantly elevated in tumors derived from sgMorc4 cells, whereas their expression was reduced in OE-Morc4 tumors (Fig. S3E). To further corroborate this observation at the single-cell level, feature plot analysis revealed abundant co-expression of these markers in CD4⁺ and CD8⁺ T cells infiltrating sgMorc4 tumors, a pattern that was markedly diminished in the OE-Morc4 group (Fig. S3D). Accordingly, naïve T cell signature scores were significantly higher in both primary tumors (PT) and spleens of mice bearing sgMorc4 tumors (Fig. 3E), indicating a systemic accumulation of naïve T cells upon Morc4 loss. To explore the functional status of these cells, we performed pseudo-time trajectory analysis, which revealed that naïve CD4⁺ and CD8⁺ T cells in sgMorc4 tumors exhibited impaired differentiation. This was characterized by a developmental block at the trajectory starting point and an altered differentiation path compared to controls (Fig. 3F). Collectively, these findings suggest that the accumulation of undifferentiated naïve T cells may contribute to the enhanced tumor progression and lung metastasis observed in Morc4-deficient settings.
To characterize the tumor immune microenvironment upon Morc4 loss, we performed CyTOF (mass cytometry) analysis on primary tumors from Morc4-KO, Morc4-OE, and control BALB/c mice. Relative to controls, Morc4-KO tumors exhibited a marked increase in T cell infiltration, whereas Morc4-OE tumors showed a corresponding decrease, consistent with the single-cell analysis (Figure 3G, 3H).
To validate these observations at the protein level, we performed immunohistochemistry (IHC) for the key naïve T cell markers SELL, LEF1, and TCF7 in primary tumors, lymph nodes, and spleens of balb/c mice bearing either parental or sgMorc4 4T1 tumors. Consistent with our transcriptomic data, the number of cells positive for all three markers was significantly elevated in the spleens of sgMorc4 tumor-bearing mice, confirming the systemic accumulation of naïve T cells upon Morc4 loss (Figure S3F-I). Furthermore, SELL protein expression was also markedly increased in both primary tumors and lymph nodes of the sgMorc4-KO group (Figures 3I-L). These findings provide protein-level evidence supporting the accumulation of naïve T cells across multiple lymphoid organs and the tumor microenvironment in the absence of Morc4.
To further assess the translational relevance of this mechanism, we analyzed three publicly available single-cell RNA sequencing datasets (GSE169246, GSE199515, GSE176078) encompassing 17 breast cancer patients and 56280 high-quality cells. Unsupervised clustering identified eleven major cell populations (Figures 3M and S3J). Stratifying cells based on epithelial MORC4 expression into MORC4-high and MORC4-low cohorts revealed a significant increase in naïve T cells and a concomitant decrease in cytotoxic CD8⁺ T cells within the MORC4-low tumor microenvironment (Figures 3N, S3K, S3L and Supplementary Table S10). Consistent with the above sc-RNA sequence analysis, bulk RNA-seq analysis from different source (GSE52194) also revealed that lower MORC4 transcript levels in TNBC patients relative to other breast cancer subtypes. (Figure 3O). MORC4 expression levels were significantly lower in breast cancer patients with metastasis compared to those without metastasis (p = 0.0136) (Figure 3P). This inverse correlation suggests that low MORC4 expression in human breast cancer is associated with an accumulation of naïve T cells and metastatic burden, mirroring our findings in murine models.
Collectively, these data demonstrate that Morc4 deficiency leads to the expansion of naïve T cell populations and impedes their further differentiation, implicating this mechanism in the dysregulation of anti-tumor immunity.
Morc4 represses Tslp expression through modulation of chromatin accessibility at the Tslp locus
To elucidate the molecular mechanism by which Morc4 deficiency leads to the accumulation of naïve T cells. Based on the reported features of Morc4 gene, we hypothesized that Morc4 may regulate chromatin accessibility, thereby altering the expression of specific genes within tumor cells and consequently shaping the composition and function of the tumor immune microenvironment. To test this, we first examined histone modifications marking active (H3K27Ac) or repressive (H3K9me3, H3K27me3) chromatin states. Western blot and immunohistochemistry staining analyses revealed that, compared to controls, primary tumors and lung metastases from Morc4-KO mice exhibited elevated levels of H3K27Ac and reduced levels of H3K9me3 and H3K27me3. (Figure S4A-E). Western blot analysis of sgMorc4 4T1 cells confirmed these changes in H3K27ac histone modification patterns (Figure 4A). Collectively, these results indicate that Morc4 deficiency shifts the epigenetic landscape toward a more open and transcriptionally permissive chromatin state.
Morc4 Negatively Regulates Tslp Expression via Chromatin Accessibility. A. Western blot of H3K27ac (1:1000, Sigma, 07-360) (~17 kDa) in the 4T1 parental cell line and three Morc4 knockout clones. The expression levels of H3K27ac were normalized to H3 (~17 kDa) (1:1000, Abcam, ab10799). B. Bulk RNA-seq analysis of 4T1 cells with Morc4 knockout and control conditions. A total of 1198 genes showed higher expression in Morc4-KO cells compared to controls, with criteria of absolute log2 fold change (log2FC > 0.7) and adjusted p-value (adj. p<0.05). Raw data were cleaned using Trim Galore (v0.6.7). Differentially expressed genes were identified using the Benjamini-Hochberg method with adj. p < 0.05 and absolute log2FC ≥ 0.5. C. ATAC-seq of 4T1 parental and Morc4 knockout (Morc4-KO) cells using the Active Motif-53150 protocol. Reads were trimmed with Trim Galore (v0.6.4). Peaks were called using macs2 with a q-value cutoff of 0.05 and overlapping peaks among replicates were merged for robust identification. D. Increased binding intensity at promoter regions in Morc4-KO group compared to the control group. The peaks relative to transcription start sites (TSS), considering ±3 kb regions. E. Venn diagram showing the overlap of 17 genes that were both significantly upregulated in Morc4-KO cells by RNA-seq and located within regions of increased chromatin accessibility as determined by ATAC-seq. F. Genome Browser tracks of ATAC-seq peaks among three genotypes at the promoter of the Tslp gene. G. ChIP-qPCR result of relative enrichment of H3K27ac at Tslp promotor region in the 4T1-parental and 4T1-Morc4-KO cell line. H. ChIP-seq analysis of MORC4 in 231 cells with MORC4-KO, MORC4-OE and 231 parental cells. Promoter regions were defined as 1000 bp upstream to 1000 bp downstream of the transcription start site (TSS) using ChIPseeker, consistent with standard peak annotation pipelines. I. Concentration of TSLP protein Level (pg/ml)in culture medium of 4T1 and 4T1-Morc4-KO cells determined by ELISA at 450 nm absorbance. Statistical analysis by t-test, with p < 0.05 considered significant.
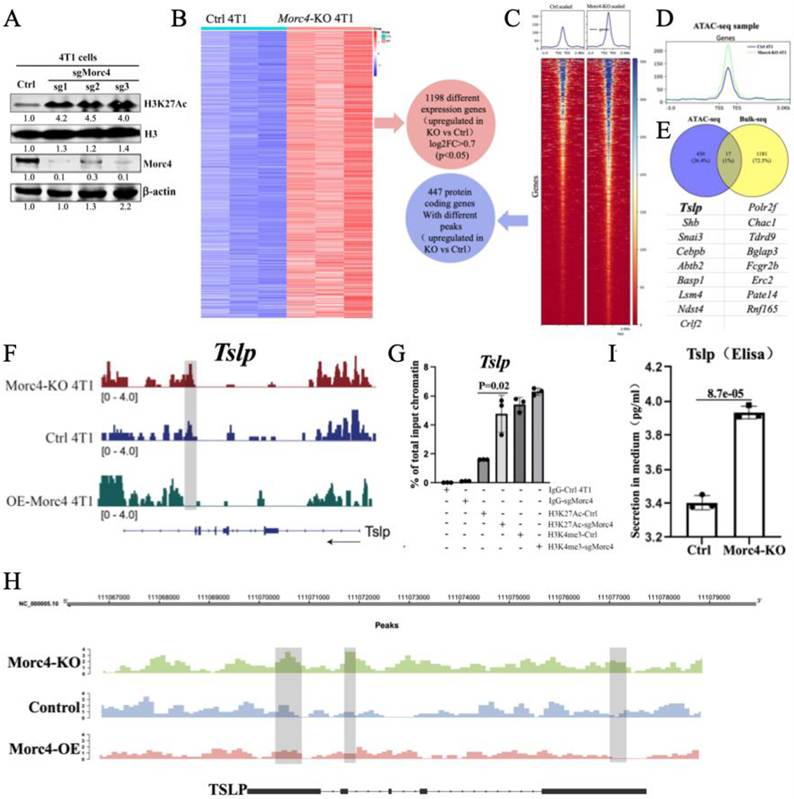
To identify candidate target genes within these accessible regions, we performed an integrated analysis of bulk RNA-seq and ATAC-seq data from Morc4-deficient and control tumor cells. RNA-seq analysis revealed 1,198 significantly upregulated genes in Morc4-KO cells (Figure 4B, Supplementary Table S11). Concurrently, ATAC-seq identified 447 genes with significantly increased chromatin accessibility at their promoter regions (Figure 4C, D, Supplementary Table S12). intersection of the two datasets yielded 17 genes that were both highly expressed and resided in more open chromatin regions in Morc4-KO cells (Figure 4E, Supplementary Table S13). Among these candidates, one gene stood out due to its known functional, TSLP encodes thymic stromal lymphopoietin and it is a cytokine critically involved in immune regulation [20] and TSLP could promotes tumor cell survival via Bcl-2 induction and is required for lung metastasis in breast cancer.[21]. Based on these findings, we focused on TSLP, hypothesizing that their derepressing in Morc4-deficient cells directly contributes to remodeling the tumor immune microenvironment.
ATAC-seq tracks confirmed significantly increased chromatin accessibility at the Tslp loci in sgMorc4 4T1 cells, which was conversely suppressed in OE-Morc4 cells (Figure 4F,). Consistent with this, ChIP-qPCR in 4T1 cells showed enhanced deposition of the active histone markers H3K27Ac at the Tslp promoters upon Morc4 knockout (Figure 4G). To determine if Morc4 directly binds to these loci, we performed ChIP-seq in MDA-MB-231 cells. The result revealed that Morc4 exhibits significant and specific enrichment at the promoter regions of Tslp with peak intensities substantially higher than those at negative control genomic regions. (Figure 4H), indicating its direct association with these genetic loci. Functionally, ELISA confirmed elevated secretion of TSLP protein in sgMorc4 cells compared with that in control cells. (Figure 4I). To further establish link between Morc4 expression and Tslp regulation, we examined Tslp mRNA expression and protein level in both 4T1 and EMT6 cells with the expression of shMorc4. The data revealed that Tslp mRNA expression and protein level were significantly elevated in shMorc4 4T1 cell line (Figures S4F-G) and shMorc4 EMT6 cells (Figures S4H) but reduced upon Morc4-overexpression in MDA-MB-231 cells (Figure S4I). These results demonstrate that Morc4 functions as a transcriptional repressor of Tslp.
As Tslp was identified as a downstream effector of Morc4 and encodes a secreted cytokine, we further investigated whether tumor-derived TSLP could exert effects on lymphoid organs, contributing to systemic immune modulation. Consistent with the metastatic phenotype, IHC staining for the epithelial marker EpCAM showed significantly higher numbers of EpCAM⁺ cells in the spleen and lymph nodes of Morc4-KO mice compared to control animals (P < 0.05) (Figure S4J, K).
Collectively, these data establish that Morc4 is a direct transcriptional repressor of Tslp. Morc4 deficiency remodels chromatin at Tslp loci into a more accessible state, marked by increased H3K27ac, thereby enhancing transcription and subsequent secretion.
The Tslp-Il-7rα Axis Mediates Naïve T Cell Expansion in Morc4-Deficient Tumours
It was reported that TSLP is a potent cytokine able to support T lineage cells from early lymphoid progenitor cells [22]. TSLP acts directly on CD4+ T cells via the TSLP receptor to promote Th2-skewed immune responses and the production of immunosuppressive factors such as IL-10 and IL-13, thereby facilitating breast cancer progression and lung metastasis [23]. We therefore hypothesized that Morc4 deficiency promotes naïve T cell accumulation via hyperactivation of the Tslp. To test this, we generated 4T1 cells with Morc4 knockdown (shMorc4), alone or in combination with Tslp knockout (sgTslp) (Figure S5A, Figure S4F).
Naïve T cells were then co-cultured with these engineered tumor cells, either in activated or resting states, and examined for expression of the naïve T cell markers Tcf7 and Lef1. The shMorc4 4T1 cells significantly upregulated expression of Tcf7 and Lef1 in co-cultured naïve T cells. This effect was abolished when T cells were co-cultured with Morc4-deficient cells lacking Tslp (shMorc4/sgTslp), regardless of T cell activation status (Figure 5A, S5B), indicating that TSLP secretion from Morc4-deficient tumor epithelial cells is critical for promoting the naïve T cell phenotype.
Morc4 deficiency drives TSLP-IL7Ra-dependent naive T cell expansion and cytokine-mediated tumor invasion. A. Quantitative PCR (qPCR) analysis of Tcf7 and Lef1 RNA expression levels in activated Naive T cells (treated with CD28/CD3) co-cultured with 4T1 control (4T1-ctrl), 4T1 cells transfected with Morc4-sh1,2,3, and Morc4-sh1,2,3/Tslp -KO. Naive T cells activated with CD28/CD3 were used as a negative control, and Naive T cells alone were not treated with any antibody and used as a positive control. Statistical significance was determined using T-test (p < 0.05 considered as significance). (n=3). B. CyTOF-based quantification of Naive T cell frequencies (within CD3⁺ population) in primary tumors of Morc4-KO, control, and Morc4-KO/Tslp-KO BALB/c mice. (n = 3 per group). C. Visualization of ligand-receptor (LR) interactions from epithelium cells with high Tslp expression to T cell populations within the primary tumor. Analysis using scRNA-seq data and Cell Call R package. And The action molecules induced by Tslp ligand. D. Quantitative PCR (qPCR) analysis of IL7r gene in activated Naive T cells co-cultured with 4T1 control (4T1-ctrl), 4T1-Morc4-shRNA1,2,3 and Morc4-sh1,2,3/Tslp-KO. Naive T cells activated with CD28/CD3 were used as a negative control, and Naive T cells alone were used as a positive control. E. UMAP plot of Il7r expression in CD4 naïve T cells across primary tumors under three different conditions: Morc4 knockout (Morc4-KO), Morc4 overexpression (Morc4-OE), and control (Ctrl). F. IL7R expression levels(log-normalized) on CD4⁺ naïve T cells in primary tumors of Morc4-KO, Morc4-OE, and control BALB/c mice. (The difference was not statistically significant due to the low cell count in the OE group). G. Frequencies of IL7R⁺ cells within the CD4⁺ naïve T cell population in primary tumors from Morc4-KO, Morc4-OE, and control BALB/c mice. H. UMAP plot of Il7r expression in CD8 naïve T cells across primary tumors under three different conditions: Morc4 knockout (Morc4-KO), Morc4 overexpression (Morc4-OE), and control (Ctrl). I. IL7R expression levels(log-normalized) on CD8⁺ naïve T cells in primary tumors of Morc4-KO, Morc4-OE, and control BALB/c mice. J. Frequencies of IL7R⁺ cells within the CD8⁺ naïve T cell population in primary tumors from Morc4-KO, Morc4-OE, and control BALB/c mice. (The difference was not statistically significant due to the low cell count in the OE group). K. Visualization of ligand-receptor (LR) interactions from Naïve T cell to epithelium cells within the primary tumor. L. Cytokine secretion by naïve T cells after 48 h co-culture with 4T1 parental or Morc4-KO cells, followed by 12 h T-cell-only incubation. M. Mode diagram of Tslp-Crlf2-Il7ra signaling.
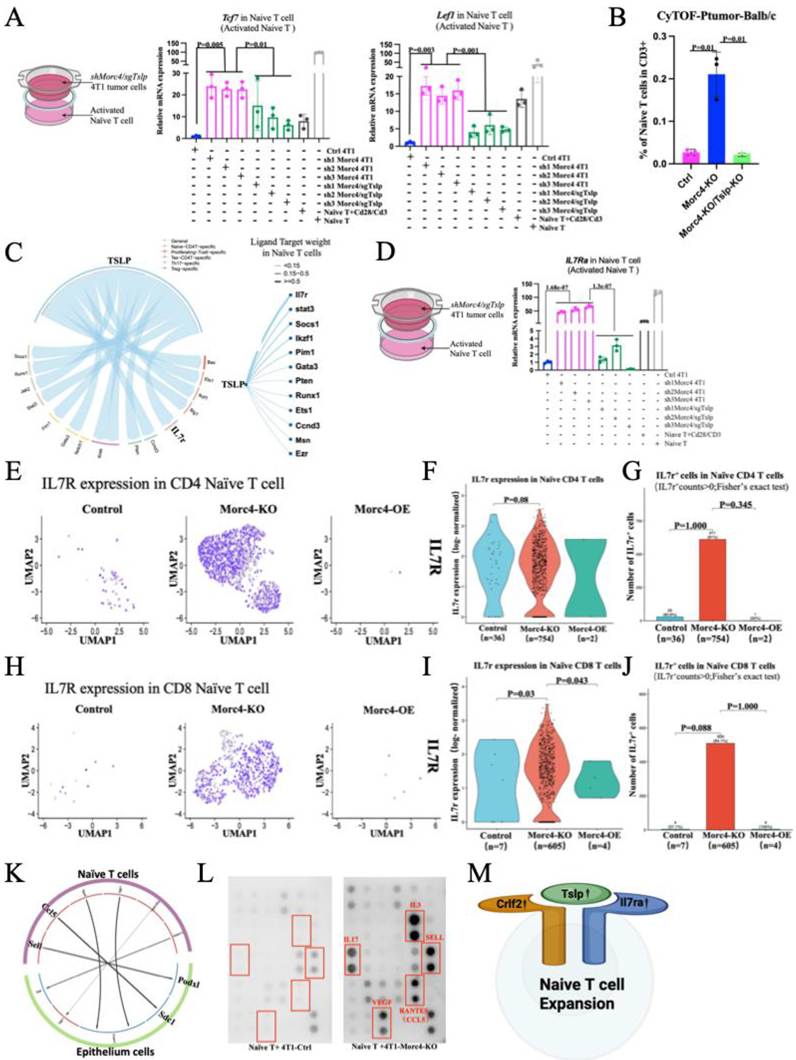
To investigate whether TSLP directly maintains the naïve T cell state, we supplemented naïve T cell cultures with recombinant TSLP protein. This treatment elevated the expression of the naïve T cell marker genes Lef1 and Sell at both the RNA and protein levels (Figure S5C, S5D). These results indicate that TSLP, secreted by Morc4-KO tumors, can directly sustain the naïve T cell abundance.
To determine whether TSLP is responsible for the naïve T cell increased number in Morc4-KO tumors, we compared CyTOF profiles between Morc4-KO and Morc4-KO/Tslp-KO primary tumors, it revealed that naïve T cell numbers were significantly elevated in Morc4-KO primary tumors but markedly reduced in Morc4-KO/Tslp-DKO tumors. It indicates that TSLP is not only required for the maintenance of the naïve T cell phenotype but also maintains the cell number (Figure 5B,S5E).
To further explore the mechanism by which Morc4 deficiency promotes naïve T cell expansion via Tslp signaling, we performed CellChat and NicheNet analyses. These aimed to identify potential interactions between the TSLP ligand from tumor cells and receptors on various T cell subtypes, along with downstream target molecules within T cells in Morc4 KO tumors. The analysis indicated that TSLP from Morc4-deficient mammary tumor epithelial cells potentially interacts with multiple T cell subsets. and may regulate twelve downstream target genes (Figure 5C). Among these, Il7r—which encodes IL7Rα—is critical for early T cell development [24] and is dynamically expressed during T cell differentiation [25]. The gain-of-function mutations in IL7R is described in pediatric B and T acute lymphoblastic leukemias [26]. Based on the established role of Il7rα to form the functional Tslp receptor complex, which is essential for T cell development and survival [27], we first analyzed single-cell data. The analysis revealed a significant enrichment of Il7rα+ cells within the naïve CD4+ and CD8+ T cell populations in Morc4-KO tumors compared to controls. This effect was substantially diminished in Morc4-overexpressing (OE) tumors (Figure 5E-J). To functionally validate this finding, we assessed Il7rα expression in naïve T cells co-cultured with engineered 4T1 cells. Il7rα levels were significantly elevated in T cells co-cultured with Morc4-deficient cells (shMorc4) compared to controls. Conversely, this upregulation was abolished following co-culture with cells that had double deficiency of Morc4 and Tslp (shMorc4/sgTslp). (Figures 5D, S5F), regardless of T cell in activation or non-active status. These results confirm that an intact Tslp-Il7rα signaling axis is necessary for the accumulation of naïve T cells under Morc4-deficient conditions.
Naive CD4+ T cells have been reported to express high levels of the chemokine CXCL8, thereby promoting neutrophil migration to the tumor site and supporting tumor growth [28]. We therefore hypothesized that under Morc4-deficient conditions, naïve T cells might secrete distinct cytokines to influence tumor metastasis. To test this, we performed CellChat and NicheNet analyses to explore potential ligand-receptor interactions between naïve T cells and tumor cells (Figure 5K). Our analysis identified two ligands expressed by naïve T cells, Sell and Ccl5, which potentially interact with Sdc1 (syndecan-1) and Podxl (podocalyxin-like) receptors on tumor epithelial cells. Previous studies provide substantial evidence supporting the biological relevance of these interactions. For example, CCL5 has been shown to promote tumor cell migration through its interaction with syndecan-1 (SDC1) in the context of pancreatic cancer [29]. Extending this concept to adhesion molecules, L-selectin (encoded by Sell) is well-documented to facilitate neutrophil adhesion under inflammatory conditions; notably, dysfunction in L-selectin-mediated adhesion has been shown to be rescued by the knockdown of Podxl (podocalyxin), a known ligand for L-selectin. [30]. Together, these findings raise the possibility that naive T cell-derived factors, specifically CCL5 and L-selectin, may influence tumor progression via paracrine interactions with tumor cell surface receptors such as syndecan-1 and podocalyxin. To investigate the potential role of immune-derived CCL5 and L-selectin in tumor modulation, we performed a cytokine array screen using conditioned medium collected from naïve T cells co-cultured with either 4T1 or Morc4-knockout (Morc4-KO) tumor cells (following a 48-hour co-culture and 12 hours of isolated naïve T cell culture). Consistent with our cell-chat analysis, CCL5 and L-selectin (encoded by Sell), that were significantly over-secreted from Naïve T cell with Morc4-KO group compared to controls (Figure 5L), indicating these two cytokines could play critical roles in shaping the tumor microenvironment.
To determine whether CCL5 and SELL secretion functionally contribute to tumor metastasis, naïve T cells were isolated from primary tumors of Morc4-KO and control mice and co-cultured with 4T1 cells. Co-culture with Morc4-KO-derived naïve T cells upregulated EMT-related genes in 4T1 cells compared to controls. Neutralizing antibodies against CCL5 or SELL, alone or in combination, attenuated tumor cell transwell migration, with the combined treatment yielding the greatest reduction (Figure S5G-I). These findings suggest that naïve T cell-derived CCL5 and SELL promote metastatic in tumor cells.
In conclusion, these findings suggest that Morc4 deficient tumor cells promote the accumulation of naïve T cells within the tumor microenvironment through the activation of the Tslp-Il7rα signaling axis (Figure 5M). Furthermore, the increased naïve T cells could contribute to a pro-tumorigenic environment through the secretion of immunosuppressive cytokines that facilitate tumor cell growth and metastasis.
Targeting the Tslp-Il7rα Axis and Neutralizing Naïve T Cells Impede Tumor Growth and Lung Metastasis Driven by Morc4 Deficiency
To investigate the contribution of tumor-infiltrating naïve T cells to primary tumor growth and metastasis, we first examined the expression of key signaling components known to regulate T cell homeostasis and function in tumor tissues, spleen, and thymus from parental control and Morc4-KO mice. Specifically, we analyzed transcript levels of Tslp and Il7ra, compared to parental controls, Morc4-KO tumor-bearing mice exhibited significantly elevated expression of these genes in primary tumors (PT), spleen, and thymus (Figure 6A). This broad upregulation suggests enhanced TSLP-mediated signaling in the lymphoid organs and tumor microenvironment of Morc4 deficient hosts, consistent with the observed accumulation of naïve T cells.
Blockade of the TSLP -IL7Ra axis or ablation of naïve T cells exerts inhibitory effects on metastasis. A. Heatmap depicting the mRNA expression levels of Tslp in primary tumors, and Il7ra in the spleen and thymus, comparing Morc4-knockout (KO) and control balb/c mice. B. Experimental design schematic: Morc4-KO tumor-bearing balb/c mice were treated with Tslp inhibitor(100ug/100ulPBS), anti-CD62L neutralizing antibody (100μg/100ul PBS), or combination both, Treatments were administered beginning prior to tumor implantation and repeated every 4 days thereafter. C. The tumor volume of Primary tumor across treatment groups in the balb/c mice. D. Tumor volume(mm3) of balb/c mice across different drug treatment groups and measure the size of tumor at five time point. E. Quantification of lung nodules was performed to assess metastasis burden across different drug treatment groups. F. CyTOF analysis of CD4⁺ T cell (CD45⁺CD3⁺CD4⁺CD62L⁻) frequencies within CD3⁺ cells in primary tumors of BALB/c mice across treatment groups. G. CyTOF analysis of CD8⁺ T cell (CD45⁺CD3⁺CD8⁺CD62L⁻) frequencies within CD3⁺ cells in primary tumors of BALB/c mice across treatment groups.
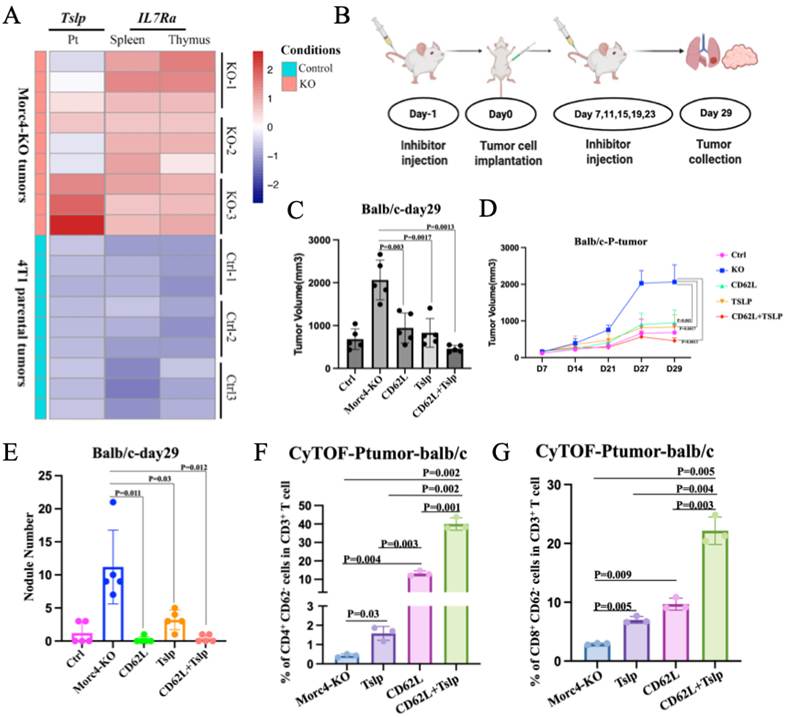
Based on these observations, we next sought to determine whether targeting of the Morc4-Tslp-Il7rα signaling axis could impede the tumor progression in Morc4 KO mice. To test this, we designed a treatment strategy in balb/c mice bearing Morc4-KO tumors (Figure 6B). Given our finding that naïve T cells accumulate in these mice and express high levels of L-selectin (CD62L) and TSLP receptor components, we designed interventions aimed at depleting naïve T cells or neutralizing TSLP in vivo. Strikingly, single application with either antibody significantly reduce both primary tumor volume and the number of metastatic nodules compared to untreated controls. Moreover, the combination treatment yielded the most pronounced inhibition of tumor growth and metastasis, suggesting that these two interventions may act through complementary mechanisms (Figures 6C-E, S6A-B).
CyTOF analysis was performed to assess the frequencies of CD4⁺ and CD8⁺ T cell subsets (gated as CD45⁺CD3⁺CD4⁺CD62L⁻ and CD45⁺CD3⁺CD8⁺CD62L⁻, respectively) among total CD3⁺ cells in primary tumors from BALB/c mice across treatment groups. Notably, the frequency of CD62L⁻ effector T cells increased upon treatment with either anti-CD62L or anti-CCL5 neutralizing antibodies alone, with the combined treatment yielding the highest frequency (Figure 6F,6G, S6C).
Collectively, these results demonstrate that depleting naïve T cells, neutralizing TSLP, or a combination of both strategies effectively abrogates the pro-metastatic environment induced by Morc4 deficiency. Our findings establish the Morc4-Tslp-Il7rα signaling axis as a critical regulator of tumor-immune interactions and highlight its potential as a therapeutic target in breast cancer lung metastasis.
Discussion
In this study, we identified Morc4 as a previously uncharacterized suppressor of breast cancer lung metastasis using an in vivo CRISPR/Cas9 screen. Integrative epigenomic and functional analyses revealed that Morc4 loss increases chromatin accessibility and upregulates Tslp secretion, which activates the Il7rα signaling axis on T cells and drives naïve T cell accumulation. These accumulated naïve T cells promote metastasis probably through secretion of CCL5 and SELL, which engage receptors on tumor cells. Notably, therapeutic targeting of naïve T cells with anti-CD62L, alone or in combination with Tslp-Il7rα inhibition, suppressed primary tumor growth and lung metastasis induced by Morc4 deficiency.
The role of MORC4 in cancer has remained largely unexplored. Elevated MORC4 expression has been reported in colorectal and breast cancers [17] and in diffuse large B-cell lymphomas [31], leading to its classification as a putative oncogene. However, MORC4 is associated with pancreatitis susceptibility suggests that loss of Morc4 function may also contribute to disease. Here we provide the first functional evidence establishing Morc4 as a metastasis suppressor in breast cancer, consistent with recent findings linking MORC4 expression in specific macrophage subsets to improved patient survival [32]. These findings redefine MORC4 as a context-dependent tumor suppressor with a specific role in restraining metastatic dissemination.
In this study, we observed that Morc4-deficient epithelial cells exhibit increased levels of H3K27ac, reduced H3K27me3 and H3K9me. Consistent with these epigenetic changes, bulk RNA-seq revealed elevated expression of Tslp, while ATAC-seq showed increased chromatin accessibility at its respective loci. ChIP-qPCR further confirmed enhanced enrichment of H3K27ac and H3K4me3 at these sites in sgMorc4 epithelial cells. These findings for the first time demonstrate that Morc4 functions not only as a global chromatin regulator but also exerts locus-specific control over gene expression.
Our mechanistic studies show that tumor-derived TSLP, via Il7rα, drives accumulation of differentiation-blocked naïve T cells—consistent with TSLP's role in supporting early T lineage cells [33] and CRLF2(one of Tslp receptor) involvement in leukemia [34]. This pathway may represent a common link between inflammation and cancer. Unexpectedly, accumulated naïve T cells secrete CCL5 and SELL, creating a paracrine feedback loop that promotes metastasis. CCL5 interacts with SDC1 in pancreatic cancer [35], and L-selectin mediates adhesion in inflammation [36]. Our cytokine array and CellChat analyses confirm these factors are over-secreted in co-culture with Morc4-deficient tumor cells, suggesting that dysfunctional naïve T cells establish a pro-metastatic niche that enhances tumor malignancy. Targeting the Tslp-Il7rα axis via TSLP neutralization or anti-CD62L-mediated naïve T cell depletion suppresses primary tumor growth and lung metastasis in Morc4-deficient mice. and Combination therapy achieved the strongest effect.
Several limitations of this study should be noted. First, the comparison of balb/c mice with nude mice served to identify genes whose enrichment may be influenced by T cells but was not used as an absolute exclusion criterion. While our functional validation experiments demonstrate that Morc4 promotes metastasis in part through modulating naive T cells, we note that Morc4 sgRNA was also enriched in lung metastases in nude mice. This suggests that Morc4 may also exert T-cell-independent effects on metastasis, potentially through enhancing tumor cell-intrinsic properties such as migration, invasion, or survival. Second, the precise mechanism by which Morc4 recognizes and binds specific genomic loci at the Tslp gene remains to be fully elucidated. Third, the downstream signaling pathways mediating CCL5/SDC1 and SELL/PODXL interactions in tumor cells require further investigation. At last, the therapeutic efficacy observed in mouse models needs validation in humanized systems to establish translational relevance.
In conclusion, we identify Morc4 as a breast cancer metastasis suppressor that epigenetically represses Tslp and causing accumulation of differentiation-blocked naïve T cells that secrete pro-metastatic factors. Targeting this pathway via TSLP neutralization or naïve T cell depletion could suppress metastasis, particularly in low-MORC4 tumors. Our findings reveal a novel axis linking tumor-intrinsic epigenetic regulation to immune remodeling and metastatic progression.
Supplementary Material
Supplementary figures.

Supplementary table s2.
Supplementary table s3.
Supplementary table s4.
Supplementary table s5.
Supplementary table s6.
Supplementary table s7.
Supplementary table s8.
Supplementary table s9.
Supplementary table s10.
Supplementary table s11.
Supplementary table s12.
Supplementary table s13.
Supplementary table s14.
Supplementary table s15.
Supplementary table s16.
Acknowledgements
The authors thank the members of the XLX and CXD laboratories for their valuable advice and discussions. Special thanks are due to Dr. Min Deng and Aiping Zhang for their expert on bioinformatics analyses. We also acknowledge the contributions of the histopathology core and the genomics and bioinformatics core facilities for their support in experimental execution and machine booking. Additionally, we thank the Animal Facility for providing housing and breeding services for the animals, and the Information and Communication Technology Office (ICTO) for supplying the High-Performance Computing Cluster (HPCC) that enabled the computational analyses in this study.
Funding Support
This work was supported by Natural Science Foundation of China (NSFC): 82573786, The Science and Technology Development Fund (FDCT) grants (0065-20220-A2, 0009/2022/AKP) of Macau SAR, China.
Author Contributions
XZ and XX conceived and designed the study. XZ, MK, SMS, WYQ, DM, ATT, JX, and JJL developed methodology. XZ, SMS, WYQ, and HP acquired data (provided animals, acquired and provided facilities, etc.). DM, ZAP and XX analyzed and interpreted data (e.g., statistical analysis, biostatistics, computational analysis). XX, KM, and XZ wrote, XX, KM, and XZ reviewed, and/or revised the manuscript.
Study Approval
Animal protocol: All mouse strains were maintained in the animal facility of the Faculty of Health Science, University of Macau, according to institutional guidelines. This study was conducted with the approval of the University of Macau Animal Ethics Committee under protocol (Protocol ID: UMARE-AMEND-015-2019).
Data Availability Statement
Raw sequencing data were deposited in the NCBI Sequence Read Archive (SRA) under the accession number: PRJNA1315222.The data analyzed in this study were obtained from Gene Expression Omnibus (GEO) at GSE169246, GSE199515, GSE176078.
Competing Interests
The authors have declared that no competing interest exists.
References
1. Bray F, Laversanne M, Sung H. et al. Global cancer statistics 2022: GLOBOCAN estimates of incidence and mortality worldwide for 36 cancers in 185 countries. CA Cancer J Clin. 2024;74(3):229-263
2. Lourenço C, Conceição F, Sousa DM. et al. Stress in Metastatic Breast Cancer: To the Bone and Beyond. Cancers (Basel). 2022;14(8):1881
3. Wu M, Liang Y, Zhang X. et al. Changes in Pulmonary Microenvironment Aids Lung Metastasis of Breast Cancer. Front Oncol. 2022;12:860932
4. Jin L, Han B, Cui X. et al. Breast cancer lung metastasis: Molecular biology and therapeutic implications. Cancer Biol Ther. 2018;19(10):858-868
5. Li Yang, P. Charles Lin, et al. Mechanisms that drive inflammatory tumor microenvironment, tumor heterogeneity, and metastatic progression. Seminars in Cancer Biology. 2017 Pages 185-195,ISSN 1044-579X
6. Anisha Singha Deo, Koustav Sarkar. et al. Participation of T cells in generating immune protection against cancers. Pathology - Research and Practice. 2024 262, 155534,ISSN 0344-0338
7. Perry J, Zhao Y. et al. The CW domain, a structural module shared amongst vertebrates, vertebrate-infecting parasites and higher plants. Trends Biochem Sci. 2003;28:576-80
8. Li D. Q, Nair, Kumar, R, et al. The MORC family: New epigenetic regulators of transcription and DNA damage response. Epigenetics. 2013 8(7), 685-693
9. Wang H, Luo Q. et al. MORC protein family-related signature within human disease and cancer. Cell Death Dis. 2021 12, 1112
10. Shah SP, Morin RD, Khattra J. et al. Mutational evolution in a lobular breast tumor profiled at single nucleotide resolution. Nature. 2009;461(7265):809-813
11. Pan Z, Ding Q, Guo Q. et al. MORC2, a novel oncogene, is upregulated in liver cancer and contributes to proliferation, metastasis and chemoresistance. Int J Oncol. 2018;53(1):59-72
12. Yang Z, Geng S. et al. MORC4 is a novel breast cancer oncogene regulated by miR-193b-3p. J Cell Biochem. 2019;120(3):4634-4643
13. Jadhav G, Teguh D, Kenny J. et al. Morc3 mutant mice exhibit reduced cortical area and thickness, accompanied by altered haematopoietic stem cells niche and bone cell differentiation. Sci Rep. 2016 6, 25964
14. Tencer AH, Wright GM. et al. Molecular mechanism of the MORC4 ATPase activation. Nat Commun. 2020;11(1):5466
15. Bourgault J, Manikpurage HD. et al. Proteome-Wide Mendelian Randomization Identifies Causal Links Between Blood Proteins and Acute Pancreatitis. Gastroenterology. 2023;164(6):953-965
16. Liang Y, Wu D, Yin H. et al. MORC4 plays a tumor-promoting role in colorectal cancer via regulating PCGF1/CDKN1A axis in vitro and in vivo. Cancer Gene Ther. 2023;30(7):985-996
17. Gauvreau G. M, & Griffiths, J. M, et al. Thymic stromal lymphopoietin: its role and potential as a therapeutic target in asthma. Expert Opinion on Therapeutic Targets. 2020 24, 777-792
18. Xu J, Su SM, Zhang X. et al. ATP11B inhibits breast cancer metastasis in a mouse model by suppressing externalization of nonapoptotic phosphatidylserine. J Clin Invest. 2022;132(5):e149473
19. Pal B, Chen Y, Vaillant F. et al. A single-cell RNA expression atlas of normal, preneoplastic and tumorigenic states in the human breast. The EMBO Journal. 2021;40(11):e107333
20. Ebina-Shibuya Leonard, W.J et al. Role of thymic stromal lymphopoietin in allergy and beyond. Nat Rev Immunol. 2023 23, 24-37
21. Kuan E. L. & Ziegler, S. F, et al. A tumor-myeloid cell axis, mediated via the cytokines IL-1α and TSLP, promotes the progression of breast cancer. Nature Immunology. 2018 19, 366-374
22. Mazzucchelli R, Hixon JA, Spolski R. et al. Development of regulatory T cells requires IL-7Ralpha stimulation by IL-7 or TSLP. Blood. 2008;112(8):3283-3292
23. Olkhanud PB, Rochman Y, Bodogai M. et al. Thymic stromal lymphopoietin is a key mediator of breast cancer progression. J Immunol. 2011;186(10):5656-5662
24. Hong C, Luckey MA, Park JH. et al. Intrathymic IL-7: the where, when, and why of IL-7 signaling during T cell development. Semin Immunol. 2012;24(3):151-158
25. Thomas R. Malek, et al. IL-7: a limited resource during thymopoiesis. Blood. 2004;104(13):3842
26. Shochat C, Tal N, Bandapalli OR. et al. Gain-of-function mutations in interleukin-7 receptor-α (IL7R) in childhood acute lymphoblastic leukemias. J Exp Med. 2011;208(5):901-908
27. Tal N, Shochat C, Geron I. et al. Interleukin 7 and thymic stromal lymphopoietin: from immunity to leukemia. Cell. Mol. Life Sci. 2014 71, 365-378
28. Crespo J, Wu K, Li W. et al. Human Naive T Cells Express Functional CXCL8 and Promote Tumorigenesis. J Immunol. 2018;201(2):814-820
29. Bahng I. et al. CCR-CCL axes as key upstream influencers of pancreatic ductal adenocarcinoma: CCR2-CCL2, CCR5-CCL5, CCR4-CCL17/22, CCR6-CCL20, CCR7-CCL19/21. Front Immunol. 2026;17:1713123
30. Zhang X, Liu S, Weng X. et al. Brg1 deficiency in vascular endothelial cells blocks neutrophil recruitment and ameliorates cardiac ischemia-reperfusion injury in mice. Int J Cardiol. 2018;269:250-258
31. Liggins AP, Lawrie CH. et al. MORC4, a novel member of the MORC family, is highly expressed in a subset of diffuse large B-cell lymphomas. Br J Haematol. 2007;138(4):479-486
32. Strack E, Rolfe PA, Fink AF. et al. Identification of tumor-associated macrophage subsets that are associated with breast cancer prognosis. Clin Transl Med. 2020;10(8):e239
33. Chappaz S, Flueck L, Finke D. et al. Increased TSLP availability restores T- and B-cell compartments in adult IL-7 deficient mice. Blood. 2007;110(12):3862-3870
34. Tasian SK, Loh ML. et al. Understanding the biology of CRLF2-overexpressing acute lymphoblastic leukemia. Crit Rev Oncog. 2011;16(1-2):13-24
35. Chen K, Wang Y, Hou Y. et al. Single cell RNA-seq reveals the CCL5/SDC1 receptor-ligand interaction between T cells and tumor cells in pancreatic cancer. Cancer Lett. 2022;545:215834
36. Ivetic A, Hart SJ. et al. L-selectin: A Major Regulator of Leukocyte Adhesion, Migration and Signaling. Front Immunol. 2019;10:1068
37. Li W, Xu H, Xiao T. et al. MAGeCK enables robust identification of essential genes from genome-scale CRISPR/Cas9 knockout screens. Genome Biol. 2014;15(12):554
38. Gu Z, Schlesner M. et al. Complex heatmaps reveal patterns and correlations in multidimensional genomic data. Bioinformatics. 2016;32(18):2847-2849
39. Kim D, Langmead B. & Salzberg, S, et al. HISAT: a fast spliced aligner with low memory requirements. Nat Methods. 2015:357-360
40. Yang Liao, Wei Shi. et al. feature Counts: an efficient general purpose program for assigning sequence reads to genomic features. Bioinformatics. 2014;20(7):923-930
41. Love MI, Anders S. et al. Moderated estimation of fold change and dispersion for RNA-seq data with DESeq2. Genome Biol. 2014;15(12):550
Author contact
Corresponding author: Xiaoling Xu, email address: zumri.xiaolingxedu.mo.