Impact Factor ISSN: 1449-2288




Int J Biol Sci 2027; 23(2):663-681. doi:10.7150/ijbs.139790 This issue Cite
Research Paper
Pathogenic R-loop accumulation links KEAP1/NRF2 perturbation to PD-L1 upregulation after tumor irradiation
Kah Suan Lim1  , Jessica Sook-Ting Kok1, Jing Yi Lee1, Dave Yongxiang Ng1, Zexi Guo4, Elizabeth Chun-Yong Lee1, Kenneth Bong1, Sheng Rong Ng2, Zhimei Li1, Gao Bin Chen1, Abner Lim1, Peiyong Guan3, Stefanus Lie1, Chern Han Yong1, Xiaosai Yao2, Kheng Wei Yeoh1, Ian Junjie Tay2, Hiu Yeung Lau5, Jing Han Hong4, Vikneswari Rajasegaran1, Jing Quan Lim1, Jason Yongsheng Chan1, Melvin Lee Kiang Chua1, Shang Li4, Khee Chee Soo1, Bin Tean Teh1,2,3,4
1. National Cancer Centre, Singapore.
2. Institute of Molecular and Cell Biology, Singapore.
3. Genome Institute of Singapore, Singapore.
4. Duke-Nus Medical School, Singapore.
5. Department of Anatomical Pathology, Singapore General Hospital, Singapore.
Received 2026-6-24; Accepted 2026-10-19; Published 2027-1-1
Abstract
Chemoradiation enhances tumor responsiveness to PD-(L)1 checkpoint blockade, but the mechanisms underlying this effect remain incompletely understood. Here, we identify the KEAP1/NRF2 axis as a key regulator of radiation-induced PD-L1 expression through an unbiased CRISPR screen in urinary system cancers. Loss of KEAP1 or activation of NRF2 robustly upregulated PD-L1 across established and patient-derived models and enhanced therapeutic response to PD-L1 blockade in vivo when combined with radiotherapy. Mechanistically, KEAP1/NRF2 dysregulation induced transcriptional hyperactivation of NRF2 target genes, leading to pathological accumulation of R-loops, replication stress, and DNA double-strand breaks. This triggered micronuclei formation and activation of the cGAS-STING pathway, resulting in Type I interferon signaling and downstream PD-L1 upregulation. Resolution of R-loops via RNASEH1 overexpression abrogated both DNA damage and PD-L1 induction, confirming a causal role for R-loop accumulation. Genome-wide R-ChIP sequencing revealed that R-loops preferentially accumulated not only at canonical NRF2 target loci but also at innate immune genes, accompanied by their transcriptional activation, indicating a direct link between KEAP1/NRF2 signaling and innate immune regulation. Notably, similar immunogenic effects were observed following cisplatin treatment, suggesting broader relevance across genotoxic therapies. Together, these findings establish a mechanistic pathway in which KEAP1/NRF2 dysregulation drives STING-dependent PD-L1 upregulation via aberrant R-loop formation following genotoxic stress. Therapeutically, combining KEAP1 inhibition or NRF2 activation with radiotherapy may potentiate PD-(L)1 blockade in urinary system cancers.
Keywords: radiation, PD-L1, KEAP1, NRF2, R-loops
Introduction
Cancer immunotherapy can induce durable responses even in patients with advanced disease, through the inhibition of key immune checkpoints (e.g. PD-L1 and CTLA4) that prevent host immune cells from recognizing tumor cells as foreign, resulting in tumor immune evasion[1-3]. However, only a minority of treated patients respond to immune checkpoint blockade, underscoring a critical need to identify mediators that will potentiate immunotherapy responses in cancer[4].
Genotoxic treatments synergize with immunotherapy in cancer - the PACIFIC trial found that patients with non-small cell lung cancer had significantly longer progression-free survival when treated with a combination of chemoradiation and a PD-(L)1 inhibitor[5, 6]. Preclinical findings provide a potential explanation for this synergy - the upregulation of PD-L1 on tumor cells after chemoradiation correlated with enhanced response to PD-(L)1 blockade in several different types of cancers[7-13]. There is thus immense interest in the co-treatment of different tumor types with chemoradiation and immune checkpoint blockade, with more than 500 ongoing clinical trials (http://clinicaltrials.gov).
Beyond these descriptive and correlative studies however, the molecular mechanisms of the synergy between radiation and immunotherapy had not been clearly elucidated. Recently, intracellular PD-L1 had been found to bind chromatin and function in DNA repair, potentially explaining the increase in cellular expression of PD-L1 after genotoxic treatment[14-16]. These findings demonstrated that the cellular roles of PD-L1 are complex and might influence its role in anti-tumor immunity.
R-loops are triple-stranded nucleic acid structures consisting of a DNA-RNA hybrid and the complementary non-template DNA, that form when there are high levels of transcription. Aberrant R-loop upregulation leads to DNA damage through transcription-replication conflict (TRC) and replication stress[17]. On the other hand, R-loop formation and modification can also influence DNA repair pathways, including upregulation of homologous recombination (HR), suppression of microhomology mediated end joining (MMEJ) etc, the role of R-loops in DNA repair is therefore complex and multifaceted[18, 19]. To date, any potential links between R-loops, PD-L1 and radiation in cancer is unknown.
To interrogate additional mechanisms of synergy between PD-L1 and radiation, we performed an unbiased CRISPR screen in the renal cell carcinoma (RCC) line 786-O for genes that regulate PD-L1 expression after irradiation. RCC was selected due to its immunosensitive, radioresistant nature, and the correlation of PD-L1 expression to immunotherapy response in this tumor type[20]. The CRISPR screen was performed in irradiated RCC cells to identify negative regulators of PD-L1 whose loss further enhanced PD-L1 expression in the context of radiation treatment. We identified several known genes and pathways that regulate PD-L1 expression, including UROD, KDM1A, CMTM6 and STT3A[21-25]. In addition to the genes mentioned above, KEAP1, a gene commonly mutated in cancer, was found to influence PD-L1 expression after radiation through the screen. Due to the relevance of KEAP1 to cancer, we decided to focus our downstream studies on KEAP1.
KEAP1 mutations had been identified in several different cancer types, particularly lung cancers, and drive tumorigenesis through regulating the transcription factor NRF2 and its expression of antioxidant genes - when KEAP1 is inhibited, NRF2 is activated and cellular ROS levels are low[26, 27]. Here, we showed that either silencing KEAP1 or overexpressing NFE2L2 (NRF2) upregulated PD-L1 in several urinary system cancer cell lines after irradiation. Bladder carcinoma patients from a TCGA dataset with mutant KEAP1 or downregulation of KEAP1 were also found to overexpress PD-L1 and had decreased survival. In a syngeneic C57BL/6 mouse model of bladder carcinoma, co-treatment with PD-L1 inhibitor, radiation and an NRF2 activator led to a significant reduction in tumor volume. Remarkably, both KEAP1 silencing and aberrant NRF2 activation led to an increase in DNA damage after radiation in urinary system carcinoma cells. This increase in DNA damage was due to an increase in the formation of unscheduled R-loops upon aberrant NRF2 activation and upregulation of NRF2 target genes and could be rescued by overexpression of R-loop specific nuclease RNaseH1.
Unexpectedly, when we mapped the genomic loci at which R-loops accumulated after KEAP1 silencing and radiation treatment in urinary system carcinoma cells using R-loop chromatin immunoprecipitation (R-ChIP)[28, 29], we found that in addition to NRF2 target genes, R-loops were found to have accumulated at several immune-related genes, this was accompanied by increased expression of these genes. This suggests that KEAP1 inhibition and radiation treatment might play a larger role at regulating innate immune gene expression and thus CD274 (PD-L1) expression.
Our study is the first to describe a link between unscheduled R-loop formation, the KEAP1/NRF2 pathway and PD-L1, and we propose R-loop targeting therapeutics to be a novel class of PD-L1 regulators in immunotherapy.
Results
Unbiased CRISPR screen identified KEAP1 as a novel regulator of radiation-induced PD-L1 upregulation in urinary system cancer cells
We performed a CRISPR screen to identify novel radiation-dependent regulators of PD-L1 expression in urinary system cancers. RCC 786-O cells were transduced with the Brunello sgRNA library then irradiated twice at 4Gy each (at 24h intervals) before being sorted for PD-L1 expression by FACS (Figure 1A). The top and bottom 10% of PD-L1 expressing cells were analyzed by NGS and the results presented in a waterfall plot genes are ranked based on changes in PD-L1 expression following their loss (Figure 1B). Loss of genes associated with the highest CD274 (PD-L1) expression included known PD-L1 regulators such as KDM1A and UROD, whereas loss of CD274 (PD-L1) itself, CMTM6, and STT3A resulted in the lowest PD-L1 protein expression, supporting the validity of our screen[21-25]. Interestingly, KEAP1, a gene frequently mutated in cancers, led to one of the highest PD-L1 upregulation when knocked-out (Figure 1B). We therefore decided to investigate KEAP1.
A) Schematic of CRISPR screen design. B) Waterfall plot showing genes that influence PD-L1 expression after irradiation. C) Survival curve showing difference in survival in bladder carcinoma patients with KEAP1 mutation or underexpression (altered) vs unaltered KEAP1. D) Graph showing difference in CD274 expression in bladder carcinoma patients with KEAP1 mutation or underexpression (altered) compared to unaltered KEAP1 (n=402). E) Flow cytometry experiment measuring PD-L1 expression in A498 cells treated with and without RT, with and without siKEAP1. 1F) Western blot experiment measuring PD-L1 expression in A498 cells treated with and without RT, with and without siKEAP1. G) Flow cytometry experiment measuring PD-L1 expression in EJ138 cells treated with and without RT, with and without siKEAP1. H) Western blot experiment experiment measuring PD-L1 expression in EJ138 cells treated with and without RT, with and without siKEAP1. I) GSEA analysis of CRISPR screen results reveal Oxidative Phosphorylation pathway to be significantly lost in cells that have high PD-L1 expression (q=4.42e-09).
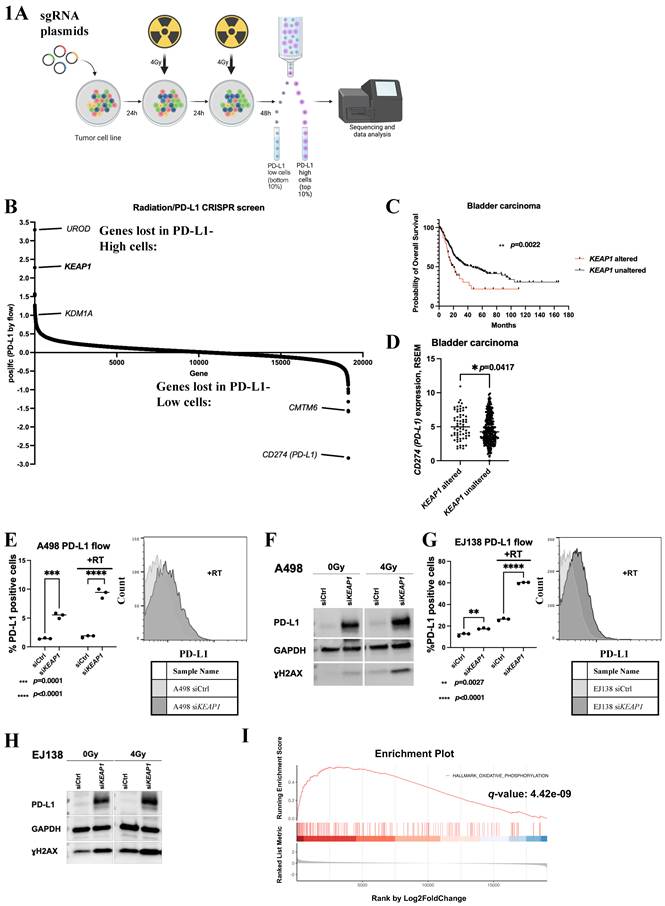
To validate the clinical significance of our findings, we mined the TCGA bladder carcinoma dataset and found that patients with either KEAP1 mutations or underexpression (z-scores <-1 relative to diploid samples) in their tumors have a significantly decreased survival compared to patients with unaltered KEAP1 (p=0.0022, n=410) (Figure 1C). They also had significant upregulation of PD-L1 expression in their tumors (p=0.0417) (Figure 1D)[24].
Next, we validated our findings using an siRNA that silences KEAP1 in a second RCC cell line A498 to rule out non-specific CRISPR effects (Figure S1A), we found that KEAP1 silencing upregulates PD-L1 by flow cytometry (Figure 1E), western blotting (Figure 1F) and qPCR (Figure S1B) after RT (radiation treatment). To determine if this phenotype can be observed in other urinary system cancers, we also investigated PD-L1 expression after KEAP1 silencing in bladder carcinoma line EJ138. We found that KEAP1 knockdown (Figure S1C) upregulates PD-L1 by flow cytometry (Figure 1G), western blotting (Figure 1H) and qPCR (Figure S1D) after RT in this cell line as well. Interestingly, we found that KEAP1 silencing led to an increase in γH2AX by western blotting in both A498 and EJ138 cells, particularly after RT, suggesting that KEAP1 loss leads to an increase in DNA damage (Figure 1F and 1H). To determine whether our findings were true in primary urinary system tumor cells, we silenced KEAP1 in patient-derived RCC cell lines validated by a pathologist (Figure S1E) before and after RT and probed the cells for PD-L1 expression. KEAP1 silencing led to an upregulation of PD-L1 expression both by western blotting (Figure S1F) and by flow cytometry (Figure S1G-J) after RT in patient-derived primary RCC cells, highlighting the clinical relevance of our findings.
Given that KEAP1 regulates NRF2, a key transcriptional regulator of the cellular antioxidant response, we investigated whether other ROS-related genes could influence CD274 (PD-L1) expression. Gene set enrichment analysis of the CRISPR screen identified oxidative phosphorylation genes among the top pathways associated with changes in CD274 (PD-L1) expression (q=4.42e-09) (Figure 1I). Mitochondrial-related pathways, a major source of cellular ROS, were also among the top pathways that were enriched in the CRISPR screen results (Figure S1K). In agreement with these findings, when an antioxidant Trolox was used to treat EJ138, we observed an upregulation of CD274 (PD-L1) 48h after RT (Figure S1L). Taken together, these results suggest that ROS-regulation by the KEAP1-NRF2 pathway plays a major role in PD-L1 expression after RT in urinary system cancers.
KEAP1 silencing leads to increased CD274 (PD-L1) through aberrant NRF2 activation
To better assess the correlation between KEAP1 and PD-L1 expression at a cellular level, A498 and EJ138 cells were sorted by flow cytometry into the cells with the highest and lowest cell surface PD-L1 before and after RT, followed by qPCR analysis of KEAP1 expression (Figure S2A-D). In A498 cells, low cell surface PD-L1 expression was associated with significantly higher KEAP1 expression compared with cells expressing high levels of PD-L1. This difference became more pronounced after RT (Figure S2B). In EJ138, cells with low cell surface PD-L1 expression were associated with significantly higher KEAP1 expression compared to cells with high cell surface PD-L1 expression only after RT (Figure S2D). These findings indicate an inverse relationship between KEAP1 and PD-L1 in urinary system cancer cells, particularly after RT.
Next, we investigated the impact of tumor-cell KEAP1 silencing on co-cultured Jurkat T cells as a functional readout of PD-L1-mediated T-cell suppression[30]. Jurkat cells activated with phytohemagglutinin (PHA), co-cultured with both EJ138 and A498 cells showed an increase in apoptosis upon KEAP1 silencing (Figure 2A, B). In EJ138 cells, the increase was more pronounced after RT (Figure 2A). By contrast, when CD274 (PD-L1) was silenced together with KEAP1 in EJ138 cells, this increase in apoptosis was abrogated (Figure S2E). This data suggests that the PD-L1 upregulation resulting from KEAP1 silencing lead to T-cell apoptosis.
A-B) Flow cytometry analysis measuring apoptosis in PI-stained Jurkat cells co-cultured with EJ138 cells (A) and A498 cells (B) treated with and without RT, with and without siKEAP1. C) Western blot of PD-L1, γH2AX and GAPDH in A498 cells treated with RT and either siCtrl, siKEAP1, siNRF2 or siKEAP1 and siNRF2. D-E) Flow cytometry measuring PD-L1 positivity in A498 cells (D) or EJ138 cells (E) treated with and without RT, transfected with either empty vector (EV), NRF2-WT or NRF2-E82G. F-G) Flow cytometry analysis measuring PD-L1 positivity in EJ138 cells (F) and A498 cells (G) treated with increasing doses of NRF2 activator RTA402 with and without RT. H) Flow cytometry analysis measuring PD-L1 expression when A498 cells were treated with increasing concentrations of KEAP1-NRF2 pathway inhibitor Sulforaphane with and without RT.
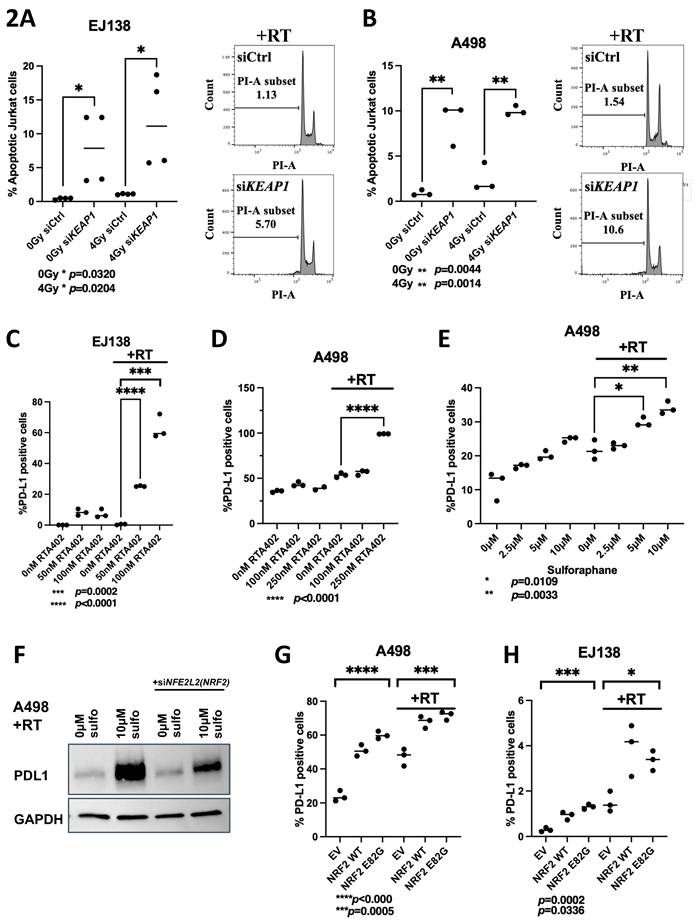
Since the canonical role of KEAP1 was to regulate NRF2 protein stability, we decided to investigate whether this KEAP1-dependent PD-L1 upregulation was mediated through NRF2 stabilization. Treatment of RCC cells with the KEAP1 inhibitors RTA402 and sulforaphane resulted in a significant, dose-dependent increase in PD-L1 expression following RT (Figure 2C-E, S2F-H). In contrast, knockdown of NFE2L2 (NRF2) by siRNA in A498 cells attenuated sulforaphane-induced PD-L1 upregulation after RT (Figure 2F). This suggests that PD-L1 upregulation was mediated through aberrant NRF2 stabilization. To validate these findings, we transfected A498 and EJ138 cells with either empty vector (EV), or plasmids encoding NRF2 wild type (WT) or KEAP1-resistant NRF2-E82G mutant and performed flow cytometry and western blotting to assay PD-L1 expression[31]. In both RT treated and untreated cells, exogenous upregulation of NRF2 WT and E82G significantly upregulated the expression of PD-L1 in A498 (Figure 2G, S2I) and EJ138 cells (Figure 2H, S2J). We also confirmed that KEAP1 inhibitor treatment led to the upregulation of the NRF2 target genes HMOX1, GCLM and TXNRD1 (Figure S2K-N) [32, 33]. Taken together, these results indicate that KEAP1 inhibition lead to increased PD-L1 expression through aberrant NRF2 activation.
NRF2 activation synergizes with PD-L1 inhibition and RT in vivo
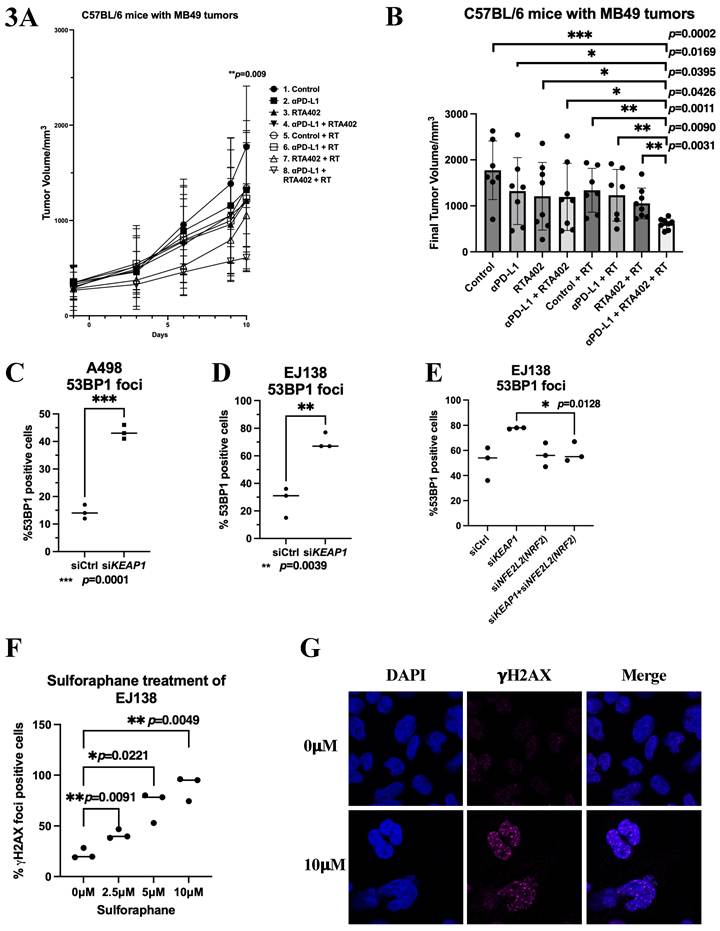
To investigate whether PD-L1 upregulation enhances urinary system tumor responsiveness to PD-L1 blockade, we used an in vivo bladder cancer model with the syngeneic MB49 cell line in C57BL/6 mice. Flow cytometry confirmed that PD-L1 expression in MB49 cells is increased following irradiation in vitro, and this effect is further amplified by NRF2 activation (Figure S3A). We next conducted in vivo experiments in which MB49 cells were inoculated into C57BL/6 mice. Mice were then treated with PD-L1 antibodies, RT, the small-molecule NRF2 activator RTA402, combinations of two treatments, or all three together (Figure S3B). Notably, triple therapy with RTA402, RT, and PD-(L)1 blockade resulted in a statistically significant reduction in tumor size compared to RT and PD-(L)1 blockade, highlighting the enhanced efficacy of combining NRF2 activation and RT with immune checkpoint blockade in vivo (Figure 3A, 3B).
A) Graph of syngeneic MB49 tumor volume growth over 10 days measured in C57BL/6 mice inoculated subcutaneously with MB49 cells. B) Graph of final tumor volume of syngeneic MB49 tumors in C57BL/6 mice inoculated subcutaneously with MB49 cells. C-D) Quantification of % 53BP1 positive cells in A498 (C) and EJ138 (D) cells treated with RT and transfected with either siCtrl or siKEAP1. E) Quantification of % 53BP1 positive cells in EJ138 cells transfected with either siCtrl, siKEAP1, siNRF2 or siKEAP1 and siNRF2. F) Quantification of % 𝛄H2AX positive cells in EJ138 cells treated with increasing doses of sulforaphane. G) Representative images of 𝛄H2AX positive cells in EJ138 cells treated with 0𝛍M or 10𝛍M of sulforaphane.
KEAP1 silencing leads to increased DNA double-stranded breaks through aberrant NRF2 activation
Since we observed an increase in γH2AX expression by western blot following KEAP1 silencing (Figure 1F, 1H), indicating DNA damage, we next assessed DNA double-strand breaks by examining 53BP1 foci formation. KEAP1 silencing significantly increased 53BP1 foci in both A498 (Figure 3C, S3C) and EJ138 (Figure 3D, S3D) cells. Notably, this increase in DNA damage was abolished when KEAP1 and NFE2L2 (NRF2) were simultaneously silenced, as demonstrated by microscopy (Figure 3E, S3E). These findings suggest that KEAP1 inhibition promotes DNA damage through aberrant stabilization of NRF2. Consistently, treatment with the NRF2 activator sulforaphane induced a dose-dependent increase in γH2AX foci formation (Figure 3F-G). Moreover, exogenous overexpression of NRF2-E82G (KEAP1 resistant mutant) significantly increased γH2AX foci formation following RT in EJ138 cells (Figure S3F-G). Taken together, these results indicate that aberrant NRF2 stabilization increases DNA double-strand breaks after RT. Importantly, KEAP1 mutations in cancers have been linked to an increase in tumor mutational burden (TMB) in several studies, and our findings might point to a potential mechanism for this increase in TMB[34-36].
KEAP1 silencing/aberrant NRF2 activation led to an increase in DNA damage due to an increase in pathological R-loops
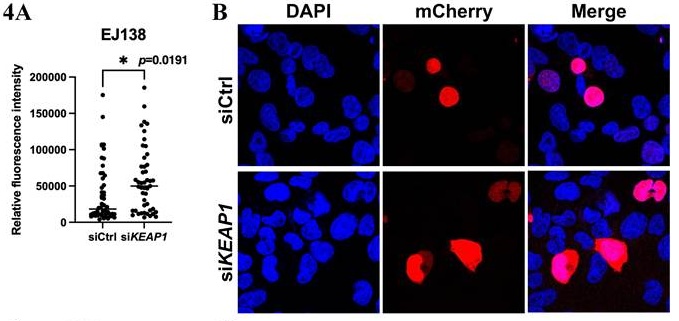
We next sought to identify the mechanism through which KEAP1 loss led to an increase in DNA damage. KEAP1 loss drives aberrant NRF2 signaling, upregulating NRF2 target genes transcription. We hypothesized that this abnormal increase in transcription causes a buildup of pathological R-loops, RNA-DNA hybrids formed during transcription, which interfere with DNA repair processes and ultimately lead to increased DNA damage[37]. RNaseH1 is a nuclease responsible for the degradation of R-loops in cells[38]. To assess R-loop levels, we employed a plasmid encoding an mCherry-tagged, catalytically inactive mutant of RNaseH1 obtained from Addgene[39]. Although this mutant is incapable of resolving R-loops, it retains its ability to bind these structures. Consequently, quantification of the mCherry fluorescence intensity of the tagged protein provides a measure of cellular R-loop abundance. We found that KEAP1 silencing and RT led to a significant increase in R-loops in both EJ138 and A498 cells (Figures 4A, 4B, S4A). To confirm our findings, we assayed the expression level of a second R-loop marker, DHX9, in EJ138 cells. DHX9 expression was also significantly increased 4h after RT when KEAP1 was silenced and it rose in a dose-dependent manner upon sulforaphane treatment (Figure S4C-D). We then performed a double knock-down of both KEAP1 and RNASEH1 and found that PD-L1 expression was upregulated to a larger extent compared to silencing of either gene alone (Figure 4C). If this upregulation of R-loops was indeed a result of an abnormal increase in transcription, addition of a transcription inhibitor should abrogate this R-loop increase. To test this, we used a transcription inhibitor flavopiridol to treat the cells. Addition of flavopiridol after KEAP1 silencing and RT led to downregulation of R-loop levels when compared to KEAP1 silencing and RT (Figure S4E). Taken together, these data suggest that KEAP1 loss and aberrant NRF2 activation led to an increase in cellular DNA damage after radiation treatment due to an abnormal increase in transcription, pathological R-loop formation, replication fork instability and this is potentially linked to PD-L1 upregulation.
A) Quantification of relative mCherry-mutant-RNaseH1 fluorescence intensity in EJ138 cells transfected with either siCtrl or siKEAP1 (as a readout of R-loop levels in cells). B) Representative images of EJ138 cells transfected with mCherry-mutant-RNaseH1 showing increased mCherry fluorescence intensity with KEAP1 silencing. C) Western blot of KEAP1, RNaseH1, PD-L1 and GAPDH in EJ138 cells treated with RT and transfected with either siCtrl, siKEAP1, siRNaseH1 or siKEAP1+siRNaseH1. D) Flow cytometry measuring PD-L1 positivity in EJ138 cells treated with RT and transfected with either GFP and siCtrl, GFP and siKEAP1, GFP-RNaseH1 and siCtrl or GFP-RNaseH1 and siKEAP1. E) Immunofluorescence images showing gH2AX foci (magenta) in EJ138 cells transfected with either GFP and siCtrl, GFP and siKEAP1, GFP-RNaseH1 and siCtrl or GFP-RNaseH1 and siKEAP1 treated with RT. White arrows indicate GFP-RNaseH1 positive cells with no gH2AX foci. F) Quantification of gH2AX foci in (E).
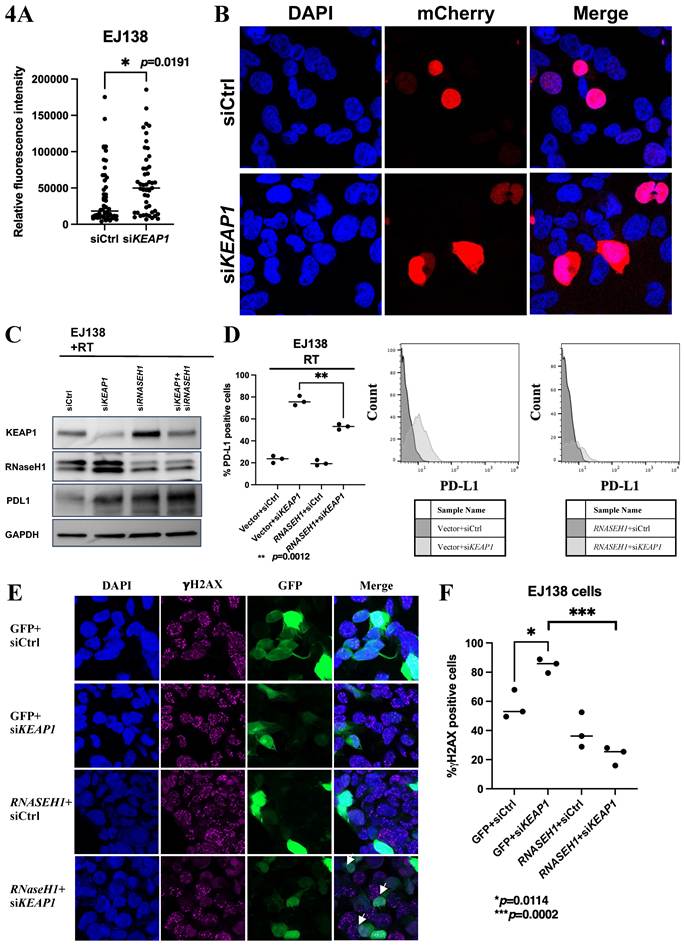
We next investigated whether enhancing R-loop resolution through overexpression of wild-type RNaseH1 could rescue the PD-L1 upregulation and DNA damage caused by KEAP1 silencing. To test this, we overexpressed a plasmid encoding GFP-tagged wild-type RNaseH1 in EJ138 cells and performed flow cytometry to measure PD-L1 levels in GFP-positive cells. RNaseH1 overexpression was sufficient to reverse the increase in PD-L1 induced by KEAP1 silencing (Figure 4D). Additionally, immunofluorescence analysis of EJ138 cells transfected with plasmid encoding GFP-tagged RNaseH1 showed a reduction in γH2AX foci formation following RT (Figures 4E and 4F), indicating decreased DNA damage. Taken together, RNaseH1 overexpression was sufficient to rescue for both PD-L1 upregulation and DNA damage induced by KEAP1 silencing, supporting the conclusion that R-loop accumulation drives these effects.
KEAP1 silencing/aberrant NRF2 activation led to PD-L1 upregulation through the activation of the STING pathway and upregulation of Type I Interferon expression
Increased in R-loop accumulation has been frequently associated heightened replication stress, the cells were therefore assessed for replication stress marker pChk1. A pronounced increase in Chk1 phosphorylation was observed after exogenous overexpression of plasmid encoding NRF2 WT and NRF2 E82G, as well as upon KEAP1 silencing in A498 (Figure 5A-B).
A) Western blot of pChk1, Chk1 and GAPDH in A498 cells transfected with empty vector, wild type NRF2 or E82G NRF2 with or without RT. B) Western blot of pSTAT1, STAT1, pChk1, Chk1, KEAP1, NRF2, PD-L1 and 𝛃-Actin in A498 cells transfected with either siCtrl or siKEAP1, with or without RT. C-D) Quantitative real time PCR analysis of IFNA1 (C) and IFNB1 (D) in A498 cells transfected with either siCtrl or siKEAP1, with or without RT. E-F) Quantitative real time PCR analysis of IFNA1 (E) and IFNB1 (F) in EJ138 cells transfected with either siCtrl or siKEAP1, with or without RT. G-H) Quantitative real time PCR analysis of IFNA1 (G) and IFNB1 (H) in A498 cells treated with 0nM or 50nM of RTA402, with or without RT. I-J) Quantitative real time PCR analysis of IFNA1 (I) and IFNB1 (J) in A498 cells transfected with either siCtrl, siKEAP1, siSTING or siKEAP1 and siSTING with RT. K-L) Quantitative real time PCR analysis of CXCL10 (K) and IL6 (L) in A498 cells transfected with either siCtrl or siKEAP1, with or without RT. M-N) Quantitative real time PCR analysis of CXCL10 (M) and IL6 (N) in A498 cells transfected with either siCtrl, siKEAP1, siSTING or siKEAP1 and siSTING with RT.
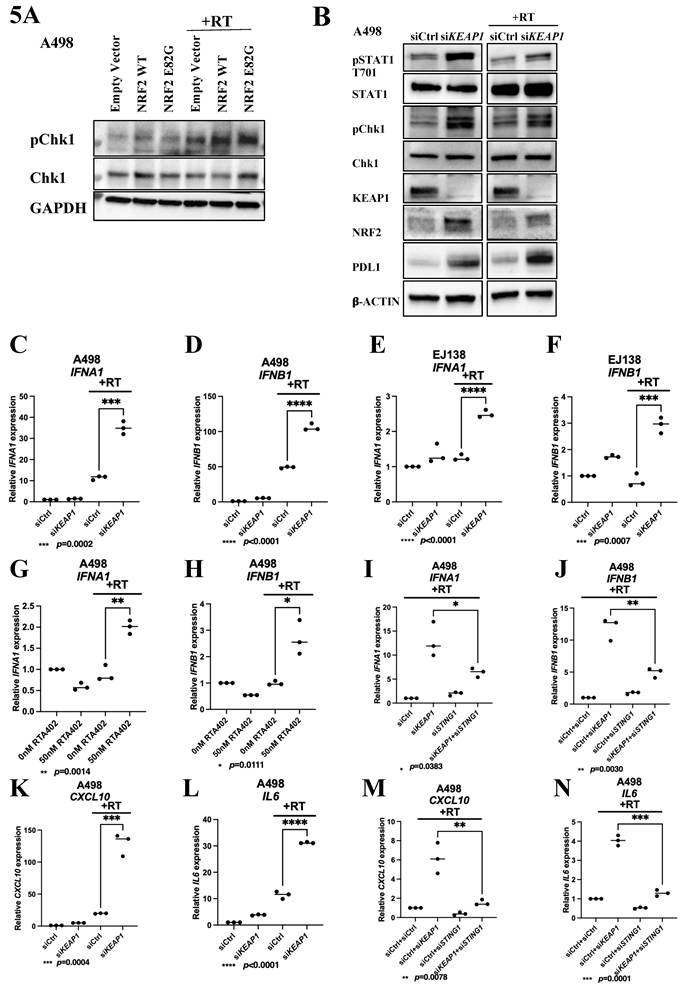
Increased replication stress had been shown to lead to PD-L1 upregulation through the STING pathway via Type I interferon (IFN) signaling, we therefore decided to investigate the involvement of this pathway. We observed an increased phosphorylation of STAT1 after KEAP1 silencing in A498 cells, suggesting that PD-L1 overexpression may result from STAT1 activation and its downstream Type I IFN signaling (Figure 5B). Additionally, silencing of KEAP1 in combination with RT in EJ138 cells led to an increase in the STING pathway target phospho-IRF3 (Figure S5A). Consistent with findings from our western blots (Figures 5A, B and S5A), RNAseq analyses of EJ138 and A498 cells following KEAP1 silencing, with and without RT, identified a common set of upregulated genes, including CD274 (PD-L1), Type I interferons (IFNs), CXCL10, CXCL11 and IL6 (Figure S5B). Validation of the RNAseq findings by qPCR demonstrated that in both A498 and EJ138 cells, Type I IFN expression were significantly upregulated after KEAP1 silencing and RT (Figures 5C-F). Similar results were obtained when NRF2 activator RTA402 was used to treat A498 (Figures 5G-H). When STING1 was silenced with an siRNA (Figure S5C), Type I IFN upregulation was abrogated (Figures 5I and J), indicating that this phenotype was driven by the STING pathway.
The RNAseq results also revealed an upregulation of the immune modulatory chemokines CXCL10 and CXCL11, which had been associated with enhanced response to PD-L1 blockade (Figure S5B), as well as the pro-inflammatory cytokine IL6, previously associated with increased PD-L1 expression [40-44]. RNAseq findings were validated by qPCR in A498 cells (Figures 5K and 5L). IL6 and CD274 (PD-L1) expression were both also significantly upregulated with RTA402 treatment after RT in A498 cells (Figures S5D and S5E). The increase in CXCL10 and IL-6 expression was STING-dependent; silencing STING1 significantly reduced the upregulation of both CXCL10 and IL-6 (Figures 5M and 5N). Additionally, treating EJ138 cells with siKEAP1 or sulforaphane in combination with RT increased micronuclei formation, which is associated with STING activation (Figure S5F-G). While sulforaphane treatment led to an upregulation of IFNA1 in EJ138 and A498 corresponding to this STING activation, this was suppressed by the silencing of NFE2L2 (NRF2) (Figure S5H). Taken together, these results suggested that KEAP1 loss or aberrant NRF2 stabilization led to an increase in R-loops, replication stress and subsequently DNA damage, leading to the upregulation of the STING pathway, which in turn upregulated Type I interferons, CXCL10 and IL6.
R-loops preferentially form at NRF2 target genes and immunity-related genes
Since our hypothesis was that KEAP1 loss and radiation-induced stress increase NRF2 stabilization-driven transcription-associated R-loop formation, we mapped the loci at which R-loop accumulate by R-ChIP-seq in EJ138 cells following KEAP1 inhibition and radiotherapy (Figure 6). First, we analyzed the distribution of R-loops around gene structural elements. We found that R-loops preferentially form at introns for all conditions, in agreement with the findings from a recent publication on ultra-deep coverage single molecule R-loop footprinting (Figure S6A) [45]. Combined KEAP1 silencing and RT resulted in R-loop formation at approximately 602 unique loci, representing approximately 11% of all R-loop-forming loci identified (Figure 6A). To explore the biological processes associated with these loci, we performed gene set enrichment analysis using the MSigDB Hallmark gene sets with correction for multiple testing. The reactive oxygen species (ROS) pathway was the top-ranked pathway, although its enrichment did not reach statistical significance after multiple-testing correction (p=0.07, p.adj=0.7; Figure 6B). The leading-edge genes contributing to this enrichment included GCLM and HMOX1, established NRF2 target genes. Additionally, R-loops were also detected at innate immunity related genes OAS2 and DDX56 after KEAP1 silencing and RT. These findings suggest that radiation-associated transcriptional stress affects both antioxidant and innate immune gene programs and may provide a mechanistic link between aberrant NRF2 activity, R-loop accumulation, and subsequent innate immune signaling.
A) R-loop profiling data across different experimental conditions and its pathway analysis. A four-way Venn diagram illustrates the overlap of R-loop-associated genes among conditions including siCtrl no RT, siKEAP1 no RT, siCtrl RT, siKEAP1 RT. Of particular interest, 602 genes (11%) were uniquely detected with R-loops in the siKEAP1-RT condition. B) Gene Set Enrichment Analysis (GSEA) results for these siKEAP1-RT-specific genes, with genes ranked based on their R-loop peak density. The analysis revealed significant enrichment in immune response-related pathways, with p-values ranging from 0.0417 to 0.0578. C-F) R-ChIP qPCR of GCLM (C), HMOX1 (D), DDX56 (E) and OAS2 (F).
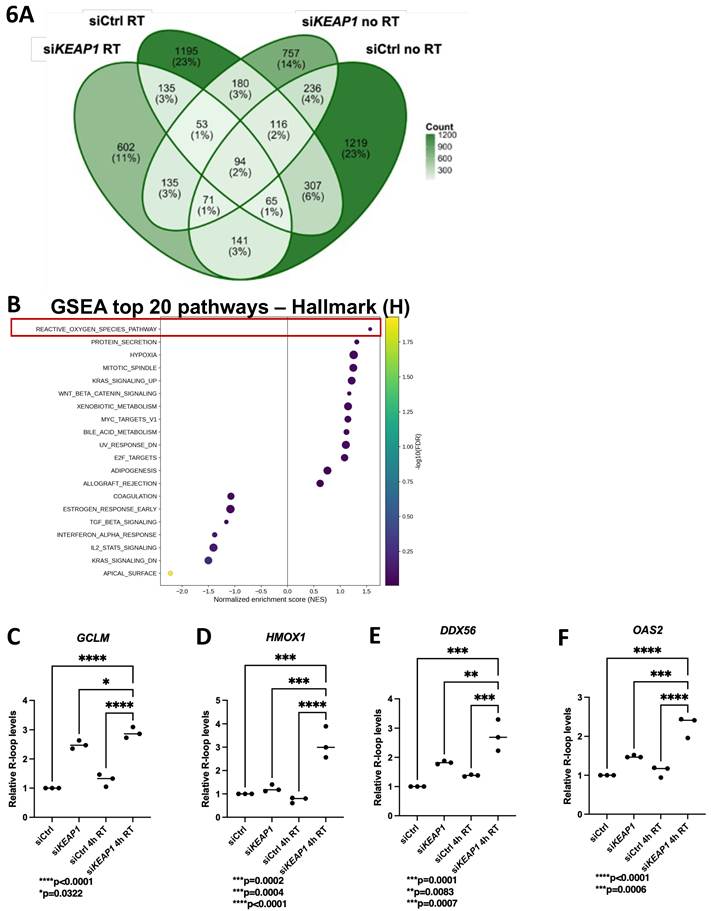
Given the exploratory nature of the enrichment analysis, we subsequently performed targeted validation of selected genes by R-ChIP-PCR and quantitative real-time PCR. We designed specific primers surrounding R-loop forming regions at the NRF2 target genes GCLM and HMOX1 loci (schematic of experimentally validated ARE sites shown in Figure S6B), which were picked up through R-ChIP seq, and performed validation R-ChIP qPCR[46, 47]. We found significantly higher R-loops forming at GCLM and HMOX1 loci under combined elements of KEAP1 inhibition and RT, compared to either treatment alone or untreated control (Figure 6C and D). This was accompanied by a significant upregulation of GCLM and HMOX1 expression (Figure S6B and C).
We also sought to validate 2 immune related genes that R-loops form specifically at, OAS2 and DDX56, by RChIP qPCR. Similar to GCLM and HMOX1, we found significantly higher R-loops forming at OAS2 and DDX56 under combined elements of KEAP1 inhibition and RT, compared to either treatment alone or untreated control (Figure 6E and F). This was accompanied by a significant upregulation of OAS2 and DDX56 expression (Figure S6D and E). Taken together these data suggest that an upregulation of transcription at NRF2 target genes as well as immune-related genes led to the R-loop increase in irradiated cells when KEAP1 is inhibited.
KEAP1 silencing led to an upregulation of type I interferon, CXCL10, IL6 and CD274 (PD-L1) expression after cisplatin treatment
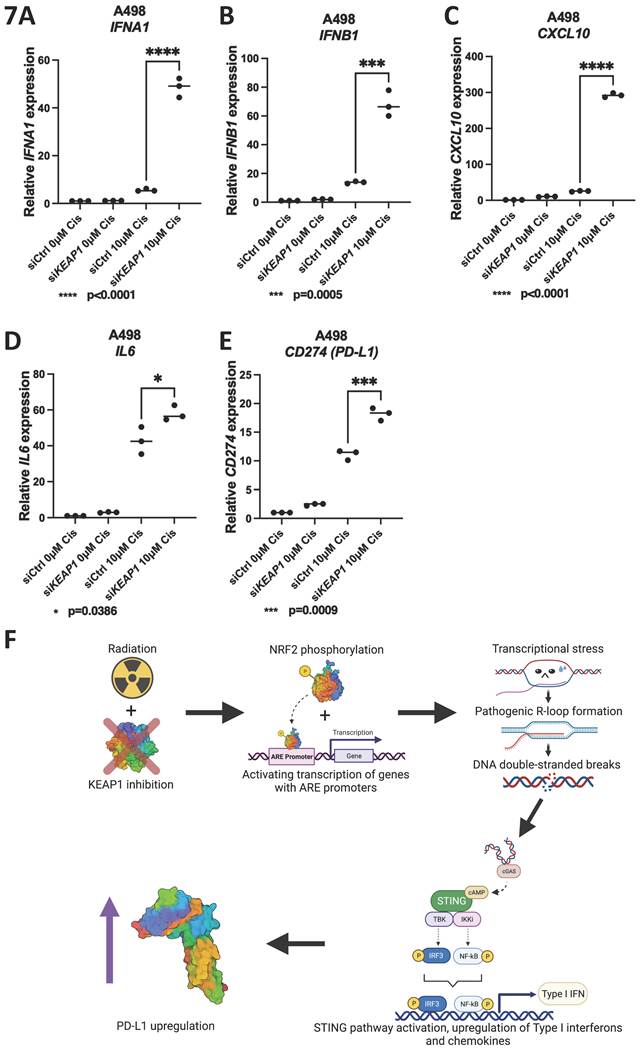
Next, we asked whether other sources of genotoxic cancer therapies gave the same phenotype as RT after KEAP1 silencing. We treated A498 cells with 10μM of cisplatin after KEAP1 silencing and performed qPCR for Type I IFN, CXCL10, IL6 and CD274 (PD-L1) expression. Cisplatin treatment and KEAP1 silencing led to a significant upregulation of type I interferon, CXCL10, IL6 and CD274 (PD-L1) expression (Figure 7A-E). This suggested that other forms of genotoxic treatments might synergize with KEAP1 silencing or NRF2 activation, possibly due to the novel role of the KEAP1/NRF2 pathway in DNA repair and innate immunity.
A-E) Quantitative real time PCR analysis of IFNA1 (A), IFNB1 (B), CXCL10 (C), IL6 (D) and PD-L1 (E) in A498 cells after transfection with siCtrl or siKEAP1 and treatment with either 0µM or 10µM of Cisplatin. F) Schematic describing how KEAP1 silencing lead to R-loop upregulation, STING pathway activation and PD-L1 upregulation.
Kinetics of DNA Damage and PD-L1 Upregulation with KEAP1 Inhibition
We examined the kinetics of γH2AX and PD-L1 protein expression following KEAP1 inhibition and RT over time in urinary system cancer cell lines. In EJ138 cells, γH2AX foci peaked at 4 hours post-RT and gradually decreased, returning to baseline levels by 48 hours post-RT (Figure S7A), consistent with the resolution of DNA damage after an initial response. Treatment of EJ138 cells with sulforaphane led to a dose-dependent increase in PD-L1 expression, as measured by flow cytometry, beginning at 4 hours after RT and sustained up to 48 hours post-RT. This finding aligns with our observation that Type I interferon levels increased at 48 hours following RT with KEAP1 inhibition (Figure S7B). Similar patterns were observed in 786-O cells treated with sulforaphane, as demonstrated by both western blotting and flow cytometry analyses for PD-L1 expression (Figures S7C-D).
Discussion
Immune checkpoint blockade has revolutionized cancer therapy due to its ability to induce durable responses even in patients with metastatic disease. However, response rates remain low, and novel approaches are desperately needed to improve response in patients. Here, through a CRISPR screen, we have identified a novel pathway regulating radiation-induced PD-L1 expression - the KEAP1-NRF2 pathway. Through our experiments, we have established that both silencing KEAP1 and aberrantly activating NRF2 led to the overexpression of PD-L1 after radiation treatment. Using a small molecule NRF2 activator, we demonstrated in a mouse bladder cancer model that co-treatment with radiation and PD-L1 inhibitor led to significant inhibition of tumor growth. Surprisingly, we found that this PD-L1 upregulation was through a DNA damage-dependent mechanism, through the accumulation of unscheduled R-loops resulting from the loss of KEAP1 or activation of NRF2. We confirmed our observations by rescuing PD-L1 upregulation and DNA damage through the overexpression of RNaseH1, an R-loop specific nuclease.
Since the KEAP1-NRF2 pathway components are frequently mutated in cancers, our findings raised the question of whether the presence of KEAP1 or NFE2L2 (NRF2) mutations in tumor cells predicts response to cancer immunotherapy. In some non-small cell lung cancer cell lines, KEAP1 had been found to negatively regulate PD-L1 through direct interaction and degradation induction[48]. Interestingly, in these non-small cell lung cancer patient-derived xenografts, KEAP1 promotion of PD-L1 degradation led to enhanced sensitivity to anti-PD-L1 immunotherapy. In contrast to our findings, KEAP1 silencing or inhibition had been found to lead to PD-L1 downregulation in some ovarian cancer and pancreatic cancer cell lines through NRF2 mediated PD-L1 transcriptional silencing[49]. On the other hand, in another study on lung cancer, while PD-L1 was not directly measured, KEAP1 mutations were directly linked to immune evasion through NRF2 hyperactivation[50]. This points to a potential context-dependent regulation of PD-L1 by different tissue types and with or without genotoxic treatment.
KEAP1 mutations have been found to be associated with worse outcome and an immunologically cold tumor microenvironment in cancers despite having a higher tumor mutational burden[27, 51]. The discrepancy between our experimental findings and what is seen in KEAP1 mutant tumors might be explained by the acute activation of NRF2 and additional radiation treatment performed in our experiments as compared to the chronic activation of NRF2 in KEAP1 mutant tumors. Interestingly, a recent study showed that having a co-existing TP53 mutation makes KEAP1 mutant tumors immunologically hot compared to tumors with KEAP1 mutations alone, suggesting that stratifying KEAP1 mutant tumors by TP53 status might better inform immunotherapy treatment decisions[52]. This also suggests that p53 might play a role in blunting the anti-tumor immune response in KEAP1 mutant tumors. The interplay between TP53 and KEAP1 mutations and their effects on the tumor microenvironment therefore warrants further investigation.
While KEAP1 mutations and NRF2 dysregulation are known tumorigenic processes, the mechanism of how tumorigenesis occurs remains unclear and was generally believed to occur through a mixture of various metabolic reprogramming processes[53-55]. Here, our data suggests that at least two other hallmarks of cancers might be involved in the tumorigenic process: genome instability and immune evasion[56]. Firstly, we have shown that KEAP1 loss or NRF2 activation led to an increase in unscheduled R-loop formation, which in turn lead to an increase in transcription-replication conflicts, replication stress and DNA damage. This suggests that KEAP1 mutations lead to genomic instability, which is supported by the fact that KEAP1 mutant tumors have a higher tumor mutational burden (TMB)[51]. Secondly, we showed that KEAP1 loss or NRF2 activation led to an increase in PD-L1 expression, an immune checkpoint protein which increases immune evasion. A caveat of correlating our findings to KEAP1 mutations in a tumor would be that our experiments mostly involved an additional element of radiation treatment. However, it is still worth investigating whether genome instability and immune evasion contribute to NRF2-driven tumorigenesis in a de novo tumor formation model.
KEAP1 mutant tumors are also resistant to various therapies and KEAP1 mutations were significantly correlated with a negative prognosis in non-small cell lung cancers (NSCLCs)[57]. Our data suggests that DNA damage resulting from an increase in unscheduled R-loop formation and replication stress likely contributed to an increase in TMB in KEAP1 mutant tumors. This raises the interesting possibility that therapies targeting replication stress such as ATR inhibitors, Chk1 inhibitors and Wee1 inhibitors might work well in these tumors, improving survival and prognosis in this group of patients.
Another area of research that warrants further investigation is the role of R-loops in immunotherapy response. While DNA damage in general had been linked to increased inflammation and enhanced immunotherapy response, the specific role of R-loops remained underexplored. Based on our CRISPR screen results and experimental findings, R-loops might play a larger role in innate immunity and PD-L1 regulation than appreciated. Targeting R-loop regulatory proteins might therefore provide a unique therapeutic opportunity to enhance cancer immunotherapy response. On the other hand, the development of reliable immunohistochemical stains for R-loops might also be useful as a biomarker for response to cancer immunotherapy.
Additionally, we found that the accumulation of pathogenic R-loops led to the activation of the cGAS-STING pathway in cancer cells. While activation of the cGAS-STING pathway in interphase leads to an inflammatory response, it had been demonstrated that cGAS activation can also promote apoptosis during mitotic arrest[58]. As radiation triggers mitotic arrest, the combination of radiation treatment with KEAP1 silencing might lead to cGAS activation-driven apoptosis in cells. This remains to be investigated.
Interestingly, in contrast to our findings, overexpression of KEAP1 had been shown to increase R-loops through increasing the ubiquitination and degradation of R-loop regulator SETX. In this study, the experiments were done in normal cells and RT was not conducted, and these could explain the contradictory findings[59].
Another unexpected finding that we had was the upregulation of immune related genes upon irradiation of KEAP1 inhibited urinary system cancer cells, including OAS2 and DDX56, which have known roles in anti-viral immunity. Little is known about the role of these two genes in cellular response to radiation. This adds another dimension to the interaction between the KEAP1-NRF2 pathway, radiation treatment, cGAS-STING pathway and innate immunity that resulted in PD-L1 upregulation and warrants future studies.
In conclusion, our study had unveiled several novel aspects about radiation-induced PD-L1 regulation, including a connection to the KEAP1-NRF2 pathway through the dysregulation of R-loops and the activation of the cGAS-STING pathway. We propose the development of novel small molecule modulators of the KEAP1-NRF2 pathway in combination with PD-L1 inhibitors as novel immunostimulatory therapeutics to enhance radiation and anti-PD-L1 response in cancer patients.
Research limitations
This study primarily utilized genitourinary cancer cell models, which may limit the generalizability of our findings to other tumor types with distinct molecular or immunological characteristics. In addition, in vivo analyses were constrained, as combination treatment led to marked tumor growth inhibition, reducing the availability of viable, non-necrotic tumor tissue for further molecular characterization. Finally, beyond radiotherapy and cisplatin, we did not examine how other classes of genotoxic cancer therapies influence tumor cell PD-L1 expression, which warrants further investigation.
Declaration of generative AI usage
During the preparation of this work, the authors used OpenAI's ChatGPT to improve the language clarity and overall readability of the text. After utilizing this tool, the authors thoroughly reviewed, verified, and edited the generated texts as necessary, and take full responsibility for the accuracy, integrity, and original content of the published article.
Materials and Methods
Genome-scale genetic screen methods
Human CRISPR Knockout Pooled Library (Brunello, Pooled Library, Addgene #73179) was used for genome-wide CRISPR/Cas9 knockout screenings on renal cancer cell line 786-O [60, 61]. The CRISPR library was amplified in DH5α bacteria strain and virus packaged in HEK293T cells. To obtain a MOI=0.3 in the initial prep of library transduced cells, virus titration of was performed by seeding 1000 cells per well in a 96-well culture plate in 50μl of cell culture media. A serial dilution of lentiviral supernatant in culture medium (50µl) was then added and incubated for 16 hours, followed by puromycin selection (1µg/ml) for 48 hours. Cell-Titer Glo (Promega # G7573) was used following manufacturer's instruction to evaluate virus titer of Brunello library in 1ml of lentivirus supernatant[60]. Following that, 26.7 million cells were infected with virus carrying the CRISPR library at an MOI=0.3 and incubated for 16 hours. 48 hours post-infection, puromycin (1µg/ml) selection was performed for 3 days to eliminate approximately 70% of uninfected cells. 8 million transduced cells were harvested on Day 5 post puromycin incubation to ensure complete representation of sgRNA library (over 100-fold coverage of the whole library) in a cell population. The rest of the cells were propagated for 14 days to allow the exertion of phenotypes caused by gene depletions. On Day 19 post puromycin incubation, 8 million transduced cells were harvested to identify genes essential in cell survival and proliferation (by comparing the sgRNA changes against the original sgRNA representation on Day 5). 80 million cells were treated with irradiation (4 Gy on 2 consecutive days) together with 8 million untreated cells as control. Two days post irradiation, irradiated cells were analyzed by FACS against PD-L1 (BD, #563741). Top 10% cells and bottom 10% cells collected by FACS were harvested for genomic DNA. The genomic DNA samples for Day 5, Day 19, irradiated cell sample and control sample were extracted (Qiagen #158906, #158910). sgRNA containing-region was amplified and isolated by electrophoresis 1.5% agarose gel followed by column purification (Qiagen #28706). The purified DNAs were measured with Qubit high sensitivity kit (Qubit # Q32851), diluted to 100nM in nuclease free water and pooled before sending for NGS sequencing on Nextseq 1x76bp platform (Genome Institute of Singapore). The data were analyzed using Mageck pipeline (RRID:SCR_025016)[62]. High rank hits were cross-referenced against published PD-L1 CRISPR screens to identify targets specific to radiation and validated by functional assays [21-23].
Cell culture, transfection, treatment with radiation, RTA402, sulforaphane and cisplatin
786-O and A498 cells (ATCC) were cultured in RPMI medium (Gibco) while EJ138 (ATCC), MB49 (Merck) and 293T (ATCC) cells were cultured in DMEM medium (Gibco). All media contain 10% FBS (Thermo Fisher Scientific), 100U penicillin-streptomycin (Gibco) and 2mM glutamine (Gibco). Cell line authenticity were confirmed using STR analysis and cell lines were regularly tested for mycoplasma contamination. Transfection of siRNA and plasmids were performed with Lipofectamine 2000 (Thermo Fisher Scientific) and transfection efficiency was tested using quantitative real-time PCR, immunoblot or immunofluorescence. SiRNA were purchased from IDT and Merck: siKEAP1 (IDT #hs.Ri.KEAP1.13.1), siRNASEH1 (IDT #hs.Ri.RNASEH1.13.1, # hs.Ri.RNASEH1.13.2, #hs.Ri.RNASEH1.13.3), siCD274 (PD-L1) (#SASI_Hs01_00010203, Merck). For treatment of cells, RTA402 and sulforaphane were purchased from Targetmol (#T6165, #TQ0207), Cisplatin was purchased from Selleckchem (#S1166) and radiation was performed using the gamma irradiator Gammacell-40 (MDS Nordion). Immunofluorescence analyses were performed 4h post RT unless otherwise indicated. Western blots, quantitative real-time PCR and PD-L1 flow cytometry were performed 48h post RT unless otherwise indicated. A minimum of three replicates were performed for all cell culture experiments.
Primary RCC cells were cultured from cryo-preserved tumors obtained from the Singhealth Tissue Repository, dissociated both enzymatically and mechanically into single cells and maintained in RPMI medium (Gibco) containing 10% FBS (Thermo Fisher Scientific), 100U penicillin-streptomycin (Gibco) and 2mM glutamine (Gibco). Written informed consent from the patients for use of their biospecimens and clinical data was obtained in accordance with the Declaration of Helsinki. Tissue collection and consent protocols were under ethics approval from the SingHealth Centralized Institution Review Board (Study 2010/735/B). Cells from each cell line were stained with hematoxylin and eosin, and their cancerous nature was confirmed by a pathologist.
Immunoblot
Cells were lysed with buffer containing 300mM NaCl, 50mM Tris-Cl pH 7.6, 1mM EDTA and 0.5% NP-40 and protease inhibitors (Roche). Protein lysates were quantified with Protein Assay Dye Reagent (Biorad), separated by SDS-PAGE and transferred onto nitrocellulose membranes. Membranes were incubated with the following antibodies: anti-human PD-L1 (Thermo Fisher Scientific #PA5-28115 RRID:AB_2545591), anti-phospho-histone H2A.X (CST #2577S RRID:AB_2118010), anti-GAPDH (CST #5174S RRID:AB_10622025), anti-phospho-TBK1 (CST #5483S RRID:AB_10693472), anti-TBK1 (CST #3504S RRID:AB_2255663), anti-phospho-Chk1 (CST #2348S RRID:AB_331212), anti-Chk1 (CST #2360S RRID:AB_2080320), anti-phospho-STAT1 (CST #9167S RRID:AB_561284), anti-STAT1 (CST #9176S RRID:AB_2240087), anti-KEAP1 (CST #8047S RRID:AB_10860776), anti-NRF2 (Abcam #ab137550 RRID:AB_2687540), and anti-beta-Actin (CST #4970S RRID:AB_2223172).
RT-qPCR analysis
Total RNA from cells was isolated using the Favorprep Blood/Cultured cell Total RNA Mini Kit (Favorgen) and cDNA was synthesized using RevertAid First Strand cDNA Synthesis Kit (Thermo Fisher Scientific). RT-qPCR was performed using SYBRTM Green PCR Master Mix (Thermo Fisher Scientific). Primer sequences are provided in supplementary document.
Flow cytometry and fluorescence activated cell sorting (FACS)
Cells were harvested with 10mM EDTA in PBS, washed once with PBS then stained for 30min with APC-tagged mouse anti-human PD-L1 antibody (Clone MIH1, BD Biosciences #563741 RRID:AB_2738399) or APC-tagged rat anti-mouse PD-L1 antibody (Clone 10F.9G2, Biolegend #124312 RRID:AB_10612741) at a 1:1000 dilution in a PBS buffer with 2% FBS and 2mM EDTA. Cells were then washed and analyzed by flow cytometry (BD LSR Fortessa X-20). Analyses for flow cytometry were done using the Flowjo software (RRID:SCR_008520). For FACS, cells were sorted by PD-L1 expression (BD FACS Aria III) where the top 10% PD-L1 expressing cells and bottom 10% PD-L1 expressing cells were collected for downstream processing.
In vitro co-culture assay
Co-culture experiments with Jurkat cells were adapted from Kataoka et al[30]. Tumor cells were first plated onto 6-well plates, transfected with control siRNA or siRNA against KEAP1, then irradiated. Jurkat cells were separately activated with phytohemagglutinin (PHA) and stained with CFSE. Jurkat cells were then added to tumor cells at a 1:1 ratio and co-cultured for 48h. Cells were then harvested and stained for PI then analyzed by flow cytometry (BD LSR Fortessa X-20). Analyses for flow cytometry were done using the Flowjo software.
Immunofluorescence
Cells were plated onto glass round coverslips in 24-well plates and transfected with the respective siRNA. For R-loop visualization, cells were transfected with a plasmid encoding a nuclease-dead RNaseH1 mutant tagged with mCherry (Addgene RRID:Addgene_60367)[39]. For overexpression of wild-type RNaseH1, cells were transfected with a plasmid encoding GFP-tagged wild-type RNaseH1 (Addgene RRID:Addgene_108699)[63]. For radiation treatment, plates were then irradiated at 4Gy (MDS Nordion Gammacell-40) and fixed with 4% formaldehyde in PBS 4h after. Coverslips with cells that were transfected with mutant mCherry-tagged RNASEH1 plasmid were then mounted onto glass slides using mounting medium containing DAPI (Vectashield RRID:AB_2336788) and imaged immediately after fixation. Cells that were stained for 𝛄H2AX and 53BP1 foci were fixed with 4% formaldehyde, then extracted on ice for 10min with 0.3% Triton X-100 in PBS. They were then blocked for 30 min at room temp with blocking buffer (5% BSA and 0.1% Triton X-100 in PBS) and incubated with primary antibody diluted 1:1000 in blocking buffer overnight. After primary antibody incubation, cells were washed and incubated with secondary antibodies, then washed and mounted with mounting medium containing DAPI (Vectashield RRID:AB_2336788). Primary antibodies used were rabbit anti-𝛄H2AX (CST #2577S RRID:AB_2118010) and rabbit anti-53BP1 (CST #4937S RRID:AB_10694558), secondary antibodies used were goat anti-rabbit Alexa Fluor 488 (Thermo Fisher Scientific #A-11008 RRID:AB_143165) and goat anti-rabbit Alexa Fluor 568 (Thermo Fisher Scientific #A-11011 RRID:AB_143157). Immunofluorescence measurements were all quantified using the Image J software (RRID:SCR_003070) correcting for background fluorescence and normalized to cell number unless otherwise stated.
RNAseq
Following RNA extraction, 1μg of total RNA from each sample were submitted to Macrogen for library prep (Illumina) and RNAseq (Illumina Hiseq4000) in a paired-end configuration. RNA-Seq reads were pre-processed using trimmomatic v0.39 with the following parameters (ILLUMINACLIP:TruSeq3-PE.fa:2:30:10 LEADING:3 TRAILING:3 SLIDINGWINDOW:4:15 MINLEN:36) to remove contaminating sequences from adaptors and sequences with low base quality[64]. Reads were then aligned to the reference genome (GRCh38) using STAR v2.7.4[65]. Trimmed reads were quantified onto discovered transcripts from gene models using SALMON with parameters ( -lib IU ) and converted to feature counts[66]. DEseq2 was used to model raw gene counts for gene expression using a negative binomial model and identify differentially expressed genes across experimental groups with a padj of 0.05 and Log2FoldChange>1[67]. Raw RNAseq data have been uploaded to NCBI bioproject PRJNA1112088.
In vivo RT in C57BL/6 mice
The study is compliant with all relevant ethical regulations regarding animal research. Animal experiments were approved by the Singhealth Institutional Animal Care and Use Committee (IACUC), protocol number 2023/SHS/1785. Sex was not considered as a biological variable. MB49 cell line was cultured in DMEM+10% FBS. 0.1x10^6 cells were subcutaneously injected into flank of 5-6 week female C57BL/6J (RRID:IMSR_JAX:000664) mice. 8 mice were randomly assigned to each treatment group, and tumor volumes were averaged out according to size by each group so each group has a similar average tumor volume at the beginning. Tumors from 5 mice did not grow and tumor measurements from these mice were not taken into consideration. This resulted in 7 mice per group for the following groups: Control, αPD-L1, RTA402, Control+RT and αPD-L1+RT. The tumor volume was measured twice per week using digital caliper. The tumor volume is calculated as (mm^3): Width (mm) x Width (mm) x Length (mm) x 0.5. When tumor reached around 250-350mm^3, mice were divided into treatment groups according to the tumor volume to ensure even tumor volume distributed into each group. Mice were orally administrated RTA402 at 40mg/kg (10% DMSO+90% corn oil) the day before irradiation and followed by irradiation with 8 Gy of electron. This dose was selected to mimic stereotactic body radiotherapy, which had previously been shown to synergize better with immunotherapy[68]. 1 hour later, a first dose of anti-PD-L1 antibody 10F.9G2 (InVivoMab) (10 mg/kg) was administered via IP injection. Subsequently, mice were dosed with anti-PD-L1 antibody (10 mg/kg) every 72 hours for two weeks. Control group mice were treated with PBS or dilution buffer. Tumor growth was monitored twice a week until tumors reached 1500-2000mm3. At the end point, mice were sacrificed, and tumors were harvested and measured in a blinded fashion. Measurements were plotted and one-way ANOVA test was used to determine statistical significance of tumor volume difference in mice treated with triple therapy compared to single and double therapy. Xenograft studies were conducted in compliance with animal protocols approved by the SingHealth Institutional Animal Care and Use Committee (IACUC).
RChIP
RChIP was performed according to the following published protocol with slight modifications[28]. Briefly, EJ138 cells were transfected with siRNA, then plasmid expressing V5 tagged RNASEH1 and selected with hygromycin after 24hours. Cells were then fixed with 1% paraformaldehyde. For RT treatment, cells were fixed 4h after RT. SimpleChIP Magnetic Beads kit (CST, 9003S) was adapted for R-loop immunoprecipitation. Nuclei preparation was done by washing pellets with buffers containing 1M DTT and PIC and finally with 1x ChIP buffer followed by sonication at 4°C on high at 15sec ON, 45s OFF for 35 rounds. 50μL of sheared samples were extracted and analysed on gel for QC and quantified with nanodrop. Magnetic beads were incubated overnight at 4°C with 1x ChIP buffer and anti-V5 antibody at 1:50, washed with low salt and high salt buffer the next day and incubated with 10μg of sheared sample overnight. 50μL of sample was set aside as input control. Elution was performed by adding 1x ChIP elution buffer. Crosslinks were then reversed, DNA eluted and QC performed with qPCR. RChIP libraries were then made by adding N9 tags to denatured strands followed by dA tailing along with adaptor ligation and PCR. Libraries were then cleaned up with SPRI beads and analysed with HS D1000 tapestation. Sequencing was performed by Novogene. Raw RChIP data have been uploaded to NCBI Bioproject PRJNA1233472. RChIP-seq data was compared across four experimental conditions: non-irradiated control, non-irradiated KEAP1-knockdown, irradiated control and irradiated KEAP1-knockdown versus INPUT data. Raw sequencing data were processed using the nf-core/chipseq pipeline (v2.1.0), which included read preprocessing, genome alignment, immunoprecipitation enrichment analysis, and peak calling[69]. Comparative analysis of peak profiles across all conditions against matched input controls revealed 602 R-loop regions specific to the IR-KD condition. These IR-KD-specific regions were analyzed using NetworkAnalyst 3.0 for network-based interpretation[70]. Network analysis identified nine distinct subnetworks, with the largest subnetwork (subnetwork #1) comprising 47 genes and transcription factors. Gene Ontology enrichment analysis of this primary subnetwork revealed 120 significantly enriched biological processes (FDR < 0.001)[71].
GSEA, TCGA mutation, expression and other statistical analyses
For GSEA analysis we used the GSEA webtool (https://www.gsea-msigdb.org/gsea/index.jsp) with the MSigDB v.7.5 Hallmarks gene sets collection[72]. For TCGA mutation count and gene expression analyses, we obtained the absolute values from the TCGA website (https://www.cbioportal.org/), plotted the graph and performed statistical analyses using Graphpad Prism. All statistical analyses were performed using Graphpad Prism using a minimum of three replicates unless otherwise indicated, and p-values indicated in the figures.
Plasmids
Plasmids pICE-RNaseHI-D10R-E48R-NLS-mCherry (Addgene plasmid #60367 RRID:Addgene_60367) and pEGFP-RNaseH1 (Addgene plasmid #108699 RRID:Addgene_108699) were purchased from Addgene [39, 63]. Plasmids NRF2-WT and NRF2 E82G were a kind gift from Professor Aikseng Ooi[31].
Statistics and reproducibility
All statistical analyses were performed using GraphPad Prism. Student's t-test (two-tailed) was used for statistical analyses unless otherwise indicated. Error bars shown were s.e.m. P-values for experiments are indicated in the figures, where * denotes 0.01<P<0.05, ** denotes 0.001<P<0.01, *** denotes 0.0001<P<0.001 and **** denotes p<0.0001, determined using at least three biological replicates unless otherwise indicated. All data shown are representative of at least three independent experiments with similar results unless otherwise indicated.
Supplementary Material
Supplementary figures.

Acknowledgements
This research was funded by the National Medical Research Council Open Fund Young Investigator Grant (MOH-000676-00), the National Medical Research Council Singapore Translational Research Investigator Awards (MOH-000248 and MOH-001827), the National Research Foundation Competitive Research Programme (NRF-CRP17-2017-05) and the Houston Methodist Research Institute.
Competing Interests
The authors have declared that no competing interest exists.
References
1. Hodi FS. et al. Improved survival with ipilimumab in patients with metastatic melanoma. N Engl J Med. 2010;363(8):711-23
2. Wolchok JD. et al. Overall Survival with Combined Nivolumab and Ipilimumab in Advanced Melanoma. N Engl J Med. 2017;377(14):1345-56
3. Darvin P. et al. Immune checkpoint inhibitors: recent progress and potential biomarkers. Exp Mol Med. 2018;50(12):1-11
4. de Miguel M, Calvo E. Clinical Challenges of Immune Checkpoint Inhibitors. Cancer Cell. 2020;38(3):326-33
5. Antonia SJ. et al. Durvalumab after Chemoradiotherapy in Stage III Non-Small-Cell Lung Cancer. N Engl J Med. 2017;377(20):1919-29
6. Faivre-Finn C. et al. Four-Year Survival With Durvalumab After Chemoradiotherapy in Stage III NSCLC-an Update From the PACIFIC Trial. J Thorac Oncol. 2021;16(5):860-7
7. Patel SP, Kurzrock R. PD-L1 Expression as a Predictive Biomarker in Cancer Immunotherapy. Mol Cancer Ther. 2015;14(4):847-56
8. Doroshow DB. et al. PD-L1 as a biomarker of response to immune-checkpoint inhibitors. Nat Rev Clin Oncol. 2021;18(6):345-62
9. Azad A. et al. PD-L1 blockade enhances response of pancreatic ductal adenocarcinoma to radiotherapy. EMBO Mol Med. 2017;9(2):167-80
10. Chen MF. et al. The role of PD-L1 in the radiation response and prognosis for esophageal squamous cell carcinoma related to IL-6 and T-cell immunosuppression. Oncotarget. 2016;7(7):7913-24
11. Deng L. et al. Irradiation and anti-PD-L1 treatment synergistically promote antitumor immunity in mice. J Clin Invest. 2014;124(2):687-95
12. Dovedi SJ. et al. Acquired resistance to fractionated radiotherapy can be overcome by concurrent PD-L1 blockade. Cancer Res. 2014;74(19):5458-68
13. Wu CT. et al. The role of PD-L1 in the radiation response and clinical outcome for bladder cancer. Sci Rep. 2016;6:19740
14. Tu X. et al. PD-L1 (B7-H1) Competes with the RNA Exosome to Regulate the DNA Damage Response and Can Be Targeted to Sensitize to Radiation or Chemotherapy. Mol Cell. 2019;74(6):1215-26.e4
15. Gao Y. et al. Acetylation-dependent regulation of PD-L1 nuclear translocation dictates the efficacy of anti-PD-1 immunotherapy. Nat Cell Biol. 2020;22(9):1064-75
16. Du W. et al. KPNB1-mediated nuclear translocation of PD-L1 promotes non-small cell lung cancer cell proliferation via the Gas6/MerTK signaling pathway. Cell Death Differ. 2021;28(4):1284-300
17. Petermann E, Lan L, Zou L. Sources, resolution and physiological relevance of R-loops and RNA-DNA hybrids. Nat Rev Mol Cell Biol. 2022;23(8):521-40
18. Ouyang J. et al. RNA transcripts stimulate homologous recombination by forming DR-loops. Nature. 2021;594(7862):283-8
19. Yang H. et al. The RNA m5C modification in R-loops as an off switch of Alt-NHEJ. Nat Commun. 2023;14(1):6114
20. Vuky J. et al. Long-Term Outcomes in KEYNOTE-052: Phase II Study Investigating First-Line Pembrolizumab in Cisplatin-Ineligible Patients With Locally Advanced or Metastatic Urothelial Cancer. J Clin Oncol. 2020;38(23):2658-66
21. Mezzadra R. et al. Identification of CMTM6 and CMTM4 as PD-L1 protein regulators. Nature. 2017;549(7670):106-10
22. Burr ML. et al. CMTM6 maintains the expression of PD-L1 and regulates anti-tumour immunity. Nature. 2017;549(7670):101-5
23. Suresh S. et al. eIF5B drives integrated stress response-dependent translation of PD-L1 in lung cancer. Nat Cancer. 2020;1(5):533-45
24. Hsu JM. et al. STT3-dependent PD-L1 accumulation on cancer stem cells promotes immune evasion. Nat Commun. 2018;9(1):1908
25. Sheng W. et al. LSD1 Ablation Stimulates Anti-tumor Immunity and Enables Checkpoint Blockade. Cell. 2018;174(3):549-63.e19
26. Wu WL, Papagiannakopoulos T. The Pleiotropic Role of the KEAP1/NRF2 Pathway in Cancer. Annu Rev Cancer Biol. 2020;4:413-35
27. Chen X. et al. Pan-cancer analysis of KEAP1 mutations as biomarkers for immunotherapy outcomes. Ann Transl Med. 2020;8(4):141
28. Chen JY. et al. R-ChIP for genome-wide mapping of R-loops by using catalytically inactive RNASEH1. Nat Protoc. 2019;14(5):1661-85
29. Chen L. et al. R-ChIP Using Inactive RNase H Reveals Dynamic Coupling of R-loops with Transcriptional Pausing at Gene Promoters. Mol Cell. 2017;68(4):745-57.e5
30. Kataoka K. et al. Aberrant PD-L1 expression through 3'-UTR disruption in multiple cancers. Nature. 2016;534(7607):402-6
31. Ooi A. et al. CUL3 and NRF2 mutations confer an NRF2 activation phenotype in a sporadic form of papillary renal cell carcinoma. Cancer Res. 2013;73(7):2044-51
32. Zoja C, Benigni A, Remuzzi G. The Nrf2 pathway in the progression of renal disease. Nephrol Dial Transplant. 2014;29(Suppl 1):i19-i24
33. Lau A. et al. Dual roles of Nrf2 in cancer. Pharmacol Res. 2008;58(5-6):262-70
34. Chen J. et al. Genomic landscape of lung adenocarcinoma in East Asians. Nat Genet. 2020;52(2):177-86
35. Skoulidis F. et al. CTLA4 blockade abrogates KEAP1/STK11-related resistance to PD-(L)1 inhibitors. Nature. 2024;635(8038):462-71
36. Xu X. et al. NFE2L2/KEAP1 Mutations Correlate with Higher Tumor Mutational Burden Value/PD-L1 Expression and Potentiate Improved Clinical Outcome with Immunotherapy. Oncologist. 2020;25(6):e955-e963
37. Garcia-Muse T, Aguilera A. R Loops: From Physiological to Pathological Roles. Cell. 2019;179(3):604-18
38. Parajuli S. et al. Human ribonuclease H1 resolves R-loops and thereby enables progression of the DNA replication fork. J Biol Chem. 2017;292(37):15216-24
39. Britton S. et al. DNA damage triggers SAF-A and RNA biogenesis factors exclusion from chromatin coupled to R-loops removal. Nucleic Acids Res. 2014;42(14):9047-62
40. Noman MZ. et al. Inhibition of Vps34 reprograms cold into hot inflamed tumors and improves anti-PD-1/PD-L1 immunotherapy. Sci Adv. 2020;6(18):eaax7881
41. Limagne E. et al. MEK inhibition overcomes chemoimmunotherapy resistance by inducing CXCL10 in cancer cells. Cancer Cell. 2022;40(2):136-52.e12
42. Liu Z. et al. Rational combination of oncolytic vaccinia virus and PD-L1 blockade works synergistically to enhance therapeutic efficacy. Nat Commun. 2017;8:14754
43. Zhang W. et al. IL-6 promotes PD-L1 expression in monocytes and macrophages by decreasing protein tyrosine phosphatase receptor type O expression in human hepatocellular carcinoma. J Immunother Cancer. 2020;8(1):e000285
44. Lamano JB. et al. Glioblastoma-Derived IL6 Induces Immunosuppressive Peripheral Myeloid Cell PD-L1 and Promotes Tumor Growth. Clin Cancer Res. 2019;25(12):3643-57
45. Malig M. et al. Ultra-deep Coverage Single-molecule R-loop Footprinting Reveals Principles of R-loop Formation. J Mol Biol. 2020;432(7):2271-88
46. Erickson AM. et al. Identification of a variant antioxidant response element in the promoter of the human glutamate-cysteine ligase modifier subunit gene. Revision of the ARE consensus sequence. J Biol Chem. 2002;277(34):30730-7
47. Reichard JF, Motz GT, Puga A. Heme oxygenase-1 induction by NRF2 requires inactivation of the transcriptional repressor BACH1. Nucleic Acids Res. 2007;35(21):7074-86
48. Li J. et al. KEAP1 promotes anti-tumor immunity by inhibiting PD-L1 expression in NSCLC. Cell Death Dis. 2024;15(2):175
49. Seker-Polat F. et al. Druggable genome CRISPR screening identifies the KEAP1/NRF2 axis as a mediator of PD-L1 expression. Commun Biol. 2025;8(1):1610
50. Zavitsanou AM. et al. KEAP1 mutation in lung adenocarcinoma promotes immune evasion and immunotherapy resistance. Cell Rep. 2023;42(11):113295
51. Marinelli D. et al. KEAP1-driven co-mutations in lung adenocarcinoma unresponsive to immunotherapy despite high tumor mutational burden. Ann Oncol. 2020;31(12):1746-54
52. Scalera S. et al. KEAP1 and TP53 Frame Genomic, Evolutionary, and Immunologic Subtypes of Lung Adenocarcinoma With Different Sensitivity to Immunotherapy. J Thorac Oncol. 2021;16(12):2065-77
53. Mitsuishi Y. et al. Nrf2 redirects glucose and glutamine into anabolic pathways in metabolic reprogramming. Cancer Cell. 2012;22(1):66-79
54. Romero R. et al. Keap1 loss promotes Kras-driven lung cancer and results in dependence on glutaminolysis. Nat Med. 2017;23(11):1362-8
55. DeNicola GM. et al. NRF2 regulates serine biosynthesis in non-small cell lung cancer. Nat Genet. 2015;47(12):1475-81
56. Hanahan D, Weinberg RA. Hallmarks of cancer: the next generation. Cell. 2011;144(5):646-74
57. Saleh MM. et al. Comprehensive Analysis of TP53 and KEAP1 Mutations and Their Impact on Survival in Localized- and Advanced-Stage NSCLC. J Thorac Oncol. 2022;17(1):76-88
58. Zierhut C. et al. The Cytoplasmic DNA Sensor cGAS Promotes Mitotic Cell Death. Cell. 2019;178(2):302-15.e23
59. Jurga M. et al. USP11 controls R-loops by regulating senataxin proteostasis. Nat Commun. 2021;12(1):5156
60. Joung J. et al. Genome-scale CRISPR-Cas9 knockout and transcriptional activation screening. Nat Protoc. 2017;12(4):828-63
61. Sanson KR. et al. Optimized libraries for CRISPR-Cas9 genetic screens with multiple modalities. Nat Commun. 2018;9(1):5416
62. Li W. et al. MAGeCK enables robust identification of essential genes from genome-scale CRISPR/Cas9 knockout screens. Genome Biol. 2014;15(12):554
63. Bubeck D. et al. PCNA directs type 2 RNase H activity on DNA replication and repair substrates. Nucleic Acids Res. 2011;39(9):3652-66
64. Bolger AM, Lohse M, Usadel B. Trimmomatic: a flexible trimmer for Illumina sequence data. Bioinformatics. 2014;30(15):2114-20
65. Dobin A. et al. STAR: ultrafast universal RNA-seq aligner. Bioinformatics. 2013;29(1):15-21
66. Patro R. et al. Salmon provides fast and bias-aware quantification of transcript expression. Nat Methods. 2017;14(4):417-9
67. Love MI, Huber W, Anders S. Moderated estimation of fold change and dispersion for RNA-seq data with DESeq2. Genome Biol. 2014;15(12):550
68. Rizzo M. et al. Radiotherapy plus pembrolizumab for advanced urothelial carcinoma: results from the ARON-2 real-world study. Sci Rep. 2024;14(1):19802
69. Ewels PA. et al. The nf-core framework for community-curated bioinformatics pipelines. Nat Biotechnol. 2020;38(3):276-8
70. Zhou G. et al. NetworkAnalyst 3.0: a visual analytics platform for comprehensive gene expression profiling and meta-analysis. Nucleic Acids Res. 2019;47(W1):W234-W241
71. Ashburner M. et al. Gene ontology: tool for the unification of biology. The Gene Ontology Consortium. Nat Genet. 2000;25(1):25-9
72. Subramanian A. et al. Gene set enrichment analysis: a knowledge-based approach for interpreting genome-wide expression profiles. Proc Natl Acad Sci U S A. 2005;102(43):15545-50
Author contact
Corresponding authors: Email: lim.kah.suancom.sg (K.S.L); teh.bin.teancom.sg (B.T.T.).