Impact Factor ISSN: 1449-2288




Int J Biol Sci 2027; 23(2):682-704. doi:10.7150/ijbs.137212 This issue Cite
Research Paper
TRAF6-SSRP1 axis drives glycolytic reprogramming and colorectal cancer progression through H3K18 lactylation
Penghang Lin1,2,3*, Jingjing Wei5,6*, Chunlin Lin1,2,3*, Songyi Liu1,2,3,4, Yuyao Jiang4, Ruofan He1,2,3,4, Fangqiu Ruan1,2,3,4, Jianxin Ye1,2,3,4  , Guangwei Zhu1,2,3,4
1. Department of Gastrointestinal Surgery II, The First Affiliated Hospital of Fujian Medical University, Fuzhou 350005, China.
2. Department of Gastrointestinal Surgery, National Regional Medical Center, Binhai Campus of the First Affiliated Hospital of Fujian Medical University, Fuzhou 350212, China.
3. Fujian Key Laboratory of Precision Medicine for Cancer, The First Affiliated Hospital of Fujian Medical University, Fuzhou 350005, China.
4. Key Laboratory of Gastrointestinal Cancer (Fujian Medical University), Ministry of Education, Fuzhou 350122, China.
5. Department of Endoscopy, The First Affiliated Hospital of Fujian Medical University, Fuzhou, 350005, China.
6. Endoscopy Center, National Regional Medical Center, Binhai Campus of the First Affiliated Hospital, Fujian Medical University, Fuzhou, 350212, China.
*These authors contributed equally to this study.
Received 2026-5-4; Accepted 2026-9-23; Published 2027-1-1
Abstract
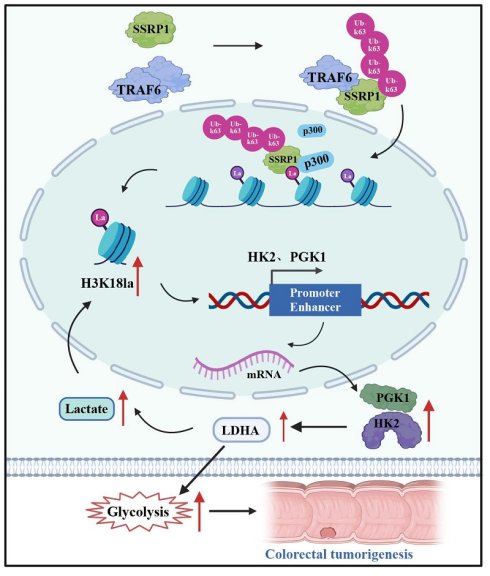
Histone lactylation, particularly H3K18 lactylation (H3K18la), has emerged as a key epigenetic modification linking cellular metabolism to gene regulation in cancer. However, the upstream mechanisms governing H3K18la deposition and its role in glycolytic reprogramming in colorectal cancer (CRC) remain poorly understood. Here, we show that the E3 ubiquitin ligase TRAF6 drives a metabolic-epigenetic positive feedback loop in CRC by catalyzing K63-linked polyubiquitination and activation of the chromatin remodeling factor SSRP1. Activated SSRP1 recruits the acetyltransferase p300 to deposit H3K18la at promoter and enhancer regions of the glycolytic genes HK2 and PGK1, thereby enhancing their transcription, elevating glycolytic flux, and promoting CRC cell proliferation. Genetic or pharmacological disruption of the TRAF6-SSRP1 axis reduced H3K18la levels, suppressed glycolysis, and restrained tumor growth both in vitro and in xenograft models. Clinically, elevated TRAF6 expression and high H3K18la levels were associated with poor prognosis in CRC patients. These findings define a TRAF6-SSRP1-H3K18la-HK2/PGK1 regulatory circuit that couples ubiquitin signaling to histone lactylation-dependent glycolytic reprogramming, highlighting potential therapeutic targets at the metabolic-epigenetic interface in CRC.
Introduction
Colorectal cancer (CRC) is the third most common malignancy and the second leading cause of cancer-related death worldwide, with its incidence and mortality continuing to increase[1, 2]. Metabolic reprogramming, characterized by enhanced aerobic glycolysis and excessive lactate accumulation, represents a central molecular feature of CRC. Beyond supplying energy and biosynthetic substrates, this metabolic state profoundly influences tumor progression and therapeutic responses[3]. Recent studies have shown that lactate regulates gene transcription through the induction of histone lactylation. Among these modifications, histone H3 lysine 18 lactylation (H3K18la) is highly enriched at active promoter and enhancer regions and has been implicated in tumor growth, therapy resistance, and immune regulation across multiple cancer types[4, 5]. In CRC, tumor-derived lactate-H3K18la signaling was reported to upregulate the autophagy-enhancing protein RUBCNL, thereby driving resistance to bevacizumab and promoting malignant phenotypes through modulation of antioxidant and stemness-related gene programs[6]. However, current studies have largely focused on autophagy, antioxidant, or stemness-associated targets, and systematic investigation of the epigenetic mechanisms by which H3K18la directly regulates glycolytic reprogramming through rate-limiting glycolytic enzymes in CRC remains lacking. In addition, mechanisms governing the regulation of H3K18la abundance in this context have not been elucidated[7, 8].
Structure-specific recognition protein 1 (SSRP1) is a core subunit of the facilitates chromatin transcription (FACT) complex and plays essential roles in chromatin remodeling, transcriptional regulation, DNA damage repair, and cell cycle control[9, 10]. SSRP1 is overexpressed in multiple tumor types and is associated with therapeutic resistance and poor prognosis. In CRC, elevated SSRP1 expression was shown to promote cell proliferation, migration, and epithelial-mesenchymal transition, whereas its depletion markedly suppressed tumor progression[11, 12]. However, it remains unknown whether SSRP1 is activated through E3 ubiquitin ligase-mediated polyubiquitination to recruit the histone lactyltransferase p300, thereby promoting H3K18 lactylation deposition and transcriptional activation of downstream target genes. Hexokinase 2 (HK2) and phosphoglycerate kinase 1 (PGK1) are rate-limiting enzymes in glycolysis and are frequently overexpressed in CRC, where their expression is closely associated with tumor growth, metastasis, and poor clinical outcomes. Inhibition of HK2 or PGK1 was reported to significantly impair glycolytic capacity and tumorigenic potential of CRC cells[13, 14]. Although HK2-driven glycolysis has been implicated in liver macrophage (Kupffer cell) activation and inflammatory responses in fatty liver disease models[15], the epigenetic mechanisms underlying glycolytic reprogramming in CRC, particularly those mediated by the SSRP1-H3K18la axis in directly regulating HK2 and PGK1 transcription, have not been investigated.
Tumor necrosis factor receptor associated factor 6 (TRAF6) is a key E3 ubiquitin ligase and signaling adaptor[16]. Multiple studies have demonstrated that TRAF6 is aberrantly expressed in various malignancies and regulates cell proliferation, survival, and invasion or metastasis through signaling pathways including NF-κB, AP-1 and AKT[17]. Notably, a recent study reported that tumor-derived lactate induced H3K18la in macrophages, leading to activation of TRAF6 signaling and promotion of CRC progression, thereby linking TRAF6 to lactate-driven histone lactylation pathways[18]. However, this study primarily focused on tumor-associated macrophages. Whether TRAF6 within tumor cells contributes to glycolytic reprogramming and histone lactylation, particularly through direct epigenetic regulation of glycolytic rate-limiting enzymes, remains largely unexplored[19]. Furthermore, a core feature that distinguishes TRAF6 from most E3 ubiquitin ligases is its predominant catalysis of K63-linked polyubiquitination. Unlike K48 chains, which mediate proteasomal degradation, K63 chains do not alter substrate abundance but instead transmit non-degradative signals by remodeling substrate conformation, recruiting downstream effectors, and altering subcellular localization[20], endowing TRAF6 with the potential to directly modulate the functional state of chromatin-binding proteins. At the metabolic level, TRAF6 has been reported to ubiquitinate key glycolytic molecules and promote tumor metabolic reprogramming. Representative studies include TRAF6-mediated ubiquitination of PKM2 promoting glycolysis and chemoresistance in triple-negative breast cancer[21], TRAF6-driven glycolytic reprogramming facilitating tumor progression in lung cancer[22], and TRAF6 regulation of HIF-1α stability influencing tumor metabolic adaptation[23]. At the epigenetic level, TRAF6 has also been found to regulate the stability and activity of histone-modifying enzymes (e.g., EZH2) and chromatin remodeling factors[24, 25]. However, these two lines of evidence have thus far remained independent, and no study has directly linked the non-degradative ubiquitination activity of TRAF6 to histone lactylation, a metabolic-epigenetic crosstalk modification. Mounting evidence indicates that histone lactylation, particularly H3K18la, promotes chemoresistance and metastasis in CRC, with p300/CBP serving as the principal lactyl-transferase catalyzing this modification[6, 26]. TRAF6 primarily catalyzes K63-linked polyubiquitination, a modification that does not trigger protein degradation but instead transmits non-degradative signals by remodeling substrate conformation and recruiting effector proteins[27].
Based on this, we propose that TRAF6 activates SSRP1 through K63-linked polyubiquitination, enabling it to function as a reader protein for H3K18la and enhance H3K18la levels, thereby selectively promoting the transcription of HK2 and PGK1 to drive glycolytic reprogramming and malignant progression in CRC. In this study, we systematically elucidate the role and molecular mechanisms of the TRAF6-SSRP1-H3K18la-HK2/PGK1 axis in CRC, revealing that the TRAF6-SSRP1 axis serves as a critical hub linking histone lactylation modifications to glycolytic metabolism. Unlike previous studies that attributed H3K18la in CRC to passive lactate accumulation and RUBCNL-mediated bevacizumab resistance, our findings demonstrate that TRAF6 is the first E3 ubiquitin ligase shown to actively drive histone lactylation, establishing a positive feedback loop wherein glycolysis-derived lactate enhances H3K18la to further amplify glycolytic enzyme transcription. These findings not only deepen our understanding of CRC metabolic reprogramming but also provide new theoretical foundations and potential therapeutic targets for CRC intervention strategies.
Materials and Methods
Cell culture and transfection
The human CRC cell lines RKO and DLD1 were obtained from the Cell Bank of the Chinese Academy of Sciences (Shanghai, China). Cells were maintained in RPMI 1640 medium (Gibco) supplemented with 10% fetal bovine serum (FBS), 100 U/mL penicillin, and 100 μg/mL streptomycin in a humidified incubator at 37 °C with 5% CO₂. HEK293T cells were kindly provided by the Key Laboratory of Gastrointestinal Cancer of the Ministry of Education, Fujian Medical University, and cultured under the same conditions. All gene-specific primers and cloning vectors were synthesized by Shangya Biotechnology (China). Small interfering RNAs (siRNAs) targeting TRAF6, SSRP1, HK2, and PGK1 were purchased from GenePharma (China). TRAF6 knockout was achieved using the CRISPR-Cas9 system, and stable TRAF6-deficient cell lines were established according to the manufacturer's instructions. DNA transfection was performed in 6-well plates or 10-cm dishes using Lipofectamine™ 3000 (Invitrogen, Thermo Fisher Scientific) following the manufacturer's protocol.
Reagents and antibodies
Antibodies against HA tag (#5017), Myc tag (#2276), Flag tag (#14793), β-Actin (#4967), TRAF6 (#8028), SSRP1 (#13421), HK2 (#2867), and PGK1 (#68540) were purchased from Cell Signaling Technology (CST). Pan-Kla (PTM-1401RM), H3K18la (PTM-1427RM), H3K14la (PTM-1414RM), H4K12la (PTM-1411RM), and H4K8la (PTM-1415RM) antibodies were obtained from PTM Biolabs (Jingjie, China), and antibodies against H3 (ab1791) and Ki67 (ab15580) were obtained from Abcam. 2-deoxy-D-glucose (2-DG, HY-13966), oxamate (HY-W013032A), and sodium dichloroacetate (DCA, HY-Y0445A) were purchased from MedChemExpress. Lactate assay kit (E-BC-K044-M) and extracellular acidification rate (ECAR) fluorometric assay kit (E-BC-F069) were obtained from Elabscience. ATP assay reagents were purchased from Beyotime Biotechnology. Protease inhibitor cocktail (SJ-MK0001, Sparkjade) and phosphatase inhibitor cocktail (SJ-MK0002, Sparkjade) were purchased from Sparkjade. The EDU-555 cell proliferation assay kit and other reagents, unless otherwise specified, were obtained from Sigma-Aldrich and Thermo Fisher Scientific. Unless otherwise indicated, antibodies were used at dilutions recommended by the manufacturers.
ATP and lactate measurements
Intracellular ATP levels and lactate production were measured to evaluate energy metabolism in TRAF6-overexpressing CRC cells using an ATP assay kit (Beyotime, S0026) and an L-lactate colorimetric assay kit (Elabscience, E-BC-K044-M), respectively. Briefly, treated cells were collected and lysed on ice with lysis buffer supplied in the ATP assay kit. Lysates were centrifuged at 12,000 × g for 5 min at 4 °C, and the supernatants were used for ATP quantification and protein determination by BCA assay. Samples were mixed with the ATP working solution, and luminescence was measured using a chemiluminescence reader. ATP concentrations were calculated from a standard curve and normalized to total protein content. For lactate measurement, cell homogenate supernatants were added to 96-well plates and incubated with enzyme working solution and chromogenic reagent according to the manufacturer's instructions. After incubation at 37 °C for 10 min, stop solution was added, and absorbance at 530 nm was measured using a microplate reader. Lactate concentrations were calculated from a lactate standard curve and normalized to protein content.
RNA extraction and quantitative real-time PCR (RT-qPCR)
Total RNA was extracted from cells using TRIzol reagent (Life Technologies) according to the manufacturer's protocol. cDNA was synthesized from 1 µg of total RNA using the Evo M-MLV RT Kit for qPCR (AG11707, Accurate Biotechnology). Quantitative real-time PCR was performed using the SYBR Green Premix Pro Taq HS qPCR Kit (AG11701, Accurate Biotechnology) on a real-time PCR system to measure mRNA expression of target genes. β-Actin (ACTB) was used as an internal control, and relative gene expression was calculated using the 2⁻ΔΔCt method.
Immunohistochemistry (IHC)
Immunohistochemical staining was performed using the Elivision™ Plus Polymer HRP (Mouse/Rabbit) IHC kit (MXB Biotechnologies) according to the manufacturer's instructions. Consecutive paraffin-embedded tissue sections were incubated with primary antibodies diluted 1:500. After chromogenic development, sections were dehydrated, mounted, and imaged under a light microscope. Protein expression levels were quantified using Image-Pro Plus 6.0 software (Media Cybernetics). For each group, three sections were randomly selected, and five fields per section were analyzed. The integrated optical density (IOD) and area of each field were measured, and the mean optical density (MOD = IOD/area) was used as a semi-quantitative index of protein expression.
Confocal immunofluorescence
For confocal microscopy, RKO, DLD1, and HEK293T cells were washed with PBS and fixed in 4% paraformaldehyde at room temperature for 15 min. Cells were then permeabilized and blocked with buffer containing 5% bovine serum albumin (BSA) and 0.2% Triton X-100, followed by incubation with the indicated primary antibodies at 4 °C overnight. After washing with PBS, cells were incubated with FITC-conjugated secondary antibodies (Life Technologies) for 1 h at room temperature in the dark. Nuclei were counterstained with 4',6-diamidino-2-phenylindole (DAPI, ab285390) for 5 min. Images were acquired using a TCS SP8 laser scanning confocal microscope.
ECAR assay
Glycolysis-associated extracellular acidification was assessed using a fluorometric ECAR assay kit (E-BC-F069, Elabscience) in control and TRAF6-overexpressing CRC cells. Briefly, treated cells were harvested, counted, and approximately 2.5 × 10⁵ cells were centrifuged at 500 × g for 5 min to remove the supernatant. Pellets were resuspended in 200 µL of probe working solution prewarmed to 37 °C and gently pipetted to obtain a single-cell suspension. Then, 150 µL of the cell suspension was added to each well of a black, clear-bottom 96-well plate. Blank wells contained an equal volume of probe working solution without cells. Plates were incubated at 37 °C, and fluorescence intensity was recorded every 2-3 min for approximately 100-120 min using a fluorescence microplate reader at an excitation wavelength of 490 nm and an emission wavelength of 535 nm. Fluorescence-time curves were plotted, and ECAR was calculated from the rate of fluorescence decline during the linear phase.
Immunoprecipitation (IP)
All protein extraction procedures were performed on ice. Cells were lysed for 30 min in IP lysis buffer (Thermo Fisher Scientific) supplemented with protease inhibitor cocktail (Beyotime). Lysates were centrifuged at 12,000 × g for 10 min at 4 °C, and the supernatants were collected. Total protein concentration was determined using a BCA protein assay kit (Thermo Fisher Scientific), and equal amounts of protein were used for subsequent immunoprecipitation.
For co-IP assays, lysates from cells transiently transfected with Flag-TRAF6 and Myc-SSRP1 were incubated with control IgG, anti-DYKDDDDK (Flag) affinity gel, or anti-Myc affinity gel (Pierce, Thermo Fisher Scientific) overnight at 4 °C with gentle rotation. Beads were then washed three times with IP lysis buffer, resuspended in protein loading buffer, boiled to denature bound proteins, and the immunocomplexes were subjected to immunoblotting analysis.
For polyubiquitination assays, lysates from cells transiently co-transfected with Flag-TRAF6, Myc-SSRP1, and HA-Ub were incubated with control IgG or anti-Myc affinity gel (Pierce, Thermo Fisher Scientific) overnight at 4 °C. Beads were washed three times with IP lysis buffer and boiled in protein loading buffer. Ubiquitylated proteins were detected by immunoblotting with anti-HA antibody, as described previously.
Colony formation assay
Cells were seeded into 6-well plates at a density of 800 cells per well and cultured for 2 weeks at 37 °C in a humidified incubator with 5% CO₂. Colonies were fixed with methanol and stained with crystal violet for 10 min. Colonies containing 50 or more cells were counted.
Omics analysis
RNA-seq and ChIP-seq were performed by Wuhan Kangce Biotechnology Co., Ltd., and metabolomics profiling was conducted by Shanghai Lingen Biotechnology Co., Ltd. Raw data have been deposited in the GSA database (RNA-seq: OMIX019519; ChIP-seq: HRA020327; Metabolomics: OMIX019539). For RNA-seq, libraries were sequenced on the Illumina NovaSeq platform with PE-150 configuration, generating approximately 10 Gb per sample across 6 biological replicates. Clean reads were aligned to the human reference genome GRCh38 (release 107) using HISAT2, achieving mapping rates >96% and Q30 scores >97%. Transcript quantification was performed using StringTie, and differential expression analysis was conducted with edgeR using thresholds of |log2FC|>1 and P-value<0.05. For ChIP-seq, sequencing depth ranged from 35 to 53 million reads per sample. Reads were aligned to the hg38 reference genome using Bowtie2, with unique mapping rates of 93-94%. Peak calling was performed using MACS2 (FDR<0.05) with input chromatin as background control. Pearson correlation coefficients between biological replicates exceeded 0.85. Metabolomics analysis utilized LC-MS (Thermo Q Exactive HF-X coupled with Vanquish UHPLC and a Hypersil Gold C18 column) in positive and negative ion modes, identifying 765 metabolites (446 in positive mode, 319 in negative mode). Data processing was conducted using Compound Discoverer 3.1, retaining metabolites with CV<30% in QC samples. Differential metabolites were identified using OPLS-DA with thresholds of |log2FC|≥1, VIP≥1, and P-value≤0.05.
Animal experiments
All animal experiments were conducted in accordance with the National Institutes of Health Guide for the Care and Use of Laboratory Animals, performed at the Laboratory Animal Center of Fujian Medical University, and approved by the Institutional Animal Care and Use Committee. Female BALB/c nude mice aged 4-6 weeks were acclimated for one week and then randomly assigned to experimental groups using a random number table. For subcutaneous xenograft models with TRAF6 overexpression, approximately 5 × 10⁶ RKO cells stably overexpressing TRAF6 or empty vector control cells were suspended in PBS and subcutaneously injected into the right axilla of nude mice (n=4-5 per group). In lactate-induced models, designated groups received daily intraperitoneal injections of sodium lactate (1 g/kg) starting 7 days before tumor cell inoculation and continuing until experimental endpoints, while control groups received equal volumes of PBS. Rescue experiments were performed using RKO cells co-transfected with sh-SSRP1 and TRAF6 or corresponding controls, with identical cell numbers and injection methods. Beginning when tumors became palpable, tumor dimensions were measured every 3 days by researchers blinded to group assignments using calipers, and tumor volumes were calculated using the formula: volume = (length×width2) × π/6. Mice were euthanized approximately 3 weeks post-injection or when tumors reached predetermined endpoints. Tumors were immediately excised, photographed, and weighed. Tumor tissues were divided for lactate quantification and Western blot analysis, while remaining portions were fixed in 4% paraformaldehyde, paraffin-embedded, sectioned, and processed for immunohistochemical staining and semi-quantitative analysis. Exclusion criteria included failure of tumor formation, death from non-experimental causes, or tumors exceeding ethical endpoints (>2000 mm³ or ulceration). No animals were excluded in this study.
Statistical analysis
All statistical analyses were performed using GraphPad Prism 10.1.1, and data are presented as mean ± SD. Cell-based experiments were independently repeated at least three times (n≥3), animal experiments included n=4-5 per group, and survival analysis incorporated 167 colorectal cancer samples stratified into high and low expression groups based on median immunohistochemistry scores. Unpaired two-tailed Student's t-tests were used for comparisons between two independent groups, while paired two-tailed t-tests were applied for matched tumor and adjacent normal tissues. Multiple group comparisons were analyzed by one-way or two-way ANOVA followed by post-hoc tests. Survival curves were generated using the Kaplan-Meier method and compared by log-rank test. Correlations were assessed using Pearson's correlation coefficient. Statistical significance is indicated as P < 0.05, P < 0.01, P < 0.001, and ns denotes not significant.
Results
TRAF6 positively correlates with histone lactylation in CRC, and high histone lactylation predicts poor prognosis
To investigate the impact of TRAF6 on glycolysis in CRC, we first performed an exploratory analysis of lactate levels in tumor tissues and matched adjacent normal mucosa from 5 patients with pathologically confirmed CRC. In this cohort, lactate concentrations tended to be higher in tumor tissues than in the corresponding normal tissues. Consistently, lactate levels were significantly elevated in multiple CRC cell lines compared with the normal intestinal epithelial cell line NCM460 (Fig. 1A). These observations suggest that glycolytic activity is enhanced in CRC and prompted us to explore whether TRAF6 promotes lactate production by regulating glycolysis. To elucidate the role of TRAF6 in glycolytic reprogramming, we performed RNA-seq in RKO cells with stable TRAF6 overexpression and untargeted metabolomics in RKO cells with TRAF6 knockdown (Fig. 1B). Untargeted metabolomic profiling showed that silencing TRAF6 reduced multiple glycolysis-related metabolites (Figs. 1C, S1A, and S1B). Gene set enrichment analysis (GSEA) of the transcriptomic data revealed a significant positive association between high TRAF6 expression and the glycolysis pathway (Fig. 1D). Visualization of key glycolytic enzymes across different steps of the pathway further demonstrated that TRAF6 overexpression upregulated the transcription of most glycolytic enzyme genes (Fig. 1E).
TRAF6 positively correlates with histone lactylation in CRC, and high histone lactylation is associated with poor prognosis. A Intracellular lactate levels in CRC tissues versus matched adjacent normal tissues and in multiple CRC cell lines versus the normal intestinal epithelial cell line NCM460, with statistical analysis. B Schematic workflow of RNA sequencing (RNA-seq) in TRAF6-overexpressing CRC cells and untargeted metabolomics in TRAF6-knockdown CRC cells. C Analysis of differentially expressed metabolites between TRAF6-knockdown and control CRC cells based on untargeted metabolomics. Dot size represents the variable importance in projection (VIP) score, and dot color represents the P value. D Gene set enrichment analysis (GSEA) of glycolysis-related genes in RNA-seq data from TRAF6-overexpressing RKO cells. E Visualization of mRNA expression changes in key glycolytic enzymes in the transcriptome of TRAF6-overexpressing cells. F, G Western blot analysis and quantification of Pan-lysine lactylation (Pan-Kla) levels in histone extracts from RKO and DLD1 cells with TRAF6 overexpression. H, I Western blot analysis and quantification of Pan-Kla levels in histone extracts from RKO and DLD1 cells with TRAF6 knockdown. J Immunohistochemical (IHC) staining of TRAF6, Pan-Kla, and Ki67 in clinical CRC specimens on serial sections. K Western blot analysis of Pan-Kla levels in histone extracts from multiple CRC cell lines and NCM460 cells. L Western blot analysis of LDHA and Pan-Kla protein levels in TRAF6-overexpressing RKO cells cultured under high-glucose and hypoxic conditions. M Western blot analysis of Pan-Kla levels in TRAF6-overexpressing RKO cells treated with increasing concentrations of sodium lactate. N Kaplan-Meier overall survival curves of 167 CRC patients stratified into high and low Pan-Kla expression groups based on the median Pan-Kla level determined by immunohistochemistry. MOD, mean optical density; IOD, integrated optical density; NES, normalized enrichment score; GO, Gene Ontology; F-1,6-BP, fructose-1,6-bisphosphate; 1,3-BPG, 1,3-bisphosphoglycerate; PEP, phosphoenolpyruvate; dUMP, deoxyuridine monophosphate; HR, hazard ratio.
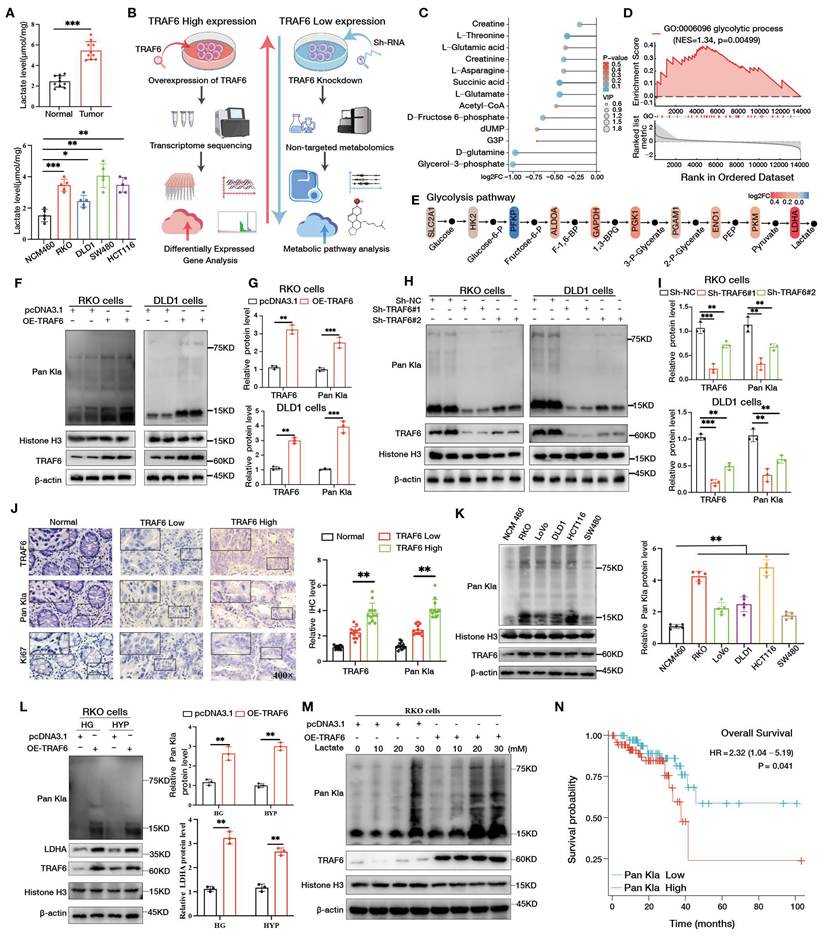
We next examined whether TRAF6 affects histone lactylation. In TRAF6-overexpressing CRC cells, global histone lactylation, detected using a Pan-Kla antibody, was markedly increased (Fig. 1F, G), whereas TRAF6 knockdown led to a pronounced decrease in Pan-Kla levels (Fig. 1H, I). In clinical CRC specimens, serial sections subjected to immunohistochemistry revealed a significant positive correlation between TRAF6 expression and Pan-Kla staining (Fig. 1J). Additionally, protein extraction and Western blotting were performed on 10 pairs of colorectal cancer tumors and matched normal tissues, revealing significantly higher Pan-Kla expression in tumor tissues compared to normal tissues (Fig. S1C). Similarly, Pan-Kla protein levels were substantially elevated in several CRC cell lines compared with NCM460 cells (Fig. 1K). Under high-glucose and hypoxic conditions, TRAF6 overexpression further enhanced LDHA expression and Pan-Kla levels in CRC cells (Fig. 1L, Fig. S1D). Sodium lactate treatment of TRAF6-overexpressing RKO cells (Fig. S1E) and TRAF6-knockdown RKO cells (Fig. S1F) resulted in an additional increase in Pan-Kla compared with their respective untreated controls. In TRAF6-overexpressing RKO cells, stimulation with increasing concentrations of sodium lactate induced a dose-dependent elevation in Pan-Kla protein levels (Fig. 1M). Survival analysis of CRC patients showed that high Pan-Kla expression was significantly associated with poorer overall survival (Fig. 1N) (Table S1), indicating that elevated histone lactylation may serve as a molecular marker of unfavorable prognosis in CRC.
TRAF6 promotes tumor glycolysis and malignant progression of CRC cells by enhancing histone lactylation
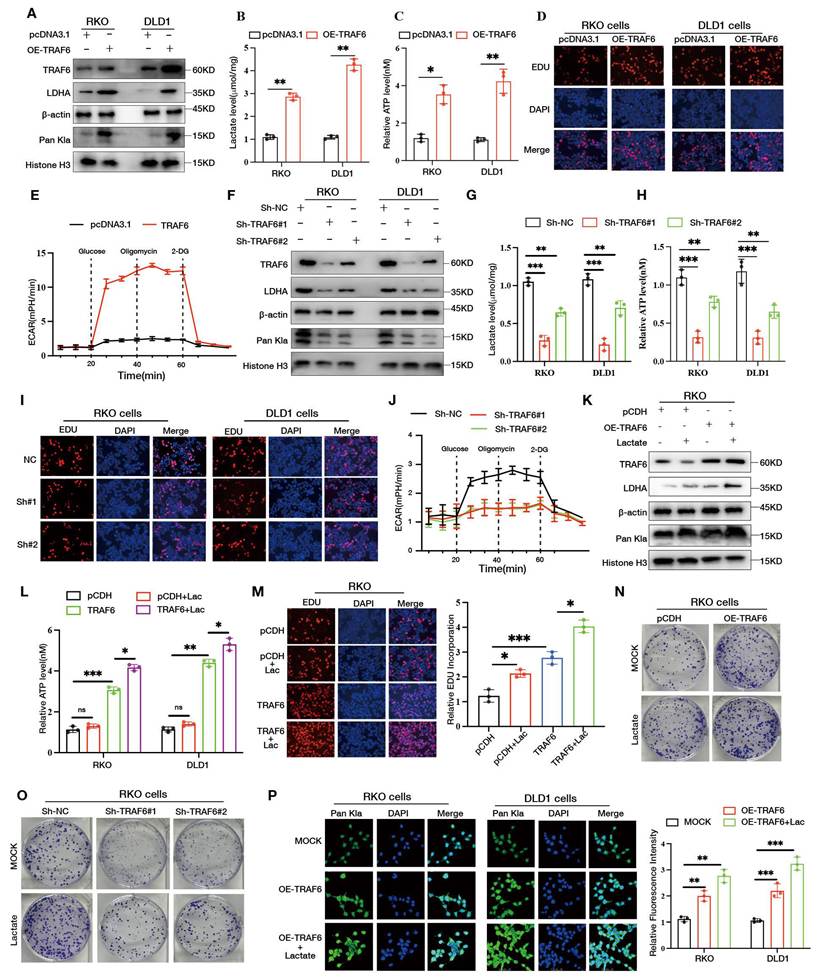
To determine whether TRAF6 drives malignant progression of CRC cells by promoting glycolysis, we first examined glycolysis-related parameters in TRAF6-overexpressing cells. Western blotting showed that TRAF6 overexpression markedly increased the protein levels of the key glycolytic enzyme LDHA and global histone lactylation detected by Pan-Kla (Figs. 2A, S2A). Consistently, intracellular lactate (Fig. 2B) and ATP (Fig. 2C) levels were elevated in TRAF6-overexpressing cells. EdU incorporation assays indicated that TRAF6 overexpression significantly enhanced the proliferative activity of CRC cells (Figs. 2D, S2B). In line with these findings, ECAR analysis revealed that TRAF6 overexpression increased basal glycolysis, maximal glycolytic capacity, and glycolytic reserve (Fig. 2E). Conversely, TRAF6 knockdown in CRC cells led to a clear reduction in LDHA and Pan-Kla protein levels (Figs. 2F, S2C), accompanied by decreased intracellular lactate (Fig. 2G) and ATP (Fig. 2H) contents. EdU assays showed that cell proliferation was attenuated upon TRAF6 silencing (Figs. 2I, S2D), and ECAR measurements indicated an overall reduction in glycolytic activity (Fig. 2J). Furthermore, treatment of TRAF6-overexpressing RKO cells with exogenous sodium lactate further increased LDHA and Pan-Kla levels (Figs. 2K, S2E), elevated intracellular ATP (Fig. 2L), and augmented cell proliferation and clonogenic growth (Figs. 2M, 2N, S2F). In line with this, stable knockdown of TRAF6 markedly impaired the colony-forming and proliferative capacities of RKO cells (Figs. 2O, S2G). Confocal immunofluorescence analysis showed that, under sodium lactate stimulation, nuclear Pan-Kla signals were further enhanced in TRAF6-overexpressing cells, suggesting a cooperative effect between TRAF6 and lactate accumulation in promoting histone lactylation (Fig. 2P).
TRAF6 promotes glycolysis in CRC cells by enhancing histone lactylation. A Western blot analysis of LDHA and Pan-Kla protein levels in TRAF6-overexpressing CRC cells. B, C Measurement of intracellular lactate (B) and adenosine triphosphate (ATP) levels (C) levels in TRAF6-overexpressing cells. D 5-ethynyl-2'-deoxyuridine (EdU) assay assay assessing the proliferative activity of TRAF6-overexpressing cells. E Extracellular acidification rate (ECAR) analysis in TRAF6-overexpressing cells, with glucose, oligomycin and 2-deoxy-D-glucose (2-DG) added at 20, 40 and 60 min, respectively. F Western blot analysis of LDHA and Pan-Kla protein levels in TRAF6-knockdown CRC cells. G, H Measurement of intracellular lactate (G) and ATP (H) levels in TRAF6-knockdown cells. I EdU assay assessing the proliferative activity of TRAF6-knockdown cells. J ECAR analysis in TRAF6-knockdown cells, with glucose, oligomycin and 2-DG added at 20, 40 and 60 min, respectively. K Western blot analysis of LDHA and Pan-Kla protein levels in TRAF6-overexpressing cells treated with sodium lactate. L Measurement of intracellular ATP levels in TRAF6-overexpressing cells after sodium lactate treatment. M EdU assay in TRAF6-overexpressing cells treated with sodium lactate. N Colony formation assays evaluating the proliferative capacity of TRAF6-overexpressing cells treated with sodium lactate. O Colony formation assays in TRAF6-knockdown cells treated with sodium lactate. P Immunofluorescence analysis of Pan-Kla expression and localization in TRAF6-overexpressing cells treated with sodium lactate.
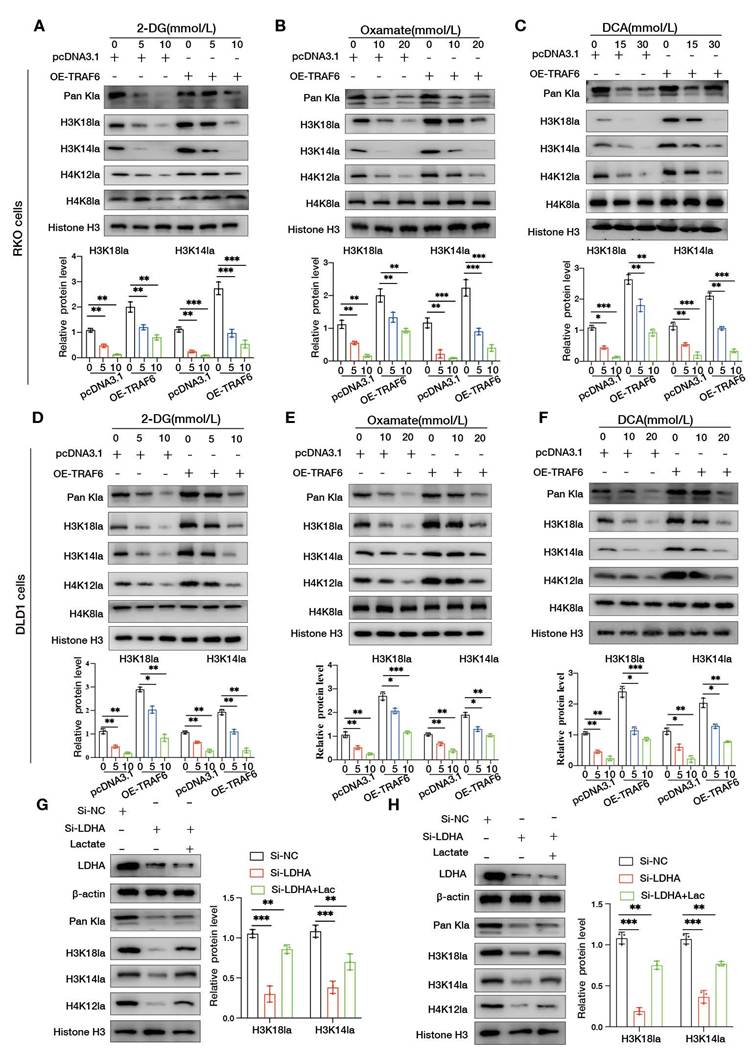
To further clarify how glycolysis influences TRAF6-driven histone lactylation, TRAF6-overexpressing CRC cells were treated with increasing concentrations of the glycolytic inhibitors 2-DG, oxamate, and DCA. Pan-Kla levels declined in a dose-dependent manner, and the specific histone lactylation marks H3K18la, H3K14la, and H4K12la were concomitantly reduced, whereas H4K8la remained largely unchanged (Fig. 3A-F). Moreover, in RKO and DLD1 cells with LDHA knockdown, supplementation with exogenous sodium lactate partially restored the levels of Pan-Kla, H3K18la, H3K14la, and H4K12la (Fig. 3G, H). These data support an important role of the lactate/glycolysis axis in regulating TRAF6-mediated histone lactylation.
Glycolytic inhibition attenuates TRAF6-mediated histone lactylation. A-C TRAF6-overexpressing RKO cells were treated with increasing concentrations of 2-DG, oxamate or sodium dichloroacetate (DCA) for 24 h, and the indicated glycolytic and histone lactylation-related proteins were examined by Western blotting and quantified. D-F TRAF6-overexpressing DLD1 cells were similarly treated with graded doses of 2-DG, oxamate or DCA for 24 h, followed by Western blotting and quantitative analysis of the indicated proteins. G, H RKO and DLD1 cells with LDHA knockdown were treated with sodium lactate for 24 h, and the levels of histone lactylation and related proteins were assessed by Western blotting and quantified.
TRAF6 directly interacts with SSRP1 and promotes its K63-linked polyubiquitination
To explore how TRAF6 regulates histone lactylation to exert its pro-tumorigenic effects, we first integrated multiple mass spectrometry datasets to identify candidate TRAF6-interacting proteins. Based on GST-TRAF6 enrichment abundance ranking, the top 3 candidate proteins were ILF3, TOP2A, and SSRP1. Specifically, this screen integrated two complementary mass spectrometry datasets: one set performed pull-down assays using purified GST-TRAF6 protein with CRC nuclear proteins to capture direct TRAF6-binding proteins; the other set performed immunoprecipitation on CRC total cell lysates using H3K18la, H3K14la, and H4K12la antibodies to capture lactylated histone-binding proteins (Fig. 4A).
TRAF6 directly interacts with SSRP1 and activates it via K63-linked polyubiquitination. A Schematic workflow of mass spectrometry analyses using immunoprecipitation (IP) of purified TRAF6 with nuclear proteins and pull-down of total cell lysates with histone H3 lysine 18 lactylation (H3K18la), histone H3 lysine 14 lactylation (H3K14la) or histone H4 lysine 12 lactylation (H4K12la) affinity beads. B Identification of SSRP1 peptides in the mass spectrometry results. C Co-immunoprecipitation (Co-IP) of Flag-TRAF6 and Myc-SSRP1 using anti-Flag beads in RKO and HEK293T cells. D Co-IP of Flag-TRAF6 and Myc-SSRP1 using anti-Myc beads in RKO and HEK293T cells. E IP with anti-Flag beads in RKO and DLD1 cells transfected with Flag-TRAF6 to detect interactions between exogenous TRAF6 and endogenous SSRP1. F IP with anti-Myc beads in RKO and DLD1 cells transfected with Myc-SSRP1 to detect interactions between exogenous SSRP1 and endogenous TRAF6. G Endogenous co-IP in RKO and DLD1 cells using anti-TRAF6 or anti-SSRP1 antibodies to examine the interaction between endogenous TRAF6 and endogenous SSRP1. H Glutathione S-transferase (GST) pull-down assays detecting the direct interaction between recombinant GST-TRAF6 and SSRP1. I Confocal immunofluorescence analysis of the subcellular localization and colocalization of TRAF6 and SSRP1 in RKO, DLD1 and HEK293T cells co-transfected with both proteins. J Schematic representation of TRAF6 truncation constructs based on functional domains. K Co-transfection of TRAF6 truncation mutants with full-length SSRP1 in HEK293T cells followed by co-IP with anti-Flag or anti-Myc beads to map the TRAF6 domain required for interaction with SSRP1. L Ubiquitination assays in RKO and HEK293T cells co-transfected with Flag-TRAF6, Myc-SSRP1 and HA-Ub, with anti-Myc IP and detection of HA-Ub to evaluate SSRP1 polyubiquitination. M Ubiquitination assays in TRAF6-knockdown RKO cells co-transfected with Myc-SSRP1, HA-Ub and increasing amounts of Flag-TRAF6 plasmid, using anti-Myc IP to assess dose-dependent regulation of SSRP1 ubiquitination by TRAF6. N Endogenous ubiquitination assays in TRAF6-knockout CRC cells using IgG control or anti-SSRP1 antibody to examine the effect of TRAF6 loss on endogenous SSRP1 polyubiquitination. O Co-transfection of Flag-TRAF6, Myc-SSRP1 and different chain-type Ub plasmids in HEK293T cells followed by anti-Myc IP to determine the Ub chain linkage on SSRP1 mediated by TRAF6. P Co-transfection of Flag-TRAF6, Myc-SSRP1 and HA-Ub-K63 in RKO cells, with anti-Myc IP to detect K63-linked polyubiquitination of SSRP1. Q Co-transfection of Myc-SSRP1, HA-Ub-K63 and the RING-domain mutant Flag-TRAF6C70A in RKO cells, followed by anti-Myc immunoprecipitation to evaluate the impact of TRAF6C70A on SSRP1 K63-linked polyubiquitination. R Co-transfection of the TRAF6(358-522) fragment, Myc-SSRP1 and HA-Ub-K63 in RKO cells, followed by anti-Myc immunoprecipitation to assess K63-linked polyubiquitination of SSRP1 mediated by the TRAF-C domain of TRAF6. IB, immunoblotting; ZnF, zinc finger domain; CC, coiled-coil domain.
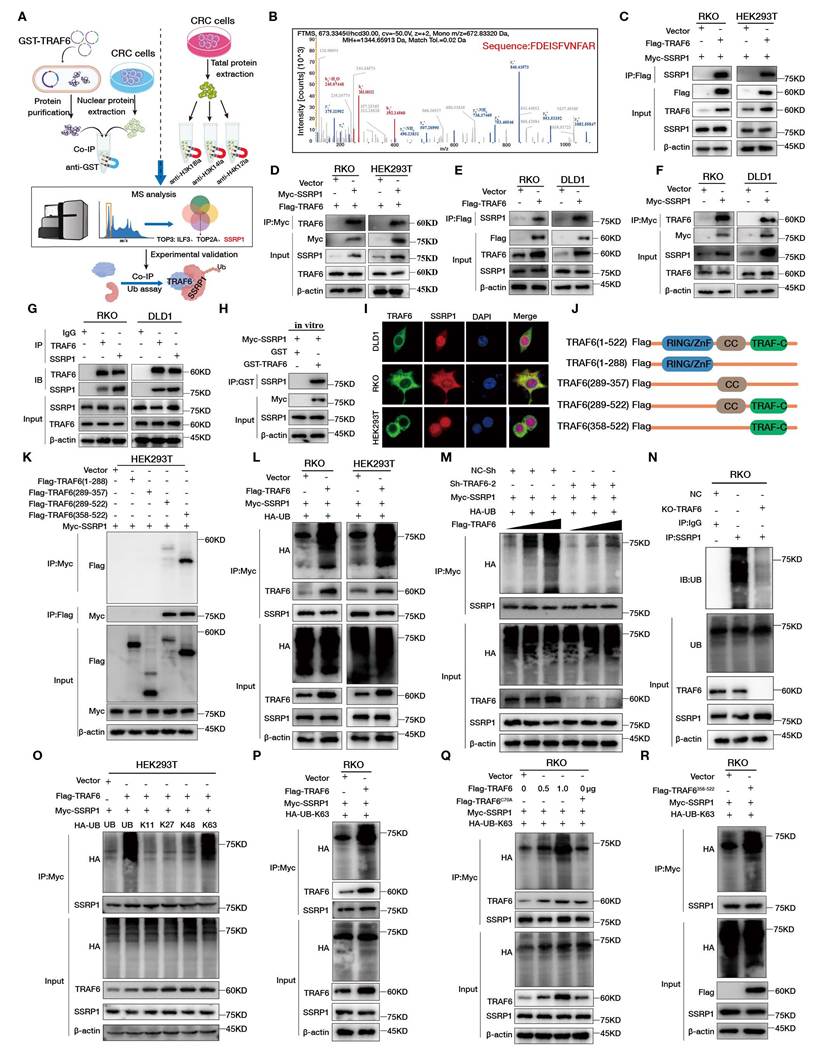
Among candidate proteins appearing in the intersection of both the TRAF6-binding proteome and the lactylated histone-binding proteome, we prioritized those with chromatin-binding or transcriptional regulatory functions for validation. SSRP1, as a core subunit of the FACT complex directly involved in nucleosome disassembly and reassembly, was confirmed by subsequent experiments to specifically bind H3K18la, thereby establishing it as the key candidate molecule (Table S2). Co-IP validation of these candidates showed that only SSRP1 formed a stable complex with TRAF6 (Fig. 4B). To further confirm the interaction between TRAF6 and SSRP1, we co-transfected Flag-TRAF6 and Myc-SSRP1 into RKO and HEK293T cells and performed exogenous co-IP using anti-Flag (Fig. 4C) or anti-Myc (Fig. 4D) affinity beads. In both settings, TRAF6 and SSRP1 robustly co-precipitated with each other. In addition, exogenous Flag-TRAF6 was able to pull down endogenous SSRP1 in RKO and DLD1 cells (Fig. 4E), whereas exogenous Myc-SSRP1 interacted with endogenous TRAF6 (Fig. 4F). Endogenous co-IP using anti-TRAF6 or anti-SSRP1 antibodies in RKO and DLD1 cells further demonstrated a stable interaction between endogenous TRAF6 and endogenous SSRP1 (Fig. 4G). Consistently, GST pull-down assays showed that recombinant GST-TRAF6 directly bound SSRP1, indicating a direct physical interaction between the two proteins (Fig. 4H). Confocal immunofluorescence analysis revealed clear intracellular colocalization of TRAF6 and SSRP1 (Fig. 4I).
To delineate the domains required for TRAF6-SSRP1 interaction, a series of TRAF6 deletion mutants were generated (Fig. 4J). Co-IP experiments using these mutants co-expressed with full-length SSRP1 and precipitated with anti-Flag or anti-Myc beads showed that the TRAF-C domain of TRAF6 was essential for binding to SSRP1 (Fig. 4K). We next examined whether TRAF6 functions as an E3 ligase for SSRP1. Ubiquitination assays in RKO and HEK293T cells demonstrated that TRAF6 overexpression markedly increased the polyubiquitination of SSRP1 (Fig. 4L). Conversely, in RKO cells with TRAF6 knockdown, the polyubiquitination level of SSRP1 was substantially reduced; stepwise reintroduction of TRAF6 plasmid restored SSRP1 ubiquitination in a dose-dependent manner, supporting a direct role of TRAF6 in regulating SSRP1 ubiquitination (Fig. 4M). Endogenous ubiquitination assays using anti-SSRP1 for IP further showed that genetic ablation of TRAF6 significantly diminished polyubiquitination of endogenous SSRP1 (Fig. 4N).
To further define the ubiquitin chain linkage mediated by TRAF6 on SSRP1, HEK293T cells were co-transfected with TRAF6, SSRP1, and ubiquitin constructs engineered to preferentially form K11-, K27-, K48-, or K63-linked chains. After IP of SSRP1, ubiquitination was detected by immunoblotting for the tagged ubiquitin. In the presence of TRAF6, only the K63 ubiquitin construct markedly enhanced polyubiquitination of SSRP1, whereas the K11, K27, and K48 constructs had little effect, indicating that TRAF6 predominantly catalyzes K63-linked polyubiquitination of SSRP1 (Fig. 4O). Consistently, TRAF6 overexpression in RKO cells significantly increased K63-linked polyubiquitination of SSRP1 (Fig. 4P). To further assess the requirement of TRAF6 E3 ligase activity, we generated a C70A mutant, in which Cys70 within the RING domain was substituted by alanine to disrupt catalytic function. Compared with wild-type TRAF6, the C70A mutant showed a markedly reduced ability to promote K63-linked polyubiquitination of SSRP1 (Fig. 4Q). Finally, functional analysis of the 358-522 aa fragment of TRAF6 (corresponding to the TRAF-C domain) revealed that expression of this fragment alone was sufficient to markedly increase K63-linked polyubiquitination of SSRP1 (Fig. 4R), further confirming that the TRAF-C domain is the core region mediating TRAF6-dependent K63-linked polyubiquitination of SSRP1. Given that the E3 ubiquitin ligase catalytic activity of TRAF6 is mediated by its N-terminal RING domain, the C70A mutation disrupting this domain significantly impaired K63-linked modification of SSRP1, whereas the TRAF-C fragment itself lacks catalytic sites. These results indicate that overexpressed TRAF-C primarily functions by enhancing substrate recognition and binding of SSRP1, thereby promoting endogenous full-length TRAF6-mediated modification of SSRP1. Combined with domain truncation interaction experiments, we identify TRAF-C as the critical region for TRAF6 recognition and binding of substrate SSRP1, while the catalytic activity for K63-linked polyubiquitination is attributed to the RING domain.
TRAF6 enhances H3K18la and glycolysis in CRC cells by activating SSRP1
To investigate the role of the TRAF6-SSRP1 axis in regulating glycolysis in CRC cells, we first performed ubiquitination assays in TRAF6-overexpressing cells. TRAF6 overexpression markedly increased the polyubiquitination of SSRP1 and was accompanied by a global elevation of histone lactylation detected by Pan-Kla (Figs. 5A, S3A). Immunofluorescence staining showed that TRAF6 overexpression upregulated LDHA protein levels (Figs. 5B, S3B), and intracellular lactate (Fig. 5C) and ATP (Fig. 5D) contents were also significantly increased.
TRAF6 activates SSRP1 to enhance H3K18la and promote glycolysis in CRC cells. A RKO and DLD1 cells were co-transfected with Flag-TRAF6, Myc-SSRP1 and HA-Ub; SSRP1 ubiquitination was examined by IP with anti-SSRP1 beads and Pan-Kla levels were detected by western blotting. B-D RKO and DLD1 cells co-transfected with Flag-TRAF6 and Myc-SSRP1 were subjected to LDHA immunofluorescence (B), intracellular lactate measurement (C) and ATP measurement (D). E RKO and DLD1 cells were co-transfected with Flag-TRAF6, Si-SSRP1 and HA-Ub-K63, and SSRP1 K63-linked ubiquitination together with Pan-Kla levels were analyzed by IP with anti-SSRP1 beads and western blotting. F-H RKO and DLD1 cells co-transfected with Flag-TRAF6 and Si-SSRP1 were analyzed for LDHA immunofluorescence (F), intracellular lactate (G) and ATP levels (H). I RKO cells co-transfected with Flag-TRAF6, Myc-SSRP1K548R and HA-Ub were subjected to IP with anti-SSRP1 beads to examine SSRP1 ubiquitination and Pan-Kla levels. J AlphaFold 3 predicts a potential protein-protein interaction between the TRAF-C domain of TRAF6 (358-522) and the C-terminal fragment of SSRP1 (480-560). K RKO and DLD1 cells transfected with Flag-TRAF6 were subjected to IP with anti-SSRP1 beads; co-precipitated p300 was detected by western blotting. L RKO cells co-transfected with Flag-TRAF6 and Myc-SSRP1WT or Myc-SSRP1K548R were subjected to IP with anti-Myc beads to examine co-precipitated p300. M RKO cells transfected with Myc-SSRP1 were immunoprecipitated with anti-Myc beads and probed for H3K18la, H3K14la, H4K12la and H4K8la. N RKO and DLD1 cells co-transfected with Flag-TRAF6 and Myc-SSRP1 were subjected to IP with IgG control or anti-SSRP1 beads, followed by immunoblotting for H3K18la. O RKO and DLD1 cells co-transfected with Flag-TRAF6 and Myc-SSRP1 were subjected to IP with IgG control or anti-H3K18la beads, followed by immunoblotting for SSRP1. P RKO cells co-transfected with Flag-TRAF6 and Si-p300#1 or Si-p300#2 were analyzed for p300, TRAF6 and H3K18la protein levels by western blotting, with quantitative analysis shown. Q RKO cells treated with increasing concentrations of sodium lactate were immunoprecipitated with anti-H3K18la or anti-SSRP1 beads to assess the SSRP1-H3K18la interaction. R TRAF6-overexpressing RKO and DLD1 cells were treated with sodium lactate for 24 h and H3K18la expression was examined by immunofluorescence. pTM, predicted template modeling score; PAE, predicted aligned error; WT, wild type; K548R, lysine 548 to arginine mutant.
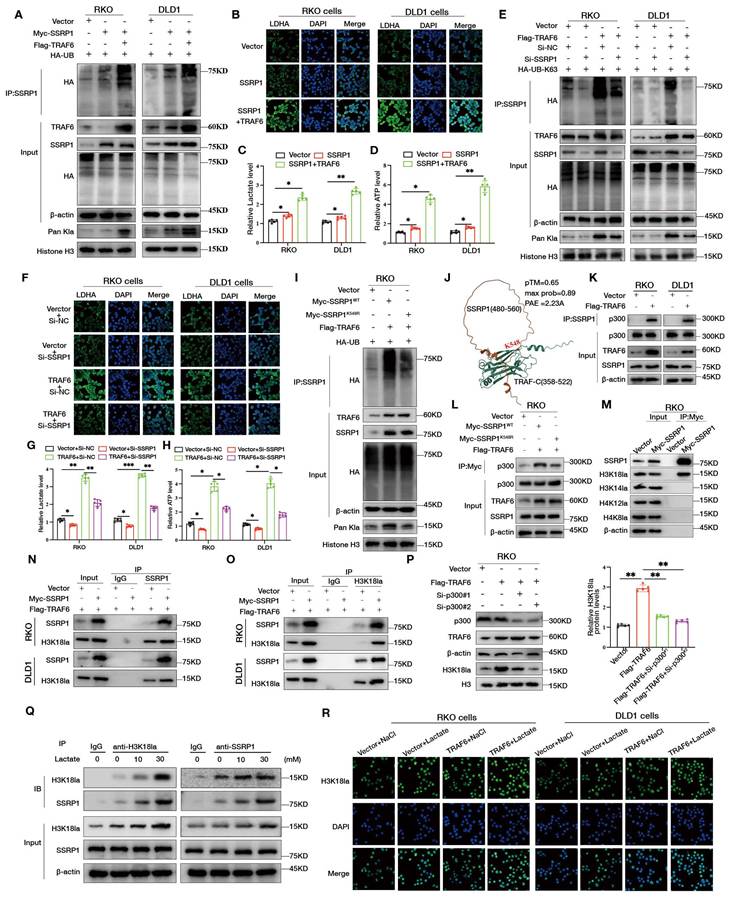
We next assessed the impact of SSRP1 knockdown on TRAF6 function. Silencing SSRP1 substantially attenuated the TRAF6-induced increase in K63-linked polyubiquitination of SSRP1 and concomitantly reduced Pan-Kla levels (Figs. 5E, S3C), suggesting that SSRP1 is a key substrate through which TRAF6 regulates histone lactylation. Consistently, SSRP1 knockdown largely abrogated the upregulation of LDHA by TRAF6 as shown by immunofluorescence (Figs. 5F, S3D), and led to decreased intracellular lactate (Fig. 5G) and ATP levels (Fig. 5H). In RKO cells co-transfected with si-TRAF6, SSRP1, and a K63-biased ubiquitin construct, ubiquitination assays further confirmed that TRAF6 knockdown suppressed K63-linked polyubiquitination of SSRP1 and markedly reduced Pan-Kla levels (Figs. S3E, S3F). To exclude interference from non-covalently bound proteins, cell lysates were denatured with 1% SDS at 95℃ for 10 min to disrupt non-covalent protein complexes, diluted to 0.1% SDS, and subsequently immunoprecipitated with anti-SSRP1 antibody. Western blot analysis still detected HA-tagged ubiquitin signal, confirming that SSRP1 itself is a direct ubiquitination substrate of TRAF6 (Fig. S3G). Under the same TRAF6 knockdown background, immunofluorescence signals of LDHA (Fig. S4A), intracellular lactate (Fig. S4B) and ATP content (Fig. S4C), as well as Pan-Kla fluorescence intensity (Fig. S4D) were all markedly decreased, further supporting the critical role of the TRAF6-SSRP1 axis in maintaining glycolysis and histone lactylation. To further validate the essential role of SSRP1 in the TRAF6-SSRP1 axis, we generated the SSRP1 K548R mutant. Results showed that compared to wild-type SSRP1, the K548R mutant significantly attenuated TRAF6-mediated SSRP1 polyubiquitination and was accompanied by decreased histone Pan-Kla levels (Fig. 5I, Fig. S4E), suggesting that ubiquitination at the K548 site is critical for SSRP1 functional activation. Consistently, the K548R mutant also failed to restore TRAF6-induced elevation of intracellular ATP levels (Fig. S4F). Additionally, AlphaFold 3 structural prediction revealed a potential protein-protein interaction interface between the TRAF-C domain of TRAF6 (358-522 aa) and the C-terminal fragment of SSRP1 (480-560 aa), providing a structural basis for K548 site recognition and modification (Fig. 5J).
To further define the key lactylation site recognized by SSRP1, we first investigated how activated SSRP1 drives histone lactylation. Following transfection of Flag-TRAF6 in RKO and DLD1 cells, immunoprecipitation with anti-SSRP1 magnetic beads revealed that TRAF6 overexpression enhanced the interaction between SSRP1 and the lactyl transferase p300 (Fig. 5K). Further comparison between wild-type and K548R mutant SSRP1 showed that the K548R mutation markedly impaired SSRP1's ability to recruit p300 (Fig. 5L), indicating that ubiquitination at the K548 site is necessary for SSRP1-mediated p300 recruitment. Building on this, to identify the lactylation site preferentially recognized by SSRP1, we examined the interactions between SSRP1 and H3K18la, H3K14la, H4K12la, and H4K8la in HEK293T cells. Co-immunoprecipitation results demonstrated a more pronounced interaction between SSRP1 and H3K18la, while interactions with other lactylation sites were weaker (Fig. 5M). In RKO and DLD1 colorectal cancer cells, endogenous immunoprecipitation using anti-SSRP1 antibody also detected stable interaction between SSRP1 and H3K18la (Fig. 5N); reverse immunoprecipitation with anti-H3K18la antibody yielded consistent results (Fig. 5O). To verify p300's function in this process, we co-transfected Flag-TRAF6 with si-p300#1 or si-p300#2 in RKO cells. Western blot results showed that p300 knockdown significantly attenuated TRAF6-induced H3K18la upregulation, demonstrating that TRAF6-SSRP1 axis-mediated regulation of H3K18la depends on p300's lactyl transferase activity (Fig. 5P). Additionally, we examined endogenous SSRP1 and H3K18la interactions under exogenous lactate gradient stimulation in RKO cells using anti-H3K18la or anti-SSRP1 antibodies. Results showed persistent interaction between endogenous SSRP1 and H3K18la, with complex abundance in immunoprecipitates gradually increasing with rising lactate concentrations (Fig. 5Q), suggesting that lactate accumulation enhances SSRP1 recognition of H3K18la. Immunofluorescence colocalization experiments further demonstrated that TRAF6 overexpression promoted SSRP1 enrichment from cytoplasm to nucleus, resulting in stronger aggregation signals within the nucleus (Fig. S4G). In this context, TRAF6 overexpression also enhanced the colocalization of SSRP1 with H3K18la (Fig. S4H). Lactate stimulation similarly promoted SSRP1 nuclear translocation and enhanced its nuclear signal (Fig. S4I). Upon addition of lactate to TRAF6-overexpressing RKO and DLD1 cells, immunofluorescence results showed further elevation of H3K18la levels (Fig. 5R, Fig. S4J), suggesting that TRAF6 and lactate accumulation synergistically amplify H3K18la modification.
TRAF6 promotes HK2/PGK1 expression and tumor glycolysis through H3K18 lactylation
To determine whether TRAF6 regulates glycolysis in CRC cells through H3K18la, we performed H3K18la ChIP-seq in TRAF6-overexpressing and control cells using an anti-H3K18la antibody. TRAF6 overexpression markedly altered the genome-wide distribution of H3K18la, particularly at promoters and other key regulatory elements (Figs. 6A, S5A). Functional enrichment analysis of gained H3K18la peaks revealed that these regions were preferentially associated with energy metabolism-related pathways, including cellular protein metabolic process, cell redox homeostasis, and ATPase-coupled transporter activity (Fig. 6B). Consistently, functional enrichment of differentially upregulated genes from RNA-seq analysis of TRAF6-overexpressing cells indicated significant enrichment in pathways related to protein ubiquitination and mitochondrial respirasome, which are tightly linked to protein modification and mitochondrial energy metabolism (Figs. S5B, S5C). To identify glycolytic targets potentially regulated by H3K18la, we performed a Venn analysis integrating genes associated with significantly increased H3K18la peaks from ChIP-seq, upregulated genes from RNA-seq, and glycolysis-related genes reported in the literature. This analysis yielded five overlapping genes: HK1, HK2, PGK1, PKM, and ENO1 (Fig. 6C). Visualization of H3K18la ChIP-seq tracks using IGV (v2.19) showed that the upregulated H3K18la peak of PGK1 was mainly localized at its promoter region, whereas the increased H3K18la signal at HK2 was primarily enriched at its enhancer region (Fig. 6D). ChIP-qPCR further confirmed that TRAF6 overexpression significantly enhanced H3K18la enrichment at the promoter/enhancer regions of HK2 and PGK1 in CRC cells (Fig. 6E).
TRAF6 promotes HK2/PGK1 expression and tumor glycolysis through H3K18 histone lactylation. A Chromatin immunoprecipitation followed by sequencing (ChIP-seq) in TRAF6-overexpressing RKO cells using H3K18la antibody-conjugated beads to enrich H3K18la-bound chromatin fragments for sequencing. B Functional enrichment analysis of genes associated with differential H3K18la peaks identified by ChIP-seq. C Venn diagram showing the overlap among genes associated with upregulated H3K18la peaks in ChIP-seq, upregulated genes in RNA-seq and literature-curated glycolysis-related genes. D IGV (v2.19.6) tracks displaying H3K18la peak distribution at the PGK1 and HK2 loci in TRAF6-overexpressing RKO cells. E ChIP-qPCR in TRAF6-overexpressing RKO and DLD1 cells using H3K18la antibody to assess H3K18la enrichment at HK2- and PGK1-associated regulatory regions. F Western blot analysis and quantification of HK2 and PGK1 protein levels in TRAF6-overexpressing RKO and DLD1 cells. G Western blot analysis and quantification of HK2 and PGK1 protein levels in TRAF6-knockdown RKO and DLD1 cells. H, I qPCR analysis of HK2 and PGK1 mRNA levels in TRAF6-overexpressing or TRAF6-knockdown RKO and DLD1 cells. J Western blot analysis and quantification of HK2 and PGK1 protein levels in RKO cells treated with DCA, oxamate or 2-DG for 24 h. K Immunohistochemical staining of TRAF6, HK2 and PGK1 in clinical CRC tissue specimens.
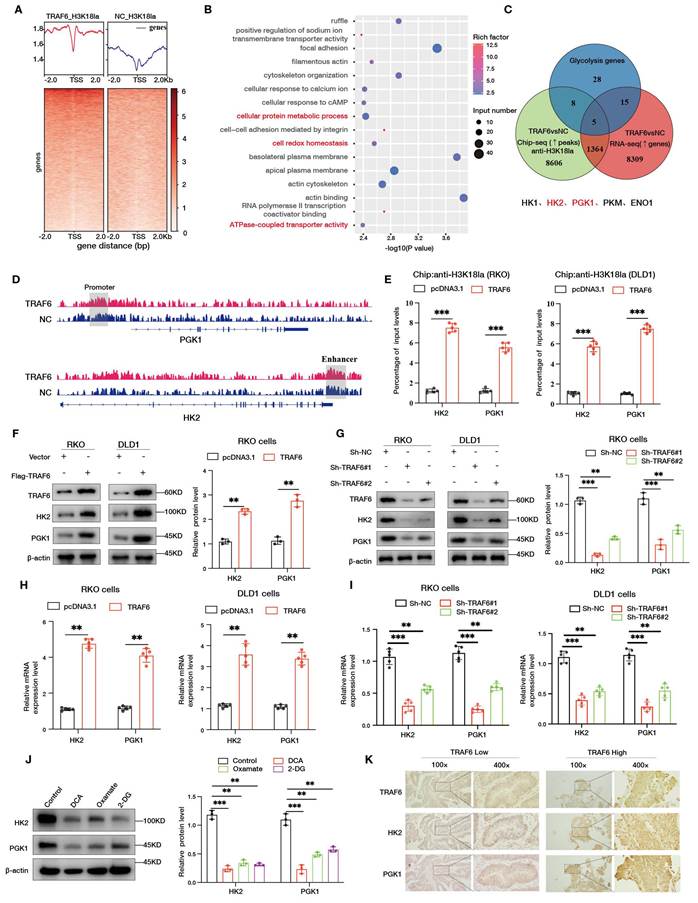
We next examined whether TRAF6 affects HK2 and PGK1 expression at the protein and mRNA levels. Western blotting showed that TRAF6 overexpression markedly increased HK2 and PGK1 protein levels (Figs. 6F, S5D), whereas TRAF6 knockdown led to a clear reduction in both proteins (Figs. 6G, S5E). RT-qPCR analysis corroborated these findings, showing that TRAF6 overexpression upregulated HK2 and PGK1 mRNA levels (Fig. 6H), while TRAF6 knockdown significantly decreased their transcripts (Fig. 6I). Pharmacological inhibition of glycolysis in RKO cells using DCA, oxamate, or 2-DG reduced HK2 and PGK1 protein expression to varying degrees (Fig. 6J), further linking glycolytic activity to the maintenance of these enzymes. In human CRC tissues, immunohistochemical analysis revealed that TRAF6 expression positively correlated with HK2 and PGK1 expression (Figs. 6K, S5F), supporting the involvement of a TRAF6-H3K18la-HK2/PGK1 axis in glycolytic reprogramming of CRC. To further confirm the role of p300 in the TRAF6-H3K18la-HK2/PGK1 axis, we co-transfected Flag-TRAF6 with si-p300 in RKO and DLD1 cells. Western blotting results showed that p300 knockdown significantly attenuated TRAF6-induced upregulation of HK2, PGK1, and H3K18la protein levels (Fig. S5G, Fig. S5H). ChIP-qPCR further demonstrated that p300 knockdown markedly reduced H3K18la enrichment at the HK2 enhancer and PGK1 promoter regions (Fig. S5I). Functional assays also revealed that p300 knockdown significantly decreased TRAF6-induced intracellular lactate levels (Fig. S5J), ATP content (Fig. S5K), and glycolytic capacity (Fig. S5L), indicating that p300 is the essential lactyl transferase required for TRAF6-mediated activation of HK2/PGK1 transcriptional programs via H3K18la modification.
TRAF6 regulates glycolysis in CRC cells by enhancing the transcriptional activity of HK2 and PGK1
To clarify how TRAF6 regulates HK2 and PGK1 expression, we performed dual-luciferase reporter assays. In both RKO and DLD1 cells, TRAF6 overexpression significantly increased the transcriptional activity of reporter constructs containing the promoter/enhancer regions of HK2 and PGK1 (Fig. 7A). Conversely, TRAF6 knockdown markedly suppressed the promoter/enhancer activities of HK2 and PGK1 in CRC cells (Fig. 7B). Furthermore, in TRAF6-silenced RKO cells, treatment with exogenous sodium lactate partially restored the transcriptional activity of HK2 and PGK1 promoter/enhancer reporters (Fig. 7C). qPCR analysis of clinical CRC specimens showed that HK2 and PGK1 mRNA levels were higher in tumor tissues than in matched adjacent normal tissues (Fig. 7D). Consistently, Western blotting confirmed elevated HK2 and PGK1 protein levels in tumor tissues (Figs. 7E, S6A). Box plot analyses based on the GEPIA2 database further demonstrated that HK2 and PGK1 expression was significantly higher in CRC tissues than in normal tissues (Fig. S6B), and TRAF6 expression positively correlated with HK2 and PGK1 levels (Fig. S6C). Analyses of The Cancer Genome Atlas (TCGA) dataset likewise revealed significant positive correlations between TRAF6 and HK2 or PGK1 expression in CRC samples (Fig. S6D).
TRAF6 regulates glycolysis in CRC cells by enhancing HK2/PGK1 transcriptional activity. A Dual-luciferase reporter assays in RKO and DLD1 cells transfected with increasing amounts of TRAF6 expression plasmid to assess the activity of HK2 and PGK1 promoters and enhancers. B Dual-luciferase assays in TRAF6-knockdown RKO and DLD1 cells measuring HK2 and PGK1 promoter and enhancer activity. C Dual-luciferase assays in TRAF6-knockdown RKO cells treated with sodium lactate for 24 h to evaluate HK2 and PGK1 promoter and enhancer activity. D, E Comparison of HK2 and PGK1 mRNA levels (D) and protein levels (E) between tumor tissues and matched adjacent normal tissues from 5 CRC patients. F, G Western blot validation of stable HK2-knockdown (F) and PGK1-knockdown (G) RKO and DLD1 cell lines. H-J Intracellular lactate levels (H), ATP levels (I) and LDHA immunofluorescence (J) in HK2-knockdown RKO and DLD1 cells. K-M Intracellular lactate levels (K), ATP levels (L) and LDHA immunofluorescence (M) in PGK1-knockdown RKO and DLD1 cells.
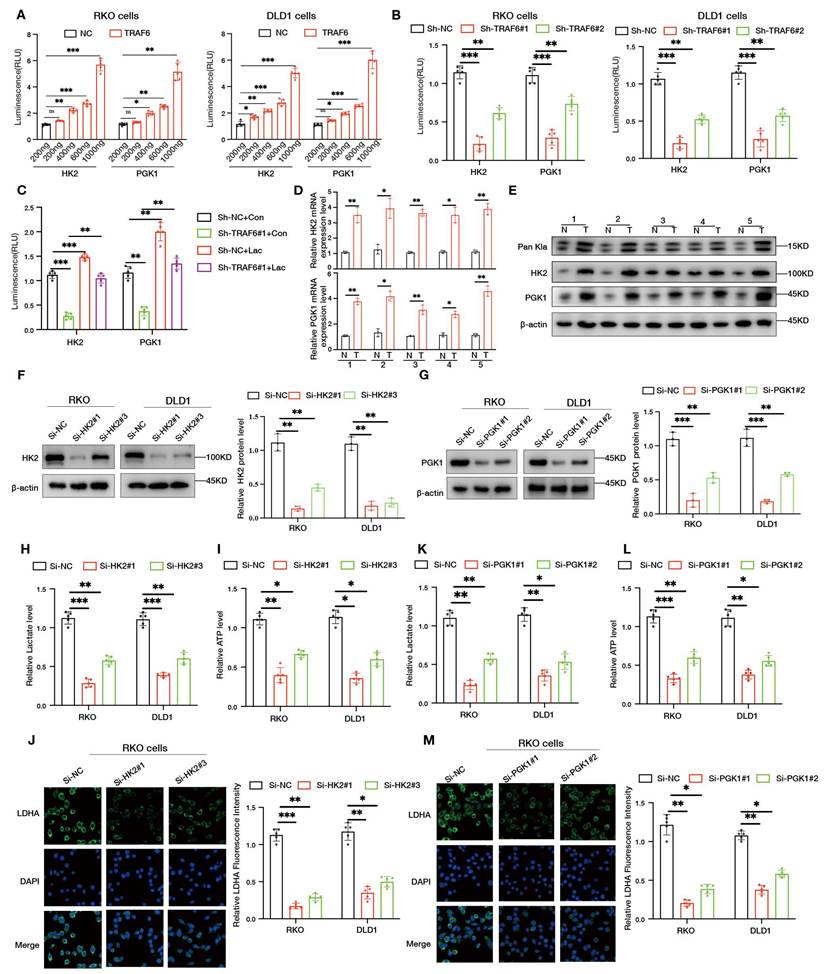
To functionally evaluate the contribution of HK2 and PGK1, we generated RKO and DLD1 cell lines with stable knockdown of HK2 or PGK1. Western blotting confirmed efficient reduction of HK2 (Fig. 7F) and PGK1 (Fig. 7G) protein levels in the respective cell lines. HK2 silencing led to a marked decrease in intracellular lactate (Fig. 7H) and ATP levels (Fig. 7I), accompanied by weakened LDHA immunofluorescence signals (Fig. 7J). Similarly, PGK1 knockdown significantly reduced lactate (Fig. 7K) and ATP levels (Fig. 7L), and LDHA expression detected by immunofluorescence was accordingly diminished (Fig. 7M), indicating that both HK2 and PGK1 are critical effectors through which TRAF6-dependent transcriptional regulation sustains glycolytic flux in CRC cells. To elucidate how the TRAF6-SSRP1 axis recruits p300 to target gene regulatory regions, we performed ChIP-qPCR analysis using anti-p300 antibody. Results showed that TRAF6 overexpression significantly enhanced p300 enrichment at the HK2 enhancer and PGK1 promoter regions (Fig. S7A), while knockdown of TRAF6 (Fig. S7B) or SSRP1 (Fig. S7C) markedly reduced p300 enrichment at these regions. Rescue experiments with wild-type SSRP1 or SSRP1 K548R mutant in the si-SSRP1 background revealed that only wild-type SSRP1 restored p300 chromatin enrichment, whereas the K548R mutant had no such effect (Fig. S7D), indicating that ubiquitination at SSRP1 K548 is critical for p300 localization to HK2/PGK1 regulatory regions. ChIP-reChIP experiments further confirmed that SSRP1 and p300 co-enriched at the HK2 enhancer and PGK1 promoter regions (Fig. S7E). Additionally, rescue experiments with wild-type TRAF6 or the E3-deficient TRAF6C70A mutant in TRAF6 knockdown cells showed that only wild-type TRAF6 restored HK2, PGK1, and H3K18la protein levels (Fig. S7F, Fig. S7G) as well as intracellular lactate (Fig. S7H) and ATP content (Fig. S7I), demonstrating that TRAF6's E3 ubiquitin ligase activity is essential for driving this axis.
The TRAF6-SSRP1-H3K18la axis promotes glycolysis and tumor progression by upregulating HK2 and PGK1
To delineate the contribution of the TRAF6-SSRP1-H3K18la axis to glycolytic regulation in CRC cells, we first performed rescue experiments in SSRP1-deficient cells. In CRC cells with stable SSRP1 knockdown, reintroduction of SSRP1 together with TRAF6 partially restored HK2 and PGK1 protein levels (Figs. 8A, 8B) and increased intracellular lactate content (Fig. 8C). Consistently, ECAR analysis indicated that SSRP1 re-expression reversed the reduction in glycolytic capacity caused by SSRP1 silencing (Fig. 8D) and partially recovered cell proliferation (Fig. 8E). To further confirm the function of SSRP1 K548 site ubiquitination in this process, we rescued SSRP1 knockdown RKO and DLD1 cells with Vector, wild-type Myc-SSRP1, or Myc-SSRP1K548R, and co-transfected Flag-TRAF6. Results showed that only wild-type SSRP1 restored HK2 and PGK1 protein expression levels (Fig. S8A) and concomitantly recovered intracellular lactate (Fig. S8B), ATP content (Fig. S8C), glycolytic capacity (Fig. S8D), and colony formation ability (Fig. S8E), while the K548R mutant had no such effects. ChIP-qPCR results further demonstrated that wild-type SSRP1 restored H3K18la enrichment at the HK2 enhancer and PGK1 promoter regions in RKO (Fig. S8F) and DLD1 (Fig. S8G) cells, whereas the K548R mutant could not, indicating that ubiquitination at SSRP1 K548 is a critical step for TRAF6-mediated activation of HK2/PGK1 via H3K18la. Furthermore, we co-transfected si-HK2 and TRAF6 plasmid in RKO cells. Western blotting results showed that TRAF6 overexpression partially reversed si-HK2-induced HK2 protein downregulation (Fig. S8H) and partially restored intracellular lactate levels (Fig. S8I) and glycolytic capacity (Fig. S8J), suggesting that HK2 is one of the key downstream effector molecules through which TRAF6 promotes glycolysis.
The TRAF6-SSRP1 axis promotes tumor progression by enhancing H3K18la and upregulating HK2/PGK1. A-C Stable SSRP1-knockdown RKO and DLD1 cells were co-transfected with TRAF6 and SSRP1; HK2, PGK1, H3K18la and related proteins were examined by western blotting (A) and quantified (B), and intracellular lactate levels were measured (C). D ECAR analysis in stable SSRP1-knockdown RKO cells co-transfected with TRAF6 and SSRP1, with glucose, oligomycin and 2-DG added at 20, 40 and 60 min, respectively. E EdU assays assessing the proliferative activity of stable SSRP1-knockdown RKO and DLD1 cells co-transfected with TRAF6 and SSRP1. F-J Lactate-induction xenograft model using BALB/c nude mice bearing subcutaneous tumors derived from TRAF6-overexpressing RKO cells: mice received daily intraperitoneal injections of sodium lactate (1 g/kg) starting 7 days before tumor inoculation and continuing until the endpoint; tumor volume was measured every 3 days (F), tumors were photographed at sacrifice (G), tumor weight was quantified (H), and tumor lactate levels (I) and expression of HK2, PGK1 and Pan-Kla (J) were analyzed. K-O Rescue xenograft model using BALB/c nude mice bearing subcutaneous tumors derived from RKO cells stably co-expressing sh-SSRP1 and TRAF6; tumor volume was monitored every 3 days (K), tumors were photographed at sacrifice (L), tumor weight was quantified (M), and tumor lactate levels (N) and related protein expression including HK2, PGK1 and Pan-Kla (O) were examined. P Immunohistochemical staining of TRAF6, H3K18la, HK2 and PGK1 in subcutaneous xenograft tumors from TRAF6-overexpressing and control groups.
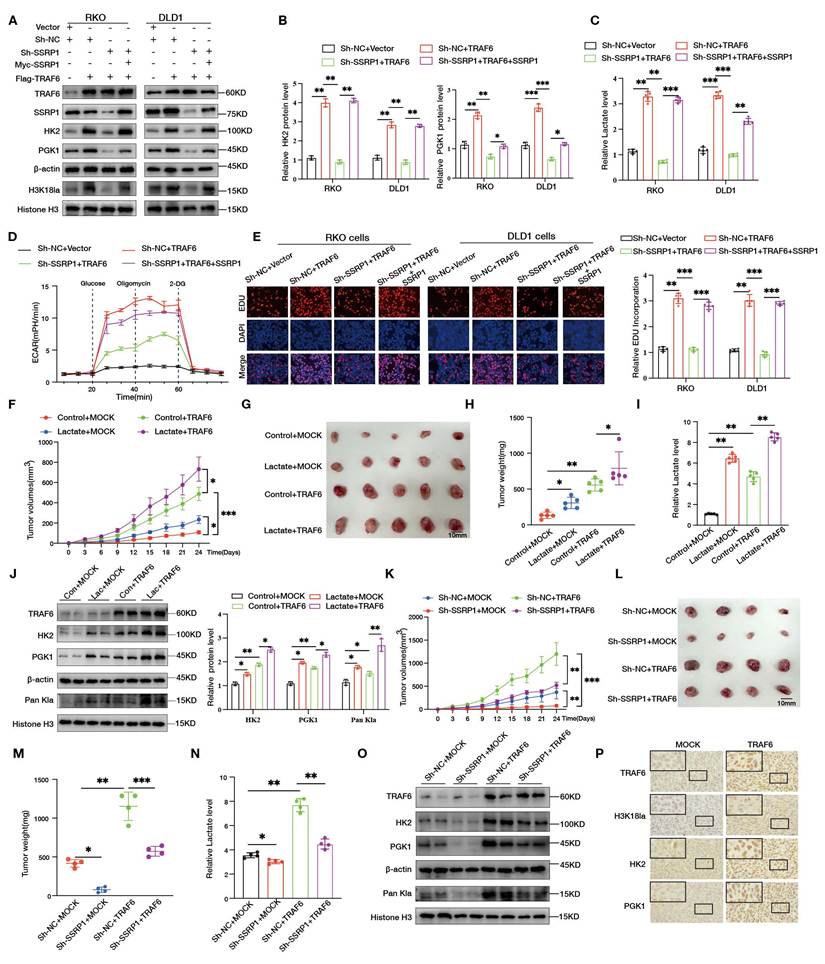
We first established a xenograft tumor model by subcutaneously injecting TRAF6-overexpressing RKO cells into female BALB/c nude mice. Tumor volumes were measured every 3 days (Fig. S9A), and mice were euthanized at endpoints to harvest tumor tissues and photograph xenografts from each group (Fig. S9B). Results showed that tumor weights in the TRAF6 overexpression group were significantly higher than controls (Fig. S9C), with markedly elevated tumor tissue lactate levels (Fig. S9D). Western blotting further demonstrated that HK2, PGK1, and histone Pan-Kla protein levels in TRAF6-overexpressing tumors were significantly elevated compared to controls (Fig. S9E).
Building on this, we administered exogenous lactate treatment in the TRAF6-overexpressing subcutaneous xenograft model, with daily intraperitoneal injections of sodium lactate (1 g/kg) starting 7 days before tumor inoculation until experimental endpoints. Results showed that compared to controls, lactate treatment further promoted tumor volume growth (Fig. 8F, Fig. 8G), increased xenograft weights (Fig. 8H), enhanced tumor tissue lactate content (Fig. 8I), and further upregulated HK2, PGK1, and histone Pan-Kla protein levels (Fig. 8J), suggesting that lactate accumulation and TRAF6 synergistically promote tumor glycolysis and growth. To assess the in vivo regulatory role of the TRAF6-SSRP1 axis on glycolysis and tumor growth, we overexpressed TRAF6 in SSRP1-stable knockdown RKO cells and established subcutaneous xenograft models. Results showed that TRAF6 overexpression partially reversed the tumor growth inhibition caused by SSRP1 knockdown, significantly increasing xenograft volumes (Fig. 8K, Fig. 8L), tumor weights (Fig. 8M), tumor tissue lactate levels (Fig. 8N), while restoring upregulation of HK2, PGK1, and histone Pan-Kla protein levels (Fig. 8O, Fig. S9F). Additionally, immunohistochemical analysis of subcutaneous xenografts from mice with high versus low TRAF6 expression revealed markedly elevated H3K18la, HK2, and PGK1 expression levels in TRAF6-high tumors (Fig. 8P, Fig. S9G), further confirming at the tissue level the role of the TRAF6-SSRP1-H3K18la-HK2/PGK1 axis in promoting glycolysis and tumor progression. To further verify the necessity of TRAF6 in maintaining the glycolytic phenotype of colorectal cancer in vivo, we established subcutaneous xenograft models using TRAF6-stable knockdown DLD1 colorectal cancer cells rescued with vector or TRAF6 (n=5 per group), with Sh-NC+vector group as control. Results showed that TRAF6 knockdown significantly inhibited xenograft growth, while TRAF6 rescue markedly restored tumor volumes (Fig. S9H, Fig. S9I) and tumor weights (Fig. S9J). Simultaneously, tumor tissue lactate levels (Fig. S9K) and protein expression levels of TRAF6, HK2, PGK1, and H3K18la (Fig. S9L, Fig. S9M) in the TRAF6 rescue group were significantly elevated compared to the Sh-TRAF6+vector group, further confirming at the in vivo level that TRAF6 is a key upstream driver of colorectal cancer glycolytic reprogramming.
Discussion
Recent studies have highlighted that reprogrammed energy metabolism is essential for tumor progression, and a highly active metabolic state can markedly accelerate tumor growth and advancement[28-30]. In our cohort of CRC specimens, lactate levels were generally higher in tumor tissues than in matched normal counterparts, suggesting enhanced glycolytic activity and a more active metabolic state in CRC lesions. Accumulating evidence indicates that intracellular lactate accumulation promotes histone lactylation, thereby driving malignant phenotypes and tumor progression[31, 32]. Consistently, our untargeted metabolomics and transcriptomic analyses both revealed a strong positive association between TRAF6 expression and glycolysis-related pathways. In clinical samples, TRAF6 expression was highly concordant with Pan-Kla staining on serial sections, and high Pan-Kla levels were associated with unfavorable prognosis. These findings are in line with recent clinical cohort data showing that elevated histone lactylation in CRC correlates with reduced survival and resistance to anti-VEGF and anti-PD-1 therapies[6, 33], further supporting a central role of histone lactylation in CRC progression[34, 35].
TRAF6 has emerged as a critical signaling hub in multiple malignancies, where it modulates cell proliferation, survival, metastasis, and anti-tumor immunity[36-38]. To date, only a few studies in lung and breast cancers have reported that TRAF6 promotes tumor progression by reprogramming glycolysis[22, 25, 39]. However, whether and how TRAF6 engages the histone lactylation axis to regulate metabolic reprogramming—particularly in CRC—has remained largely unexplored. By delineating a TRAF6-SSRP1-H3K18la axis, our study functionally links TRAF6 to both glycolytic reprogramming and histone lactylation in CRC, thereby extending the current glycolysis-lactylation-tumor progression network and, to our knowledge, providing the first systematic epigenetic characterization of TRAF6 in this context.
Lactate, classically regarded as the metabolic end product of the Warburg effect, has recently been redefined as an epigenetic substrate that drives histone lactylation and plays critical roles in maintaining stemness and mediating resistance to anti-angiogenic therapy in CRC[40-43]. Building on this concept, our study extended the functional relevance of lactate from metabolic regulation to epigenetic control. We found that TRAF6 overexpression significantly increased LDHA expression, intracellular lactate and ATP levels, and concomitantly elevated Pan-Kla and multiple histone H3 lactylation marks at both cellular and tissue levels. Under graded lactate stimulation, histone lactylation, particularly H3K18la, exhibited a dose-dependent increase, whereas treatment with glycolytic inhibitors including 2-DG, oxamate, and DCA proportionally reduced Pan-Kla, H3K18la, H3K14la, and H4K12la levels. Together with previous findings by Li et al[6]. demonstrating that suppression of histone lactylation reverses bevacizumab resistance and restrains CRC progression, our data indicate that TRAF6 promotes malignant progression in CRC by enhancing glycolysis and lactate production, thereby amplifying H3K18la signaling and establishing a sustained hyper-lactylated epigenetic state.
SSRP1 has been reported to be highly expressed in multiple malignancies and is closely involved in DNA replication, DNA damage repair, and transcriptional activation[9, 44]. In CRC, elevated SSRP1 expression correlates with advanced tumor stage and poor prognosis, whereas SSRP1 depletion significantly inhibited cell proliferation and migration[45]. However, the upstream signaling events that drive SSRP1 functional activation and the mechanisms by which it promotes histone lactylation deposition on chromatin remain poorly defined. Here, we identify a previously unrecognized mechanism wherein TRAF6 directly interacts with SSRP1 and catalyzed its K63-linked polyubiquitination. TRAF6 overexpression markedly increased SSRP1 polyubiquitination, whereas the E3 ligase-deficient TRAF6-C70A mutant largely lost this activity. Conversely, TRAF6 knockdown or expression of the ubiquitination-deficient SSRP1K548R mutant significantly reduced Pan-Kla and H3K18la levels and impaired cellular glycolytic capacity. Consistent with the established role of K63-linked polyubiquitination as a non-degradative modification[46-48], this mode of ubiquitination did not promote SSRP1 degradation but instead regulated its signaling function. Our findings extend the role of TRAF6 beyond canonical inflammatory and cell death pathways to a previously unrecognized layer of ubiquitination-dependent regulation of metabolic chromatin regulators. This mechanism is concordant with recent reports describing TRAF6-driven PKM2-mediated glycolysis and chemoresistance in triple-negative breast cancer, as well as ubiquitination-based control of glycolytic enzymes and signaling pathways in tumors[21], thereby providing new insight into the coordinated regulation of E3 ubiquitin ligases, chromatin factors, and metabolic reprogramming.
Building on these findings, we further directly linked K63-linked polyubiquitination-activated SSRP1 to H3K18la. Co-IP and lactate gradient-induction experiments demonstrated that SSRP1 displayed distinct selectivity toward different histone lactylation sites, with its interaction with H3K18la being the most stable and further strengthened under elevated lactate levels and TRAF6 overexpression. Consistently, co-localization analyses showed that TRAF6 promoted nuclear enrichment of SSRP1 and enhanced its spatial association with H3K18la. These observations extend the functional role of SSRP1 from a canonical subunit of the FACT complex to a K63-ubiquitination-dependent scaffold that recruits p300 to deposit H3K18 lactylation, complementing recent reports of H3K18la-binding factors, including TRIM33[49] and BRD9, which recruits the ncBAF chromatin remodeling complex[50]. Collectively, our results indicate that TRAF6-mediated K63-linked polyubiquitination not only activates SSRP1 but also contributes to the regulation of H3K18la-targeted metabolic regulatory elements[4, 31]. It should be further noted that SSRP1 itself does not possess lactyl transferase activity; therefore, its enrichment of H3K18la necessarily depends on the recruitment of a lactyl transferase. Our results demonstrate that p300 is the key enzyme fulfilling this role: TRAF6 overexpression enhances the interaction between SSRP1 and p300 and promotes p300 recruitment to the HK2 enhancer and PGK1 promoter regions, while SSRP1 knockdown or replacement of wild-type SSRP1 with the K548R mutant significantly reduces p300 enrichment at these regions. ChIP-reChIP results also confirm that SSRP1 and p300 co-occupy the same chromatin regions. Correspondingly, p300 knockdown blocks TRAF6-driven H3K18la enrichment at these sites, upregulation of HK2/PGK1 expression, and enhancement of the glycolytic phenotype. Thus, p300 can be clearly positioned between SSRP1 and downstream transcriptional activation: SSRP1 first recognizes and docks at lactylated chromatin, subsequently recruits p300, which locally deposits H3K18la at HK2/PGK1 regulatory elements, thereby activating transcription. This couples the reader role of SSRP1 with the writer role of p300 at the same sites in this study.
HK2 and PGK1 are key enzymes within the tumor glycolytic cascade[51]. Multiple studies have shown that both enzymes are markedly overexpressed in CRC and are closely associated with increased tumor burden, enhanced invasiveness and metastasis, and poor clinical outcomes[52, 53]. HK2 is significantly overexpressed in CRC tissues and cell lines, and its knockout inhibits CRC cell proliferation and xenograft tumor growth. B7-H3 enhances aerobic glycolysis and chemoresistance in CRC cells by upregulating HK2 expression, while KIAA1429 elevates CRC glycolytic levels in an HK2-dependent manner[54]. PGK1 promotes metastasis in colon cancer, and its O-GlcNAcylation coordinates glycolysis with the TCA cycle to promote tumor growth, while PRMT1-mediated arginine methylation of PGK1 enhances CRC glycolysis and tumorigenesis[55, 56]. In the present study, integrated H3K18la ChIP-seq and transcriptomic analyses revealed that TRAF6 overexpression markedly increased H3K18la enrichment at the HK2 enhancer and PGK1 promoter regions, concomitant with coordinated upregulation of their mRNA and protein expression. Dual-luciferase reporter assays further demonstrated that TRAF6 enhanced HK2 and PGK1 promoter and enhancer activity, whereas glycolytic inhibitors suppressed the H3K18la-HK2/PGK1 axis at both epigenetic and transcriptional levels. In xenograft models, TRAF6 overexpression or exogenous lactate administration coordinately increased tumor volume, intratumoral lactate levels, and expression of HK2 and PGK1, together with global histone lactylation. Collectively, these findings establish a closed regulatory circuit in which TRAF6 activates SSRP1 to recruit p300 and deposit H3K18la, thereby promoting transcription of HK2 and PGK1 and enhancing lactate production, which in turn reinforces H3K18la signaling. This positive feedback loop sustains metabolic reprogramming and drives malignant progression of CRC through the H3K18la-HK2/PGK1 axis. This study has several limitations. The clinical evidence is based on a relatively limited sample size, and the survival analysis relies on a single-center retrospective cohort. The prognostic value of TRAF6 and histone lactylation levels requires validation in larger independent cohorts. Mechanistic investigations were primarily based on cell lines and nude mouse subcutaneous xenograft models, which lack the orthotopic tumor microenvironment and intact immune system. Further confirmation using orthotopic transplantation and immunocompetent models is warranted. The roles of other lactyl transferases and delactylases beyond p300 in the TRAF6-SSRP1 axis remain to be systematically evaluated. These issues constitute the main directions for future research.
Conclusion
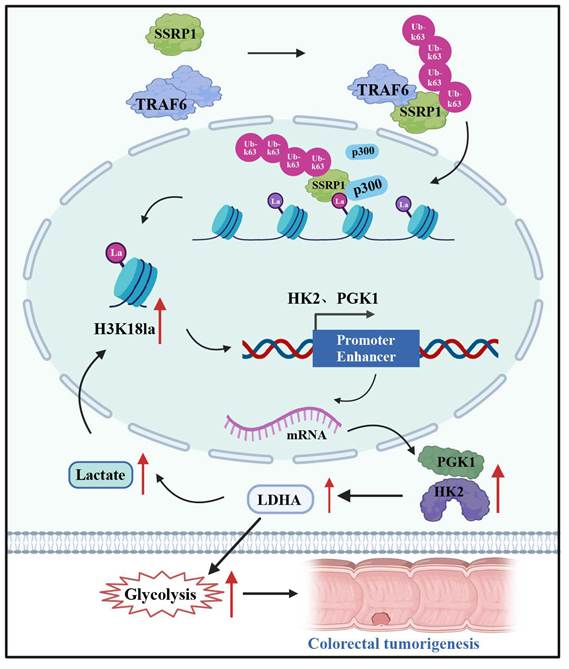
Overall, this study demonstrates that TRAF6 promotes H3K18 lactylation deposition by mediating K63-linked polyubiquitination of SSRP1, which recruits the lactyltransferase p300, thereby establishing functional H3K18la enrichment at the promoter and enhancer regions of HK2 and PGK1 to drive transcriptional activation of key glycolytic enzymes. Accordingly, we propose a previously unreported metabolic-epigenetic positive feedback pathway in CRC, termed the TRAF6-SSRP1-H3K18la-HK2/PGK1 axis (Fig. 9). These findings provide a mechanistic framework and highlight potential therapeutic opportunities for combinatorial targeting of E3 ubiquitination, the FACT complex, and lactylation-dependent chromatin activation in CRC.
Schematic representation of the molecular mechanism underlying TRAF6-mediated regulation of CRC cells. TRAF6 directly binds SSRP1 and catalyzes its K63-linked polyubiquitination, thereby activating SSRP1, which in turn recruits p300 to enhance histone H3K18 lactylation and promote its enrichment at the promoter and enhancer regions of the glycolytic genes HK2 and PGK1, consequently elevating glycolytic flux and driving malignant phenotypes in colorectal cancer cells.
Supplementary Material
Supplementary figures.

Supplementary table 1.
Supplementary table 2.
Acknowledgements
The authors gratefully thank Ling Lin of the Public Technology Service Center, Fujian Medical University, for technical assistance. This study was supported by the National Natural Science Foundation of China (No. 82573761, 82403621 and 82403558), the Fujian Province Eagle Plan Youth Top notch Talent Project (No. SCYJHJRC-ZGW2024), the Joint Funds for the Innovation of Science and Technology, Fujian Province (No. 2023Y9055). The mechanistic schematic was created using BioRender.com.
Data availability
The data used and/or analyzed in this study can be obtained from the corresponding author on reasonable request.
Author contributions
P.L., J.W. and C.L. conceived and designed the project. P.L. performed the experiments and wrote the manuscript. S.L., Y.J., R.H. and F.R. assisted with experimental procedures and data collection. C.L., J.W. and S.L. conducted data analysis and statistical evaluation. J.Y. and G.Z. supervised the study, provided guidance for experimental design and data interpretation, and critically revised the manuscript. All authors participated in the revision of the manuscript and approved the final version.
Ethics approval and consent to participate
This study was approved by the Institutional Review Board (IRB) of the First Affiliated Hospital of Fujian Medical University (permit number: MRCTA, ECFAH of FMU [2022] 515) and conducted in strict accordance with the Declaration of Helsinki. Written informed consent was obtained from each patient before enrollment. All animal experiments were reviewed by the Animal Management and Use Ethics Committee of Fujian Medical University and relevant animal associations (permit number: IACUC FJMU 2023-Y-0975). Every effort was made to minimize animal suffering.
Competing Interests
The authors have declared that no competing interest exists.
References
1. Sung H, Ferlay J, Siegel RL, Laversanne M, Soerjomataram I, Jemal A. et al. Global Cancer Statistics 2020: GLOBOCAN Estimates of Incidence and Mortality Worldwide for 36 Cancers in 185 Countries. CA Cancer J Clin. 2021;71(3):209-49
2. Patel SG, Karlitz JJ, Yen T, Lieu CH, Boland CR. The rising tide of early-onset colorectal cancer: a comprehensive review of epidemiology, clinical features, biology, risk factors, prevention, and early detection. Lancet Gastroenterol Hepatol. 2022;7(3):262-74
3. Li S, Shi X, Zhou X. Histone lactylation promoted colorectal cancer progression by enhancing tumor necrosis factor transcription and served as a diagnostic biomarker. Anticancer Drugs. 2026;37(3):245-51
4. Galle E, Wong CW, Ghosh A, Desgeorges T, Melrose K, Hinte LC. et al. H3K18 lactylation marks tissue-specific active enhancers. Genome Biol. 2022;23(1):207
5. Zhang C, Zhou L, Zhang M, Du Y, Li C, Ren H. et al. H3K18 Lactylation Potentiates Immune Escape of Non-Small Cell Lung Cancer. Cancer Res. 2024;84(21):3589-601
6. Li W, Zhou C, Yu L, Hou Z, Liu H, Kong L. et al. Tumor-derived lactate promotes resistance to bevacizumab treatment by facilitating autophagy enhancer protein RUBCNL expression through histone H3 lysine 18 lactylation (H3K18la) in colorectal cancer. Autophagy. 2024;20(1):114-30
7. Xie B, Zhang M, Li J, Cui J, Zhang P, Liu F. et al. KAT8-catalyzed lactylation promotes eEF1A2-mediated protein synthesis and colorectal carcinogenesis. Proc Natl Acad Sci U S A. 2024;121(8):e2314128121
8. Zhou J, Xu W, Wu Y, Wang M, Zhang N, Wang L. et al. GPR37 promotes colorectal cancer liver metastases by enhancing the glycolysis and histone lactylation via Hippo pathway. Oncogene. 2023;42(45):3319-30
9. Gao Y, Li C, Wei L, Teng Y, Nakajima S, Chen X. et al. SSRP1 Cooperates with PARP and XRCC1 to Facilitate Single-Strand DNA Break Repair by Chromatin Priming. Cancer Res. 2017;77(10):2674-85
10. Zhou D, Wu Z, Park JG, Fiches GN, Li TW, Ma Q. et al. FACT subunit SUPT16H associates with BRD4 and contributes to silencing of interferon signaling. Nucleic Acids Res. 2022;50(15):8700-18
11. Ehteda A, Simon S, Franshaw L, Giorgi FM, Liu J, Joshi S. et al. Dual targeting of the epigenome via FACT complex and histone deacetylase is a potent treatment strategy for DIPG. Cell Rep. 2021;35(2):108994
12. Ren Y, Fan L, Wang L, Liu Y, Zhang J, Wang B. et al. SSRP1/SLC3A2 Axis in Arginine Transport: A New Target for Overcoming Immune Evasion and Tumor Progression in Peripheral T-Cell Lymphoma. Adv Sci (Weinh). 2025;12(21):e2415698
13. Shen C, Xuan B, Yan T, Ma Y, Xu P, Tian X. et al. m6A-dependent glycolysis enhances colorectal cancer progression. Mol Cancer. 2020;19(1):72
14. Jing Z, Liu Q, He X, Jia Z, Xu Z, Yang B. et al. NCAPD3 enhances Warburg effect through c-myc and E2F1 and promotes the occurrence and progression of colorectal cancer. J Exp Clin Cancer Res. 2022;41(1):198
15. Li J, Chen X, Song S, Jiang W, Geng T, Wang T. et al. Hexokinase 2-mediated metabolic stress and inflammation burden of liver macrophages via histone lactylation in MASLD. Cell Rep. 2025;44(3):115350
16. Li J, Liu N, Tang L, Yan B, Chen X, Zhang J. et al. The relationship between TRAF6 and tumors. Cancer Cell Int. 2020;20:429
17. Yu X, Yang J, Xu J, Pan H, Wang W, Yu X. et al. Histone lactylation: from tumor lactate metabolism to epigenetic regulation. Int J Biol Sci. 2024;20(5):1833-54
18. Li XM, Yang Y, Jiang FQ, Hu G, Wan S, Yan WY. et al. Histone lactylation inhibits RARγ expression in macrophages to promote colorectal tumorigenesis through activation of TRAF6-IL-6-STAT3 signaling. Cell Rep. 2024;43(2):113688
19. Ye X, Wu H, Sheng L, Liu YX, Ye F, Wang M. et al. Oncogenic potential of truncated RXRα during colitis-associated colorectal tumorigenesis by promoting IL-6-STAT3 signaling. Nat Commun. 2019;10(1):1463
20. Komander D, Rape M. The ubiquitin code. Annu Rev Biochem. 2012;81:203-29
21. Xu H, Li L, Dong B, Lu J, Zhou K, Yin X. et al. TRAF6 promotes chemoresistance to paclitaxel of triple negative breast cancer via regulating PKM2-mediated glycolysis. Cancer Med. 2023;12(19):19807-20
22. Feng L, Feng S, Nie Z, Deng Y, Xuan Y, Chen X. et al. TRAF6 Promoted Tumor Glycolysis in Non-Small-Cell Lung Cancer by Activating the Akt-HIFα Pathway. Biomed Res Int. 2021;2021:3431245
23. Sun H, Li XB, Meng Y, Fan L, Li M, Fang J. TRAF6 upregulates expression of HIF-1α and promotes tumor angiogenesis. Cancer Res. 2013;73(15):4950-9
24. Lu W, Liu S, Li B, Xie Y, Izban MG, Ballard BR. et al. SKP2 loss destabilizes EZH2 by promoting TRAF6-mediated ubiquitination to suppress prostate cancer. Oncogene. 2017;36(10):1364-73
25. Rezaeian AH, Li CF, Wu CY, Zhang X, Delacerda J, You MJ. et al. A hypoxia-responsive TRAF6-ATM-H2AX signalling axis promotes HIF1α activation, tumorigenesis and metastasis. Nat Cell Biol. 2017;19(1):38-51
26. Jiang ST, He X, Wang YW, Chen WS, Guan P. p300: expanding beyond acetylation to mastermind lactylation-dependent tumorigenesis. Front Cell Dev Biol. 2026;14:1811421
27. Chen ZJ. Ubiquitination in signaling to and activation of IKK. Immunol Rev. 2012;246(1):95-106
28. Lin J, Rao D, Zhang M, Gao Q. Metabolic reprogramming in the tumor microenvironment of liver cancer. J Hematol Oncol. 2024;17(1):6
29. Nicolini A, Ferrari P. Involvement of tumor immune microenvironment metabolic reprogramming in colorectal cancer progression, immune escape, and response to immunotherapy. Front Immunol. 2024;15:1353787
30. Yang F, Hilakivi-Clarke L, Shaha A, Wang Y, Wang X, Deng Y. et al. Metabolic reprogramming and its clinical implication for liver cancer. Hepatology. 2023;78(5):1602-24
31. Li F, Si W, Xia L, Yin D, Wei T, Tao M. et al. Positive feedback regulation between glycolysis and histone lactylation drives oncogenesis in pancreatic ductal adenocarcinoma. Mol Cancer. 2024;23(1):90
32. Zong Z, Xie F, Wang S, Wu X, Zhang Z, Yang B. et al. Alanyl-tRNA synthetase, AARS1, is a lactate sensor and lactyltransferase that lactylates p53 and contributes to tumorigenesis. Cell. 2024;187(10):2375-2392.e33
33. Huang H, Chen K, Zhu Y, Hu Z, Wang Y, Chen J. et al. A multi-dimensional approach to unravel the intricacies of lactylation related signature for prognostic and therapeutic insight in colorectal cancer. J Transl Med. 2024;22(1):211
34. Li Y, Peng J, Wu D, Xie Q, Hou Y, Li L. et al. Histone lactylation-boosted AURKB facilitates colorectal cancer progression by inhibiting HNRNPM-mediated PSAT1 mRNA degradation. J Exp Clin Cancer Res. 2025;44(1):233
35. Zhang C, Yu R, Li S, Yuan M, Hu T, Liu J. et al. KRAS mutation increases histone H3 lysine 9 lactylation (H3K9la) to promote colorectal cancer progression by facilitating cholesterol transporter GRAMD1A expression. Cell Death Differ. 2025;32(12):2225-38
36. Chen D, Wu J, Qiu X, Luo S, Huang S, Wei E. et al. SPHK1 potentiates colorectal cancer progression and metastasis via regulating autophagy mediated by TRAF6-induced ULK1 ubiquitination. Cancer Gene Ther. 2024;31(3):410-9
37. Yang M, Jin M, Li K, Liu H, Yang X, Zhang X. et al. TRAF6 Promotes Gastric Cancer Cell Self-Renewal, Proliferation, and Migration. Stem Cells Int. 2020;2020:3296192
38. Li Y, Peng J, Xia Y, Pan C, Li Y, Gu W. et al. Sufu limits sepsis-induced lung inflammation via regulating phase separation of TRAF6. Theranostics. 2023;13(11):3761-80
39. Chan CH, Li CF, Yang WL, Gao Y, Lee SW, Feng Z. et al. The Skp2-SCF E3 ligase regulates Akt ubiquitination, glycolysis, herceptin sensitivity, and tumorigenesis. Cell. 2012;149(5):1098-111
40. Colbert LE, El Alam MB, Wang R, Karpinets T, Lo D, Lynn EJ. et al. Tumor-resident Lactobacillus iners confer chemoradiation resistance through lactate-induced metabolic rewiring. Cancer Cell. 2023;41(11):1945-1962.e11
41. Dong S, Liang S, Cheng Z, Zhang X, Luo L, Li L. et al. ROS/PI3K/Akt and Wnt/β-catenin signalings activate HIF-1α-induced metabolic reprogramming to impart 5-fluorouracil resistance in colorectal cancer. J Exp Clin Cancer Res. 2022;41(1):15
42. Xiong J, He J, Zhu J, Pan J, Liao W, Ye H. et al. Lactylation-driven METTL3-mediated RNA m6A modification promotes immunosuppression of tumor-infiltrating myeloid cells. Mol Cell. 2022;82(9):1660-1677.e10
43. Zhang Q, Zhao Q, Li T, Lu L, Wang F, Zhang H. et al. Lactobacillus plantarum-derived indole-3-lactic acid ameliorates colorectal tumorigenesis via epigenetic regulation of CD8+ T cell immunity. Cell Metab. 2023;35(6):943-960.e9
44. Fleyshman D, Prendergast L, Safina A, Paszkiewicz G, Commane M, Morgan K. et al. Level of FACT defines the transcriptional landscape and aggressive phenotype of breast cancer cells. Oncotarget. 2017;8(13):20525-42
45. Wang Q, Jia S, Jiao Y, Xu L, Wang D, Chen X. et al. SSRP1 influences colorectal cancer cell growth and apoptosis via the AKT pathway. Int J Med Sci. 2019;16(12):1573-82
46. Zhu G, Herlyn M, Yang X. TRIM15 and CYLD regulate ERK activation via lysine-63-linked polyubiquitination. Nat Cell Biol. 2021;23(9):978-91
47. Hou J, Han L, Zhao Z, Liu H, Zhang L, Ma C. et al. USP18 positively regulates innate antiviral immunity by promoting K63-linked polyubiquitination of MAVS. Nat Commun. 2021;12(1):2970
48. Kulathu Y, Komander D. Atypical ubiquitylation - the unexplored world of polyubiquitin beyond Lys48 and Lys63 linkages. Nat Rev Mol Cell Biol. 2012;13(8):508-23
49. Nuñez R, Sidlowski PFW, Steen EA, Wynia-Smith SL, Sprague DJ, Keyes RF. et al. The TRIM33 Bromodomain Recognizes Histone Lysine Lactylation. ACS Chem Biol. 2024;19(12):2418-28
50. Wei E, Ji D, Jia Y, Sun Z, Gao C, Zeng C. et al. BRD9 recognizes lactate-induced H3K18 lactylation to drive oncogenic chromatin remodeling in hepatocellular carcinoma. Cell Death Differ. 2026;33(10):1946-59
51. Shan Z, Liu Y. Harnessing glycolysis in gastric cancer: molecular targets, therapeutic strategies, and clinical horizons. Front Immunol. 2025;16:1628937
52. Nie H, Ju H, Fan J, Shi X, Cheng Y, Cang X. et al. O-GlcNAcylation of PGK1 coordinates glycolysis and TCA cycle to promote tumor growth. Nat Commun. 2020;11(1):36
53. Yan H, Wang Z, Teng D, Chen X, Zhu Z, Chen H. et al. Hexokinase 2 senses fructose in tumor-associated macrophages to promote colorectal cancer growth. Cell Metab. 2024;36(11):2449-2467.e6
54. Shi T, Ma Y, Cao L, Zhan S, Xu Y, Fu F. et al. B7-H3 promotes aerobic glycolysis and chemoresistance in colorectal cancer cells by regulating HK2. Cell Death Dis. 2019;10(4):308
55. Ahmad SS, Glatzle J, Bajaeifer K, Bühler S, Lehmann T, Königsrainer I. et al. Phosphoglycerate kinase 1 as a promoter of metastasis in colon cancer. Int J Oncol. 2013;43(2):586-90
56. Liu H, Chen X, Wang P, Chen M, Deng C, Qian X. et al. PRMT1-mediated PGK1 arginine methylation promotes colorectal cancer glycolysis and tumorigenesis. Cell Death Dis. 2024;15(2):170
Author contact
Corresponding author: Guangwei Zhu, Department of Gastrointestinal Surgery 2 Section, the First Affiliated Hospital, Fujian Medical University, No. 20 Chazhong Road, Taijiang District, Fuzhou City, Fujian Province, 350005, P.R. China. Telephone: +86-591-87981029. E-mail: zgw3146edu.cn; and Jianxin Ye, yjx0201edu.cn.