Impact Factor ISSN: 1449-2288




Int J Biol Sci 2027; 23(2):720-732. doi:10.7150/ijbs.135064 This issue Cite
Research Paper
MeLoDe: detecting DNA methylation from low-depth long-read sequencing data
Yujie Cao1,2#, Shufeng Sun3,1#, Shuhua Chen3,1#, Wen Yang1,2, Xinran Liu1,2, Feng Xu4, Weiyuan Jin4, Yifei Wang1,2, Liyang Song1,2, Zhongqu Duan1,2, Jian Yang1,2 
1. New Cornerstone Science Laboratory, School of Life Sciences, Westlake University, Hangzhou 310030, China.
2. Westlake Laboratory of Life Sciences and Biomedicine, Hangzhou 310030, China.
3. School of Life Sciences, Fudan University, Shanghai 200438, China.
4. High-throughput Core Facility, Westlake University, Hangzhou 310030, China.
#These authors contributed equally.
Received 2026-5-1; Accepted 2026-10-31; Published 2027-1-1
Abstract
Long-read sequencing (LRS) technology provides both nucleotide sequence and epigenetic modification data from a single molecule, but its high cost limits large-scale applications. A low-depth experimental design offers a cost-effective solution. Here, we present MeLoDe, a deep learning method for detecting 5-methylcytosine (5mC) at CpG dinucleotides from low-depth PacBio LRS data. MeLoDe enables accurate and comprehensive 5mC detection by leveraging both high-fidelity (HiFi) and non-HiFi reads and is further optimized for cohort-level applications. At sequencing depths of 5×, 8×, and 10× DNA templates, MeLoDe (using both HiFi and non-HiFi reads) recovered 313%, 113% and 56% more CpG sites with 5mC estimates than the HiFi-only approach, while maintaining relative accuracies of 97%, 98% and 99%, respectively. When applied to a low-depth LRS cohort, MeLoDe identified 81-fold more methylation quantitative trait loci (meQTLs) involving 20-fold more mCpG sites (CpG sites with meQTL) than the HiFi-only analysis. Overall, MeLoDe makes 5mC detection at CpG sites from low-depth LRS data feasible, broadening the scope of LRS for large-scale epigenetic studies.
Introduction
Long-read sequencing (LRS) has revolutionized genomics, enabling significant advances in resolving complex genomic regions, discovering novel transcripts, and detecting structural variations[1-6]. Beyond DNA or RNA sequences, LRS technologies capture supplementary information, such as fluorescent signal pulses or electrolytic current signals, allowing for the direct detection of DNA or RNA modifications[7-9]. This includes DNA methylation (DNAm)[8, 10], a crucial epigenetic mechanism implicated in diverse biological processes and disease etiologies[11-13]. However, the high cost of LRS remains a major obstacle to its application in large cohorts. Adopting low-depth LRS experimental design is a viable strategy to mitigate this financial barrier[14, 15].
PacBio single-molecule real-time (SMRT) sequencing is a leading LRS technology[16]. State-of-the-art SMRT-based tools for detecting 5-methylcytosine (5mC) at CpG dinucleotides, the most common form of DNAm, rely exclusively on high-fidelity (HiFi) reads[17-19]. HiFi reads are generated by taking the consensus nucleotides from error-prone subreads sequenced from a single DNA template molecule[17]. However, non-HiFi reads, which are derived from DNA templates that fail to produce a HiFi consensus, are systematically discarded during the methylation calling process. In low-depth LRS, where HiFi reads are inherently limited, this practice limits the number of detectable CpG sites with 5mC estimates per individual methylome, leading to high missing data rates across a cohort. This, in turn, impairs the statistical power of downstream cohort-level analysis, such as methylation quantitative trait locus (meQTL) mapping and methylome-wide association studies. Addressing this gap is therefore critical and requires a method that enhances both the completeness and accuracy of DNAm detection from low-depth LRS data.
In this study, we present MeLoDe (methylation detector for low-depth long-read sequencing), a deep learning method for detecting 5mC at CpG sites to base-pair resolution from low-depth LRS data. Unlike existing methods, MeLoDe utilizes both HiFi and non-HiFi reads. MeLoDe's models are trained first at the read level to determine the methylation status of individual HiFi and non-HiFi reads, and then at the CpG site level to infer the 5mC methylation frequency of a focal CpG site by incorporating data from the correlated surrounding CpGs. This framework is specifically optimized for cohort-level applications. At sequencing depths of 5×, 8×, and 10× DNA templates, MeLoDe recovered 313%, 113%, and 56% more CpG sites with 5mC estimates, while maintaining relative accuracies of 97%, 98%, and 99%, respectively, compared to using HiFi reads only. We further demonstrated that in a cohort with low-depth LRS data (~9× DNA template coverage), MeLoDe enabled the discovery of 81-fold more meQTLs associated with 20-fold more 5mCpG sites, compared to the HiFi-only results. Implemented in the Go programming language, MeLoDe is freely available at https://github.com/jianyanglab/MeLoDe.
Results
Overview of the MeLoDe method
State-of-the-art methods for predicting 5mC at CpG sites from LRS data typically follow a multi-step process[20]. First, a read-level model predicts the 5mC probability for CpGs located on each sequencing read. The methylation frequency at a given CpG site is then computed as the proportion of aligned reads called as methylated (count-based). Finally, a site-level model improves prediction accuracy by jointly modeling a focal site with its neighboring CpG sites (model-based). Studies have shown that jointly modeling neighboring CpG sites improves prediction accuracy for the focal site[17, 21, 22]. However, existing methods predominantly use only HiFi reads because of their higher read-level accuracy[2], leaving non-HiFi reads unused, which can account for 60%-75% of all DNA templates (Fig. 1a). We hypothesized that although individual non-HiFi reads have lower read-level accuracy, their inclusion could substantially increase CpG sites coverage, especially in low-depth LRS data, thereby improving the completeness and accuracy of site-level prediction. We therefore developed MeLoDe to predict DNAm by leveraging both HiFi and non-HiFi reads.
Overview of MeLoDe. a, Schematic of PacBio SMRT sequencing reads. A single DNA template is sequenced in a Zero Mode Waveguide (ZMW), producing multiple subreads. Subreads are processed to generate a high-fidelity (HiFi) consensus read. Templates that do not yield a HiFi consensus produce non-HiFi reads, which are further classified as non-HiFi-Closed (non-HiFi-C) if both DNA strands were sequenced, or non-HiFi-Open (non-HiFi-O) if only one was sequenced. b, The MeLoDe workflow. Step 1: Read-level models use DNA polymerase kinetic signals (inter-pulse duration, IPD; pulse width, PW) and sequence context to predict 5mCpG probabilities for HiFi, non-HiFi-C, and non-HiFi-O reads. Step 2: Site-level models predict the methylation frequency for a focal CpG site by integrating read-level probabilities from the focal site and its neighbors. Predictions are made separately for three site categories before being combined. H-sites: sites with sufficient HiFi read coverage (e.g., ≥4×). C-sites: sites with insufficient HiFi coverage but sufficient combined coverage from HiFi and non-HiFi-C reads. O-sites: sites meeting the coverage threshold only after including all read types. c, Generation of training data. Read-level models are trained on fully methylated (M.SssI-treated; positive labels) and unmethylated (whole-genome amplified; negative labels) DNA. Site-level models are trained on untreated DNA with ground-truth methylation frequencies from WGBS. Panel created with BioRender.com.
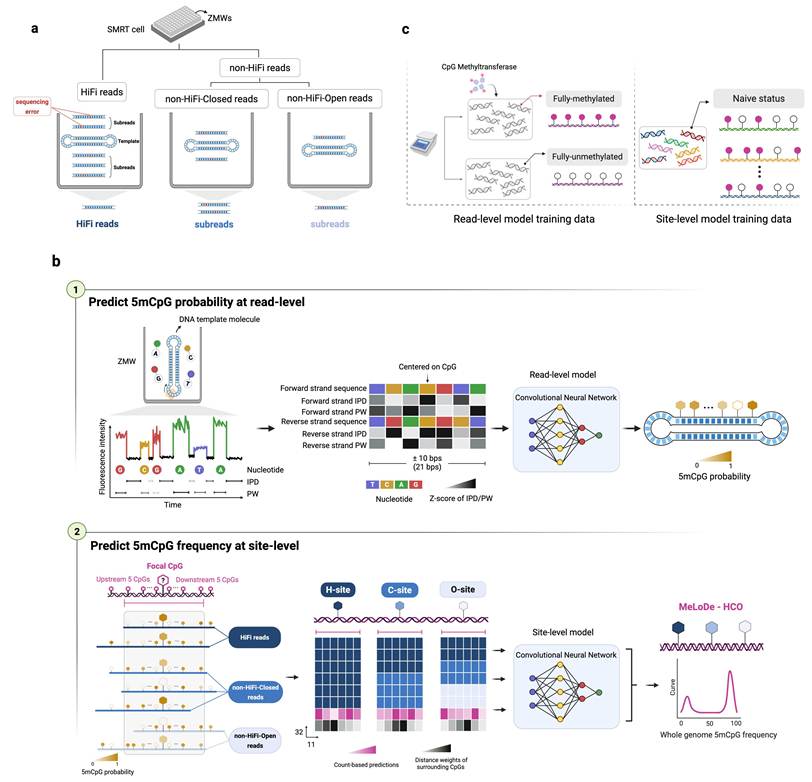
The workflow of MeLoDe consists of two main steps (Fig. 1b). The read-level model produces 5mC probabilities on the [0,1] scale for CpGs located on sequencing reads. The site-level model then aggregates these probabilities across reads to predict model-based methylation frequency estimates on the [0,1] scale, which are directly comparable to beta values from EPIC arrays or whole-genome bisulfite sequencing (WGBS) data. In detail, the first step is read-level CpG site 5mC probability prediction for both HiFi and non-HiFi reads. Non-HiFi reads are classified into non-HiFi-Closed (non-HiFi-C), where both strands of the DNA template are sequenced, or non-HiFi-Open (non-HiFi-O), where only one strand is sequenced (Fig. 1a). In MeLoDe, three read-level models are trained: two double-strand models for HiFi and non-HiFi-C reads, and one single-strand model for non-HiFi-O reads. These models use DNA polymerase kinetic signals of inter-pulse duration (IPD) and pulse width (PW)[8], together with the nucleotide sequence from a ±10 bp window centered on the focal CpG site as input. The output is the read-level focal CpG site 5mC probability on the [0,1] scale. For HiFi reads, features are extracted directly from the consensus files; for non-HiFi reads, they are derived by summarizing subreads. Following prior work[23], read-level models are built using a Convolutional Neural Network (CNN) framework and trained on PacBio LRS data from fully-methylated DNA samples, created by treatment with CpG Methyltransferase (positive labels), and fully-unmethylated DNA samples, obtained through whole genome amplification (negative labels) (Fig. 1c).
The second step uses site-level CNN models to predict the final methylation frequency for each CpG site, using read-level 5mC probabilities as input. To maximize accuracy, MeLoDe prioritizes HiFi reads and sequentially incorporates non-HiFi-C and non-HiFi-O reads only when coverage is insufficient. CpG sites are thus classified into three non-overlapping categories: H-sites (sufficient HiFi coverage, e.g., ≥4×), C-sites (insufficient HiFi coverage but sufficient when combined with non-HiFi-C reads), and O-sites (coverage threshold met only after including all read types). Since sites of the same category tend to cluster genomically, they are modeled and predicted separately before the results are merged. The site-level model takes a focal CpG site and its ±5 neighboring CpG sites as input, and outputs a continuous methylation frequency between 0 and 1 for the focal site. The site-level models were trained using PacBio LRS data from untreated DNA samples, with ground-truth methylation frequencies obtained from WGBS (Fig. 1c). A summary table of the read-level and site-level models, covering the unit of analysis, input features, training labels, model output, evaluation metric and interpretation, is provided in Supplementary Table 1.
Data, model training, and evaluation
We generated training data using DNA samples derived from EBV-transformed lymphoblastoid B-cell lines from five unrelated individuals of diverse ancestry from the Human Pangenome Reference Consortium[24] (Methods and sections 1 and 2 of the Supplementary Note). To train the read-level models, we generated PacBio LRS datasets from M.SssI-treated DNA (fully methylated) and whole-genome-amplified DNA (fully unmethylated), each sequenced to 25× template coverage, including 12× HiFi reads, with subreads available. For the site-level models, we generated both PacBio LRS data (50× template coverage, including 25× HiFi reads, with subreads available) and WGBS data (60× coverage, as ground truth) from untreated DNA of the same cell lines. Additionally, we included data from 110 individuals, with PacBio LRS (8.6× DNA templates, including 2.7× HiFi reads, with subreads available), short-read WGS (17×), and short-read WGBS (17×) data, from the 1000 Chinese Pangenome (1KCP) project[25] to fine-tune the site-level model for cohort-level applications (section 2 of the Supplementary Note).
For both the read-level and site-level models, we used dedicated training data and one or more independent testing datasets to evaluate performance. The training data was randomly split into a training subset (90%) and a validation subset (10%) to train the model and optimize hyperparameters (Methods), including the nucleotide window size in the read-level model (Supplementary Fig. 1), the number of neighboring CpG sites in the site-level model (Supplementary Fig. 2a), and various architectural parameters (Supplementary Tables 2-3). Using the training-testing framework, we investigated factors affecting read-level model performance (section 1 of the Supplementary Note). Key findings include: 1) model prediction accuracy increased with training read depth per site (Supplementary Fig. 3a); 2) model performance plateaued after training on ~10 million CpGs (Supplementary Fig. 3b); 3) models showed robust cross-ancestry performance (Supplementary Fig. 4); 4) for HiFi data, using consensus reads outperformed subreads, and for non-HiFi data, non-HiFi-C reads had higher accuracy than non-HiFi-O reads (Supplementary Fig. 5).
For the site-level model (section 2 of the Supplementary Note), we found that at least 5 million CpG sites were required for robust training (Supplementary Fig. 2b) and models trained on multi-depth data showed improved robustness (Supplementary Fig. 6). Substituting the CNN with a Transformer-based architecture yielded similar performance (Supplementary Fig. 7). Furthermore, we found that including non-HiFi reads increased the prediction accuracy for C-sites and O-sites (Supplementary Fig. 8) and that training with a balanced composition of variable and conserved CpG sites showed the best overall performance in cohort-level data (Supplementary Fig. 9; Supplementary Table 4).
MeLoDe enables accurate and comprehensive methylome reconstruction
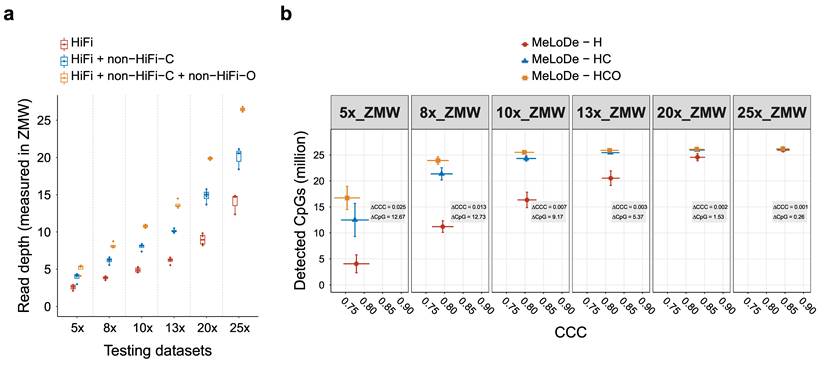
Having established and tuned the MeLoDe models, we benchmarked their performance using PacBio LRS data from 10 individuals (30× HiFi with subreads available) from the 1KCP project. Performance was assessed using the CCC (concordance correlation coefficient), which measures absolute concordance with WGBS, and relative accuracy, defined as the CCC of non-HiFi-rescued sites relative to that of HiFi-only H-sites (see Methods). To test performance across various sequencing depths, we down-sampled the high-depth LRS data to generate datasets ranging from 5× to 25× DNA template coverage (including 2.5× to 15× HiFi reads) (Fig. 2a). The default QC criteria in MeLoDe were applied, including a read-level mapping quality filter ≥ 30, and a site-level read depth filter of ≥ 4×.
Benchmarking of MeLoDe. a, Testing datasets. HiFi: HiFi reads; non-HiFi-C: non-HiFi-Closed reads; non-HiFi-O: non-HiFi-Open reads. b, Benchmarking MeLoDe performance across sequencing depths. The number of detected CpG sites (y-axis) is plotted against prediction accuracy (concordance correlation coefficient, CCC; x-axis). Performance is shown for three modes: MeLoDe-H: using only HiFi reads; MeLoDe-HC: using both HiFi and non-HiFi-Closed reads, and MeLoDe-HCO: using all read types. Site categories are defined using a 4× coverage threshold: H-sites (HiFi coverage ≥4×), C-sites (HiFi <4× and HiFi + non-HiFi-C ≥4×), and O-sites (HiFi + non-HiFi-C <4× and total coverage ≥4×). In each depth panel of b, ΔCCC and ΔCpG denote the maximum difference across the three modes at that depth (max - min): ΔCCC narrows from 0.025 at 5× to 0.001 at 25×, and ΔCpG from 12.67 million to 0.26 million detected CpG sites, indicating that the three modes converge at 25× depth.
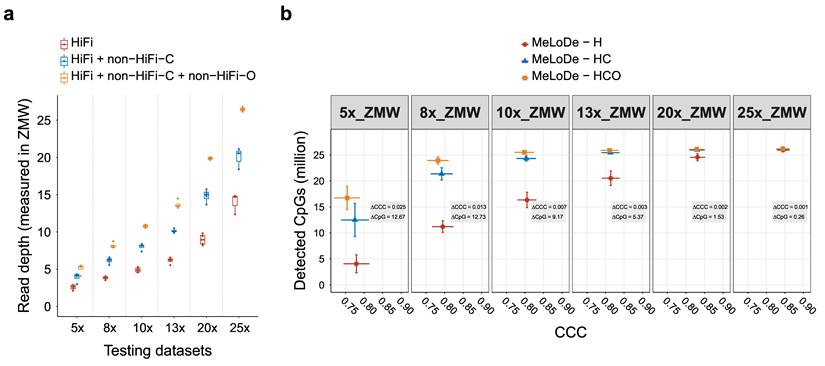
At 5×, 8×, and 10× DNA template coverage (corresponding to 2.5×, 4.0×, and 5.0× HiFi reads), MeLoDe using both HiFi and non-HiFi-Closed reads (MeLoDe-HC) recovered 208%, 90%, and 49% more CpG sites with 5mC estimates, with relative accuracies of 99.5%, 99.6%, and 99.8%, respectively, compared to using HiFi reads only (MeLoDe-H) (Fig. 2b). The inclusion of non-HiFi-Open reads further increased the number of CpG sites with 5mC estimates, at a minimal cost to accuracy. Specifically, MeLoDe using all read types (MeLoDe-HCO) recovered 313%, 113%, and 56% more CpG sites with 5mC estimates, at 97.0%, 98.4%, and 99.1% relative accuracies, respectively, compared to MeLoDe-H. As sequencing depth increased to 13× and 20×, the performance gap between MeLoDe-HCO and MeLoDe-H narrowed, though MeLoDe-HCO still recovered 26% and 6% more CpG sites with nearly 100% relative accuracy. A detailed breakdown of each site class showed that CpGs recovered with the addition of non-HiFi reads, namely C-sites and O-sites, retained high relative accuracy to H-sites, at ~98% and ~89%, respectively (combined, ~96%) (Supplementary Fig. 10). This confirms that the additional sites underlying the MeLoDe-HC and MeLoDe-HCO gains are detected with high accuracy rather than introduced as low-quality calls. At 25× DNA template coverage (~15× HiFi reads), predictions from all MeLoDe modes converged, showing no significant differences in either the number of CpG sites with 5mC estimates or prediction accuracy (Fig. 2b). Hence, we chose MeLoDe-HCO as the default mode for MeLoDe, considering that adding non-HiFi reads trades a small accuracy cost for a large completeness gain. Additional metrics for this benchmarking assessment are provided in Supplementary Figs. 11-12. Explicitly, we showed that the model-based prediction improves accuracy by 17.8%-46.6% over count-based prediction across depths (Supplementary Fig. 11e).
Next, we characterized MeLoDe's performance across genomic contexts, including gene-related regions (CDS, 3′ UTR, intron, and intergenic regions) and CpG-related regions (CpG islands, CpG shores, CpG shelves, and open sea). Regarding the recovered CpG sites, MeLoDe-HCO consistently recovered more than MeLoDe-HC in every tested region: quantified as (HCO-HC)/HC × 100%, the gain averaged 84.5±2.7%, 23.0±2.4%, and 9.6±1.9% (mean ± standard deviation across regions) at depths of 5×, 8×, and 10×, respectively, and progressively diminished with increasing sequencing depth (Supplementary Fig. 13). Given that GC-rich CpG islands are covered at reduced depth in short-read WGBS ground-truth data (median ~6×), the accuracy benchmarking focused on the seven regions with robust WGBS coverage (median >21×): CDS, 3′ UTR, intron, intergenic regions, CpG shores, CpG shelves, and open sea. Across these contexts, MeLoDe-HCO retained CCCs of 96.1±0.03% and 97.9±0.01% relative to MeLoDe-H and MeLoDe-HC, respectively at depths of 5×, 8×, and 10×; and the same qualitative ordering (MeLoDe-HCO ≥ MeLoDe-HC ≥ MeLoDe-H in callable CpG counts, with MeLoDe-HCO retaining >95% accuracy of MeLoDe-HC and >90% accuracy of MeLoDe-H) held in every region rather than only on genome-wide average (Supplementary Fig. 14). Similar trends were observed using metrics of PCC and MAE (Supplementary Fig. 15). MeLoDe prediction accuracy is higher where neighbouring-CpG correlation is strong (e.g., CpG shores and CDS regions) and lower where it is weak, as reflected by the distance weights (Supplementary Fig. 14c); accordingly, a distance weight threshold of 0.70 (corresponding to roughly 625-1,836 bp between the focal CpG and its neighboring sites) is recommended for prioritization (Supplementary Fig. 16). We confirmed known biological patterns. For example, the predicted values for each individual methylome exhibited a bimodal distribution (Supplementary Fig. 17); and the known methylation changes in functional regions were also recapitulated (Supplementary Fig. 18), including reduced methylation level in promoters (marked by histone modification of H3K4me3[26]) and enhancers (marked by H3K27ac), and high-methylation status in heterochromatin (marked by H3K9me3) and actively transcribed gene bodies (marked by H3K36me3). Collectively, these results demonstrate the capability of MeLoDe—and more specifically MeLoDe-HC and MeLoDe-HCO—to accurately reconstruct a more complete 5mC methylome from low-depth LRS data compared to HiFi-only approaches.
Compared to existing HiFi-only tools (pb-CpG-tools and ccsmeth), MeLoDe-H consistently achieved slightly higher accuracy, with site-level CCCs outperforming both by ~5%, while detecting a slightly smaller number of CpG sites due to its more stringent quality control (Supplementary Fig. 19). Using public high-depth HiFi reads from cancer cell lines, we showed that the HiFi-only prediction accuracy increased from 5× to 40× and plateaued at ~40× (Supplementary Fig. 20). In cross-platform comparisons between PacBio and ONT, ONT-based methylation predictions consistently yielded higher accuracy than PacBio, with a marginal advantage of 7.8±1.0% as measured by CCC (Supplementary Fig. 21). In terms of computational efficiency, MeLoDe runs on CPU clusters, outperforming ccsmeth in speed by 15-fold at the read-level and 6.2-fold at the site-level, while its site-level speed is comparable to pb-CpG-tools (Supplementary Table 5).
Applying MeLoDe to cohort-level LRS data
To demonstrate MeLoDe's utility in real-world, cohort-level studies with low-depth LRS, we applied it to 100 individuals (8.6× LRS data, 17× short-read WGS, and 17× short-read WGBS) from the 1KCP cohort for DNAm detection and subsequent meQTL mapping analysis (Methods). We first applied MeLoDe to detect DNAm from LRS data and used GATK[27] to identify SNPs from short-read WGS data, retaining 4.81 million common SNPs after quality control. Then, we performed cis-meQTL mapping (±1 Mb) using QTLtools[28] with sex, age, and the top five genetic principal components as covariates[29]. The prediction accuracy for 5mC at CpG sites was assessed in four sample subsets with high-depth WGBS data (65× coverage), and ground-truth meQTL associations were identified in all 100 individuals using CpGs derived from their 17× WGBS data.
When incorporating both HiFi and non-HiFi reads, MeLoDe-HCO and MeLoDe-HC detected 23.6±0.8 million and 18.7±1.7 million CpG sites with 5mC estimates per individual, 3.5-fold and 2.5-fold more sites than those detected by MeLoDe-H, respectively (mean ± standard deviation) (Fig. 3a). The per-individual CCC for MeLoDe-HCO and MeLoDe-HC was 98% and 99% relative to that of MeLoDe-H (Fig. 3b). At the cohort level, MeLoDe-HCO detected 26.3 million CpG sites (present in ≥1 individual) with a 10.0%±12.5% inter-individual missing rate, and all measured rates were positive (Fig. 3c-d). MeLoDe-HC identified a comparable number of CpG sites (26.2 million) but with a higher missing rate of 29.0±16.0%. In contrast, MeLoDe-H detected 25.5 million CpG sites with substantially higher missingness (81.0±11.7%).
Application of MeLoDe for meQTL mapping study in a low-depth LRS cohort. a, Number of CpG sites detected per individual. b, Per-individual prediction accuracy, measured by the concordance correlation coefficient (CCC), against high-depth WGBS. c, Total number of unique CpG sites detected across the cohort (present in ≥1 individual). d, Inter-individual missing rate for detected CpG sites. e, Number of significant cis-meQTLs detected. CpG quality control filter is set to retain CpGs with a missingness rate below 0.9. f, Number of unique CpG sites with an associated meQTL (mCpGs). g, Precision of detected meQTLs, calculated against a ground-truth identified from WGBS-derived CpGs. h, Precision of detected mCpGs.
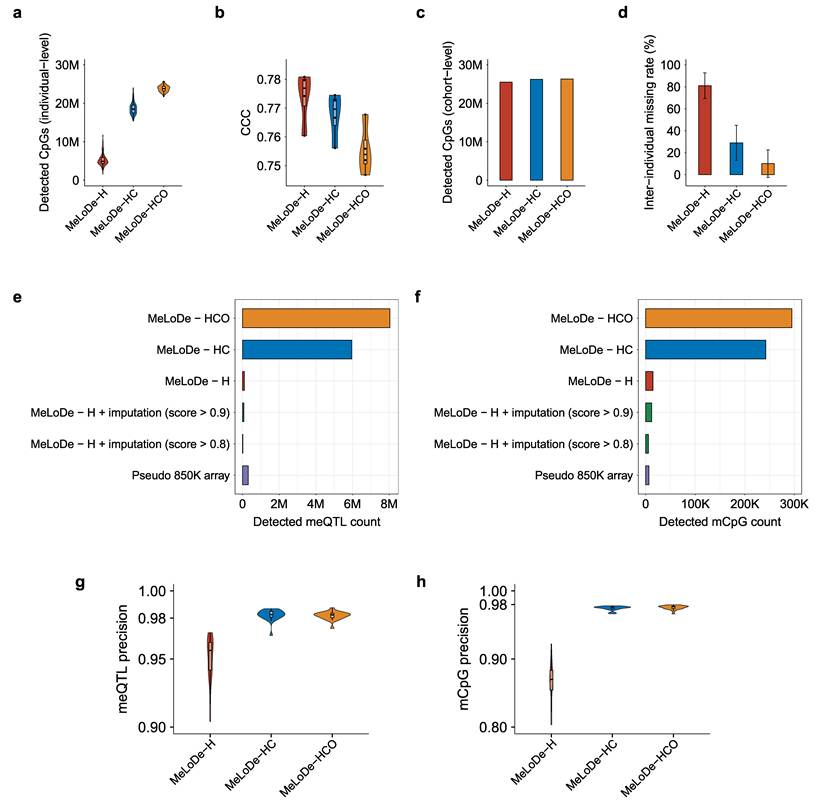
The high missingness rates in the MeLoDe-H calls would typically lead to the exclusion of a large fraction of CpG sites if a commonly used missingness filter (e.g., 10%) is applied in a standard meQTL analysis, severely constraining its statistical power for discovery (Supplementary Fig. 22; Supplementary Table 6). To allow for a fair comparison, we performed cis-meQTL mapping for all three MeLoDe modes with a much looser CpG missingness filter of 90% and benchmarked the results against those derived from WGBS data (the ground truth). This analysis revealed that MeLoDe-HCO and MeLoDe-HC discovered 8.0 million and 6.0 million meQTLs associated with 295K and 242K unique CpG sites, which were 81-fold and 60-fold more meQTLs, respectively, than MeLoDe-H (Fig. 3e; Supplementary Table 6). Despite this substantial increase in discovery power, precision remained high for MeLoDe-HCO (98.2%) and MeLoDe-HC (98.3%) (Fig. 3g). Similarly, the number of unique CpG sites involved in these associations was 20-fold and 16-fold greater for MeLoDe-HCO and MeLoDe-HC, respectively, with precision for detecting true sites exceeding 97.5% across chromosomes (Fig. 3h). Crucially, the meQTL effect size estimates from all MeLoDe modes were highly concordant with the ground truth, showing Pearson correlation coefficients (PCC) of 0.99 (Supplementary Fig. 23). In addition, MeLoDe-derived mCpGs exhibited regulatory element enrichment patterns that are in high concordance with those from WGBS (PCC = 0.96, P = 2.0 × 10⁻¹⁰; Supplementary Fig. 24), confirming that MeLoDe faithfully recapitulates WGBS-based methylation signals. Separately, we performed cis-meQTL mapping for the pooled C- and O-sites, which yielded approximately 1.9 million significant cis-meQTLs (P < 5×10⁻⁸), with the fraction of these sites harbouring at least one meQTL (0.51%), ~4-fold higher than that of H-sites (0.12%; 99.6K significant cis-meQTLs) (Supplementary Table 7). Because methylation arising from artifacts would not be expected to associate with local genotypes, this genetic concordance provides orthogonal evidence that the CpG sites recovered from non-HiFi reads represent genuine biological signals rather than technical noise.
Considering the power differences due to missingness, we performed imputation on the MeLoDe-H calls using METHimpute[30], followed by cis-meQTL mapping (Methods). With the imputed MeLoDe-H data, we identified 0.02 million meQTLs (5.4K mCpGs) at an imputation score threshold of >0.8, and 0.07 million meQTLs (12.0K mCpGs) at >0.9. Using the more confident MeLoDe-H + imputation (score >0.9) set as the denominator, the numbers of identified meQTLs and mCpGs were approximately 118-fold and 25-fold lower, respectively, than those identified using MeLoDe-HCO (Supplementary Table 6). Finally, we compared the MeLoDe-HCO results with array-based results, generating a pseudo-850K array dataset from the WGBS data by extracting CpG sites present on the Infinium MethylationEPIC v2.0 BeadChip. Using this pseudo-850K array dataset, 0.31 million meQTLs associated with 6.6K unique CpG sites were identified, which were 26-fold and 45-fold lower, respectively, then the numbers of meQTLs and mCpGs detected by MeLoDe-HCO (Fig. 3e-f). We acknowledge that the accuracy of this pseudo-array is likely lower than that of an actual array due to the limited coverage of the source WGBS data. Therefore, the performance of a physical array would likely exceed the results presented here. Nevertheless, MeLoDe-HCO detected 8.0 million meQTLs associated with 288K unique CpG sites that are not present on the 850K array. All these results demonstrate that population-scale low-depth LRS analysis greatly benefits from MeLoDe's integration of both HiFi and non-HiFi reads.
Discussion
Long-read sequencing enables the simultaneous detection of DNA nucleotide sequences and epigenetic modifications on the same molecule. Emerging population-scale LRS applications are often conducted at reduced sequencing depths to balance budgetary constraints with cohort size[14, 31]. We have presented MeLoDe, a method for predicting DNAm from low-depth LRS data. Unlike existing approaches that rely exclusively on HiFi reads, MeLoDe incorporates data from both HiFi and non-HiFi reads. MeLoDe's models are trained and tuned at both the read and site levels. We demonstrated that by including both HiFi and non-HiFi data, MeLoDe recovered markedly more CpG sites with methylation estimates than HiFi-only approaches. At the cohort level, this resulted in reduced missingness, enabling the identification of orders of magnitude more meQTLs and mCpGs compared to the HiFi-only approach.
The key innovation of MeLoDe is its integration of HiFi and non-HiFi reads. Our analysis shows that incorporating non-HiFi reads substantially increases the number of detectable CpG sites by rescuing sites with insufficient HiFi support, including C-sites and O-sites. Although non-HiFi reads have lower per-read accuracy than HiFi reads, the WGBS-trained site-level model leverages read-type-specific inputs and correlation among neighboring CpGs[32] to still produce reasonably accurate methylation calls, yielding significant improvement in model-based prediction over noisy count-based prediction. This gain in CpG methylome completeness, however, is accompanied by a modest trade-off in the prediction accuracy, primarily at O-sites (~89% of H-site accuracy). This trade-off is most favourable at low sequencing depth, where the CpG completeness is limiting when HiFi reads alone are used; at higher depths, the three modes converge and HiFi-only calling is sufficient. We therefore recommend MeLoDe-HC/HCO for low-depth cohort designs and provide mode selection guidance in Supplementary Table 8, together with optional distance weight filtering (≥0.7) for accuracy-critical applications. While the latest PacBio platforms prioritize HiFi reads for accuracy and streamlined data management, our findings highlight the value of retaining non-HiFi data. This full data spectrum preserves flexibility for advanced LRS applications and enables cost-effective experimental designs. Furthermore, MeLoDe's computational efficiency on standard CPU clusters allows for seamless integration into data analysis pipelines. As a rule of thumb, processing HiFi reads requires approximately 30 GB of memory for parallelism with 10 threads. For the larger subreads dataset, allocating 30-50 GB per 10 threads is advisable to ensure stability.
In population-scale application of MeLoDe for meQTL mapping using the low-depth 1KCP cohort, we observed that the identified mCpGs were preferentially enriched in regulatory elements of heterochromatin (Het), quiescent/low-signal regions (Quies), and zinc-finger genes and repeats (ZNF/Rpts), while depleted in others, including promoters[33] and enhancers[34]. While these enrichment patterns were reproducible in major blood cell types, including neutrophils and monocytes, caution is warranted in interpreting these results owing to the limited sample size of the study cohort (N=100). Accordingly, further studies with whole-genome CpG profiling in larger cohorts will be necessary to enable base-pair-resolution meQTL/mCpG mapping and to substantiate these functional enrichments, particularly given the inherent constraints of current array-based approaches[12, 35-37], which are limited to 450k or 850k preselected sites. MeLoDe's utility extends beyond meQTL analysis to diverse epigenomic topics, including molecular diagnosis of imprinting disorders[38], identification of haplotype-specific differentially methylated regions (hDMRs) (Supplementary Fig. 25), methylome-wide association studies, investigation of DNAm regulation by structural variation[39-43], and cell-type deconvolution[11]. Finally, we noted that since cancer long-read datasets are frequently generated at high HiFi depth for somatic variant calling[44, 45], HiFi-only methylation calling is generally sufficient in that setting, whereas MeLoDe's recovery of non-HiFi reads provides its greatest advantage under low-depth designs.
Nevertheless, MeLoDe has limitations. First, it focuses on 5mC at CpG dinucleotides and cannot identify other modifications, such as 5hmC or 6mA in DNA, or m6A in RNA[46, 47]. A major challenge is obtaining unbiased, fully modified, and fully unmodified training data across all sequence contexts. For example, while EcoGII Methyltransferase[48] can modify adenine residues, its conversion rate is limited. Secondly, read-level models trained on fully methylated and unmethylated controls provide a sound practical foundation for 5mCpG detection. However, overlapping kinetic signals from closely located CpGs within the 21-mer measurement window (focal CpG±10 bp) may confound the read-level calls. This is a field-wide constraint stemming from the technical inability to generate training data that capture the full combinatorial diversity of multiple CpGs in the window (e.g., for a 2-CpG window, the four possible methylation status combinations are 11, 10, 01, and 00). Future progress in generating such training data may enable systematic evaluation and mitigation of this secondary issue. Thirdly, as MeLoDe was trained and tested on human blood tissues and cell lines, its applicability to other tissues and species may require further evaluation. The kinetic signals, being intrinsic to polymerase chemistry, are expected to be stable and universal, so the read-level model should generalize without retraining. However, given the tissue-specific nature of CpG methylation, our current model—though robust due to diverse training contexts (e.g., c-CpG, v-CpG)—may fall short for unseen tissues. For such cases, we recommend generating high-depth WGBS data from the target tissue to serve as ground truth for tailored site-level model re-training.
In summary, MeLoDe is a robust and efficient method for detecting 5mC DNA methylation from low-depth long-read sequencing data. Its ability to leverage the full spectrum of sequencing reads makes it a valuable tool for large-scale epigenetic studies.
Methods
Read-level model construction
The read-level model was developed to predict 5mC methylation probabilities at CpG site located on sequencing reads. Its inputs include DNA polymerase kinetic signals of inter-pulse duration (IPD) and pulse width (PW), along with the nucleotide sequences flanking a CpG site. To accommodate different read types, we trained variations of the model using either HiFi reads or non-HiFi reads (subreads) as input, with separate models in double-strand and single-strand resolution.
Read-level model input feature
For each CpG site, we extracted IPD(fi, ri, ip tags), PW(fp, rp, pw tags) and DNA sequence of the flanking nucleotides from the alignment (BAM) file. When using subreads, we first derived the consensus nucleotides of the DNA template and then calculated the averaged kinetic signals. To account for scale differences, IPD and PW values were normalized to z-scores, and DNA nucleotides were one-hot encoded. These features were organized into a matrix, where each row represents a feature, and each column corresponds to a base pair position in the 5ʹ→3ʹ orientation, centered on the target CpG (Fig. 1b). The ground-truth labels were 1 for fully-methylated CpG sites and 0 for fully-unmethylated CpG sites.
Read-level model structure
The read-level model was constructed using a Convolutional Neural Network (CNN) framework. Model hyperparameters were optimized using the BayesianOptimization function in the TensorFlow Keras API (section 1 of Supplementary Note). The final model uses a 21-mer window (spanning the focal CpG±10 bp). The CNN architecture comprises five sequential 1D convolutional layers (Conv1D), each containing 256 filters with a kernel size of 5. These layers are followed by a BatchNormalization layer, a Dropout layer (rate = 0.2), and a MaxPooling1D layer. The pooled outputs are flattened and concatenated with the subread count of the DNA template. This combined tensor is passed through three fully connected (Dense) layers (128, 32, and 1 units), where the first two layers use ReLU (Rectified Linear Unit) activation, and the final layer employs a sigmoid activation function to output a probability between 0 and 1.
Read-level model tuning
We tuned the read-level model by training specialized variations for HiFi, non-HiFi-C, and non-HiFi-O reads to maximize CpG detection across all read types (section 1 of Supplementary Note). The model for HiFi data was trained using features extracted directly from consensus HiFi reads. In contrast, models for non-HiFi data were trained using features summarized from subreads that were derived from both HiFi and non-HiFi templates (Supplementary Fig. 5). The input feature matrices also differed: the non-HiFi-C model incorporated information from both forward and reverse strands, whereas the non-HiFi-O model used only single-strand data. In summary, the tuned read-level models achieved AUC scores of 0.96 for HiFi reads, 0.79 for non-HiFi-C reads, and 0.66 for non-HiFi-O reads.
Site-level model construction
The site-level model was designed to predict 5mC methylation frequency by jointly modelling a target CpG site and its neighbours. Each CpG site was encoded by binned read-level 5mC probabilities from mapped reads. The model was tuned to incorporate both HiFi and non-HiFi reads, enabling reliable DNAm predictions for low-depth LRS data.
CpG encoding
The site-level model encoded each CpG site using read-level 5mC probabilities. First, these probabilities were organized into three read-type-specific vectors: HiFi, non-HiFi-Closed, and non-HiFi-Open. Next, the probabilities within each vector were discretized into 10 equal-width bins (0.0-1.0 in 0.1 increments) to form histogram distributions, which were then L²-normalized. Finally, the three normalized vectors were concatenated into a 30-dimensional feature vector, representing the CpG's methylation profile. In this encoding, sequencing depth is implicitly captured by the read-type-specific histograms: low-depth sites yield sparse distributions, whereas high-depth sites yield denser, more reliable ones, so the encoding itself conveys the confidence associated with a site's depth of coverage. To ensure the site-level model interprets this signal correctly across the range of coverages encountered in low-depth data, we trained it on data merged from multiple sequencing depths (3×-20×), exposing it to both sparse and dense encodings; the resulting model is robust across depths (Supplementary Fig. 6b).
Site-level model input feature
The input for a focal CpG site was a positionally ordered feature matrix constructed by concatenating the 30-dimensional encodings for the focal site and its 10 surrounding CpG sites (five upstream and five downstream, in 5ʹ→3ʹ orientation). We appended two additional rows to this 30×11 matrix: one for count-based methylation predictions for each CpG and another for the distance weights of each neighboring CpG to the focal site, forming a final 32×11 feature matrix. The ground-truth label was the focal CpG's methylation frequency determined from WGBS data (QC: coverage >10×). The distance weight is calculated as:

where  is the genomic position of the i-th CpG site, and
 is the position of the focal CpG site.
Site-level model structure
The site-level model was constructed using a CNN. Hyperparameters were optimized using the BayesianOptimization function (section 2 of Supplementary Note). The final model jointly models a focal CpG and its 10 neighbours (±5 CpGs). The model consisted of two Conv1D layers, each with 96 filters and a kernel size of 4. These were followed by a BatchNormalization layer, a Dropout layer (rate = 0.3), and a MaxPooling1D layer. The pooled outputs were flattened and processed through four fully connected (Dense) layers with 30, 10, 10, and 1 unit, respectively. The first three Dense layers used ReLU activation, while the final layer used linear activation to predict methylation frequencies.
Site-level model tuning
CpG sites were classified into three non-overlapping categories, using a coverage threshold of 4 as an example:
- H-sites: ≥4× coverage from HiFi reads
- C-sites: <4× HiFi coverage & (HiFi + non-HiFi-C coverage) ≥4×
- O-sites: <4× HiFi coverage & (HiFi + non-HiFi-C coverage) <4×, and (HiFi + non-HiFi-C + non-HiFi-O coverage) ≥4×
We tuned the site-level models to determine the optimal read types used for H-, C-, and O-sites (section 2 of Supplementary Note). In summary, for H-sites, models using HiFi reads alone achieved the highest accuracy, and including non-HiFi reads increased the prediction accuracy for C-sites and O-sites.
Training samples
Primary EBV-transformed lymphoblastoid B-cell lines (B-LCL) of HG02080 (Southeast Asian), HG01109 (admixed American), HG02723 (African), and HG005 (East Asian) were purchased from the Coriell Institute and cultured according to their protocols[4] at Westlake University. Approximately 30 μg of high-molecular weight genomic DNA was extracted using the CTAB method. For each cell line, 150 ng of the untreated DNA was used as a template for whole genome amplification using QIAGEN REPLI-g UltraFast Mini Kit (Catalog No.: 150033), coupled with a positive control experiment using REPLI-g Human Control (Catalog No.: 150090) templates, and a negative control experiment using nuclease-free water, resulting in 15 μg amplicon products. The average fragment size of these amplicons was 10 kb. The amplified DNA products were divided into two equal amounts. One aliquot underwent CpG Methyltransferase (M.SssI, Thermo Fisher Catalog No.: EM0821) treatment to serve as a fully-methylated sample. The other aliquot remained unmodified and served as a fully-unmethylated sample. Prior to PacBio SMRT sequencing, methylation profiling using the Infinium MethylationEPIC v2.0 BeadChip was conducted to confirm the methylation status for these samples. Simultaneously, an additional 15 μg of untreated DNA from each cell line was prepared for PacBio SMRT sequencing and whole genome bisulfite sequencing. In addition, HG002 datasets, including M.SssI-treated, WGA-amplified and wild-type untreated HiFi data with WGBS profiling, were downloaded and used in the model training. The site-level models were trained on untreated DNA from the above cell lines, as well as blood samples with matched high-depth WGBS as ground truth. Cohort-scale fine-tuning of the site-level model used the 110 1KCP individuals with matched WGBS.
Model training process
Both the read-level and site-level models were trained using the TensorFlow Keras API in Python. The training dataset was split into a 90% training subset and a 10% validation subset. The training subset was shuffled at the start of each epoch, while the validation set remained unchanged. Model performance was evaluated on the validation set after each epoch to monitor generalization and detect overfitting. An early stopping criterion was implemented: training halted if the validation loss did not improve for 10 consecutive epochs, with a maximum of 100 epochs. The loss functions were binary cross entropy for the read-level model and mean absolute error for the site-level model.
Assessment metrics
The read-level model's binary classification performance was quantified using AUC and accuracy. The site-level model's performance was evaluated by the number of detected CpG sites and the concordance correlation coefficient (CCC), which measures both correlation and mean offset between predictions and WGBS ground-truth values. Relative accuracy was defined as the ratio of the CCC for MeLoDe-HC (or MeLoDe-HCO, or certain sites category) to the CCC of H-sites; it quantifies how well non-HiFi-rescued sites perform relative to high-confidence HiFi-only sites, and is distinct from absolute concordance with WGBS (measured directly by the CCC). In all cases, the testing samples were independent of the training process. Default QC criteria in MeLoDe include read-level mapping quality filter ≥ 30 and a site-level read depth filter ≥ 4×. The R package pROC[49] and epiR[50] were used to calculate these metrics.
PacBio SMRT sequencing
DNA samples were sheared using the Diagenode Megaruptor 2. Fragments shorter than 2 kb were removed. SMRT bell libraries were prepared using the SMRTbell prep kit 2.0 (Pacific Biosciences, 100-938-900) following the manufacturer's protocol (101-693-800). Sequencing was performed on a Sequel II (101-447-000) or Sequel IIe (101-986-400) system using the Sequel II Sequencing Kit 2.0 with 30-hour movies per SMRT cell. On average, each SMRT cell produced ~360 GB of subreads. Kinetic signals were decoded from the movie during primary base calling. The average subread length was approximately 20 kb. No additional minimum-length cutoff was applied to subreads prior to downstream bioinformatic data analysis; a mapping quality threshold of ≥30 was applied before feature extraction in MeLoDe. Untreated DNA samples from HG02080, HG01109, HG02723, and HG005 each consumed two SMRT cells to yield approximately 25× HiFi coverage. M.SssI-treated and WGA samples each consumed one SMRT cell. The pbccs software[8] from PacBio was used to generate HiFi reads from subreads.
Whole genome bisulfite sequencing
For the untreated samples, 15 μg of DNA from HG02080, HG01109, and HG02723 cell lines were fragmented by sonication, followed by end-repair and 3' adenylation. Fragments of 450-550 bp were purified, and bisulfite conversion was conducted using the EZ-96 DNA Methylation-Lightning Kit (Zymo Research, D5032) to create a library suitable for NGS sequencing. The quantity of the library was determined by KAPA Library Quantification Kits. Paired-end sequencing (150 bp) was performed on an Illumina NovaSeq 6000 platform. Bismark[51] v0.23.0 was used to align short reads to GRCh38. Duplicates were then removed from the raw alignment files, followed by methylation frequency quantification using bismark_methylation_extractor. WGBS profiles for HG005 and HG002 B-LCLs were downloaded from the EpiQC project[52].
Comparison with other methods
We compared MeLoDe's performance to available methods, including HKModel[23], ccsmeth[17] and pbjasmine+pb-CpG-tools from PacBio[19, 22]. To ensure a fair comparison, models for each software (where possible) were retrained and evaluated using the same datasets as MeLoDe. Note that pbjasmine and pb-CpG-tools do not support model retraining, so we used their default models. HKModel was excluded from the site-level model comparison as it uses a count-based method. We used ZMWfilter[2] from PacBio to create benchmarking datasets with depths ranging from 5× to 25× template molecule coverage from the high-depth SMRT data. The QC cut-off was 4× HiFi reads. ONT data of a public cell line sample of HG02080 from T2T Diversity Panel[53], including both the FAST5 files (time series signal data) and FASTQ files (base called sequence reads) were firstly downloaded. ONT read-level 5mC methylation status was determined by Dorado software using base calling model of dna_r9.4.1_e8_hac@v3.3, since these data were generated using Flow Cell R9.4.1. The software of modkit was used to get the CpG site-level prediction. We down-sampled the raw ONT reads data to create datasets that are approximately the same depth as PacBio data (in the unit of ZMW).
Methylation QTL mapping
We obtained data from 110 individuals from the 1KCP project. These data included short-read WGS (17× coverage), short-read WGBS (17× coverage), and whole-genome PacBio SMRT LRS (8.6× template molecule coverage). Ten individuals were also sequenced with high-depth PacBio LRS (30× HiFi), four of whom also had high-depth WGBS data (65×). SNPs were called using the GATK workflow[27]. CpG methylation was profiled using the LRS data using MeLoDe (≥4× coverage) and from the WGBS data (≥5× coverage), both applying a mapping quality threshold of 30. We conducted meQTL mapping in a subset of 100 individuals not used in model training. QTLtools[28] cis module was used for cis-meQTL mapping (±1 Mb window). The following quality control filters were applied: 1) for CpGs: an inter-individual missingness rate of < 0.1 for standard meQTL mapping and <0.9 for a loose-threshold comparison; 2) for SNPs: minor allele frequency > 0.05, individual's genotype missingness rate < 0.1, and Hardy-Weinberg Equilibrium (HWE) P-value > 0.00001. Sex, age, and the top five genetic principal components were included as covariates[29]. We did not include sequencing depth and batch as covariates given their consistency across samples. METHimpute[30] was used to impute missing CpGs for the MeLoDe-H callset. We applied a P-value threshold of 5e-8 to identify significant meQTL mapping as in prior work[35, 36].
Supplementary Material
Supplementary figures and tables.

Acknowledgements
We thank F. Cheng, W. Bai, X. Sun, and T. Qi for their valuable comments on the manuscript and insightful discussions. We thank P. Jiang from the Department of Chemical Pathology at CUHK for his assistance in running the HKModel and data sharing. We thank the Westlake University High-Performance Computing Center for computational support. This research was supported by the National Natural Science Foundation of China (U23A20165 and 32595482), the National Key R&D Program of China (2024YFC3405800, 2024YFC3405802), the "Pioneer" and "Leading Goose" R&D Program of Zhejiang (2024SSYS0032 and 2025C01092), and the New Cornerstone Science Foundation. AI tools, including DeepSeek and ChatGPT, were used to improve language clarity. The authors reviewed all edits and take full responsibility for the content.
Author contributions
J.Y. conceived and supervised the study. Y.C. developed the method with input from S.S., S.C., L.S., and J.Y. Y.C., W.Y., and X.L. developed the software tool. Y.C. performed the data analysis with assistance from S.S., S.C., Y.W., L.S., and Z.D. Y.C., F.X., W.J., and Z.D. contributed to generating the training data. Y.C. and J.Y. wrote the first draft of the manuscript. All authors reviewed and approved the final manuscript.
Competing Interests
Y.C., S.S., W.Y., S.C., L.S., Z.D., Y.W., X.L. and J.Y. are listed as co-inventors of a granted Chinese patent (no. ZL202410142197.6) related to the method described in this manuscript. The other authors declare no competing interests.
References
1. Logsdon GA, Vollger MR, Eichler EE. Long-read human genome sequencing and its applications. Nature Reviews Genetics. 2020
2. Wenger AM, Peluso P, Rowell WJ, Chang P-C, Hall RJ, Concepcion GT. et al. Accurate circular consensus long-read sequencing improves variant detection and assembly of a human genome. Nature Biotechnology. 2019;37:1155-62
3. Beyter D, Ingimundardottir H, Oddsson A, Eggertsson HP, Bjornsson E, Jonsson H. et al. Long-read sequencing of 3,622 Icelanders provides insight into the role of structural variants in human diseases and other traits. Nature Genetics. 2021
4. Nurk S, Koren S, Rhie A, Rautiainen M, Bzikadze AV, Mikheenko A. et al. The complete sequence of a human genome. Science. 2022;376:44-53
5. Glinos DA, Garborcauskas G, Hoffman P, Ehsan N, Jiang L, Gokden A. et al. Transcriptome variation in human tissues revealed by long-read sequencing. Nature. 2022;608:353-9
6. Elrick H, Sauer CM, Espejo Valle-Inclan J, Trevers K, Tanguy M, Zumalave S. et al. SAVANA: reliable analysis of somatic structural variants and copy number aberrations using long-read sequencing. Nature Methods. 2025
7. Rand AC, Jain M, Eizenga JM, Musselman-Brown A, Olsen HE, Akeson M. et al. Mapping DNA methylation with high-throughput nanopore sequencing. Nature Methods. 2017;14:411-3
8. Flusberg BA, Webster DR, Lee JH, Travers KJ, Olivares EC, Clark TA. et al. Direct detection of DNA methylation during single-molecule, real-time sequencing. Nature Methods. 2010;7:461-5
9. Fu Y, Timp W, Sedlazeck FJ. Computational analysis of DNA methylation from long-read sequencing. Nature Reviews Genetics. 2025
10. Robertson KD. DNA methylation and human disease. Nature Reviews Genetics. 2005;6:597-610
11. Loyfer N, Magenheim J, Peretz A, Cann G, Bredno J, Klochendler A. et al. A DNA methylation atlas of normal human cell types. Nature. 2023;613:355-64
12. Oliva M, Demanelis K, Lu Y, Chernoff M, Jasmine F, Ahsan H. et al. DNA methylation QTL mapping across diverse human tissues provides molecular links between genetic variation and complex traits. Nature Genetics. 2022
13. Mattei AL, Bailly N, Meissner A. DNA methylation: a historical perspective. Trends in Genetics. 2022;38:676-707
14. De Coster W, Weissensteiner MH, Sedlazeck FJ. Towards population-scale long-read sequencing. Nature Reviews Genetics. 2021
15. Mahmoud M, Huang Y, Garimella K, Audano PA, Wan W, Prasad N. et al. Utility of long-read sequencing for All of Us. Nature Communications. 2024;15:837
16. Eid J, Fehr A, Gray J, Luong K, Lyle J, Otto G. et al. Real-Time DNA Sequencing from Single Polymerase Molecules. Science. 2009;323:133-8
17. Ni P, Nie F, Zhong Z, Xu J, Huang N, Zhang J. et al. DNA 5-methylcytosine detection and methylation phasing using PacBio circular consensus sequencing. Nature Communications. 2023;14:4054
18. Simpson JT, Workman RE, Zuzarte PC, David M, Dursi LJ, Timp W. Detecting DNA cytosine methylation using nanopore sequencing. Nature Methods. 2017;14:407-10
19. Biosciences P. PacificBiosciences/jasmine: Predict 5mC in PacBio HiFi reads. 2024.
20. Liu T, Conesa A. Profiling the epigenome using long-read sequencing. Nature Genetics. 2025;57:27-41
21. Suzuki Y, Korlach J, Turner SW, Tsukahara T, Taniguchi J, Qu W. et al. AgIn: measuring the landscape of CpG methylation of individual repetitive elements. Bioinformatics. 2016;32:2911-9
22. Biosciences P. PacificBiosciences/pb-CpG-tools: Collection of tools for the analysis of CpG data. 2024.
23. Tse OYO, Jiang P, Cheng SH, Peng W, Shang H, Wong J. et al. Genome-wide detection of cytosine methylation by single molecule real-time sequencing. Proceedings of the National Academy of Sciences. 2021;118:e2019768118
24. Liao W-W, Asri M, Ebler J, Doerr D, Haukness M, Hickey G. et al. A draft human pangenome reference. Nature. 2023;617:312-24
25. Wang Y, Duan Z, Chen D, Shi D, Ding Y, Wang Z. et al. The 1000 Chinese Pangenome empowers medical and population genetics. Nature. 2026
26. Abascal F, Acosta R, Addleman NJ, Adrian J, Afzal V, Ai R. et al. Expanded encyclopaedias of DNA elements in the human and mouse genomes. Nature. 2020;583:699-710
27. DePristo MA, Banks E, Poplin R, Garimella KV, Maguire JR, Hartl C. et al. A framework for variation discovery and genotyping using next-generation DNA sequencing data. Nat Genet. 2011;43:491-8
28. Delaneau O, Ongen H, Brown AA, Fort A, Panousis NI, Dermitzakis ET. A complete tool set for molecular QTL discovery and analysis. Nature Communications. 2017;8:15452
29. Purcell S, Neale B, Todd-Brown K, Thomas L, Ferreira MAR, Bender D. et al. PLINK: A Tool Set for Whole-Genome Association and Population-Based Linkage Analyses. The American Journal of Human Genetics. 2007;81:559-75
30. Taudt A, Roquis D, Vidalis A, Wardenaar R, Johannes F, Colomé-Tatché M. METHimpute: imputation-guided construction of complete methylomes from WGBS data. BMC Genomics. 2018;19:444
31. O'Neill K, Pleasance E, Fan J, Akbari V, Chang G, Dixon K. et al. Long-read sequencing of an advanced cancer cohort resolves rearrangements, unravels haplotypes, and reveals methylation landscapes. Cell Genomics. 2024 4
32. Wu H, Xu T, Feng H, Chen L, Li B, Yao B. et al. Detection of differentially methylated regions from whole-genome bisulfite sequencing data without replicates. Nucleic Acids Research. 2015;43:e141-e
33. Huan T, Joehanes R, Song C, Peng F, Guo Y, Mendelson M. et al. Genome-wide identification of DNA methylation QTLs in whole blood highlights pathways for cardiovascular disease. Nature Communications. 2019;10:4267
34. McClay JL, Shabalin AA, Dozmorov MG, Adkins DE, Kumar G, Nerella S. et al. High density methylation QTL analysis in human blood via next-generation sequencing of the methylated genomic DNA fraction. Genome Biology. 2015;16:291
35. Peng Q, Liu X, Li W, Jing H, Li J, Gao X. et al. Analysis of blood methylation quantitative trait loci in East Asians reveals ancestry-specific impacts on complex traits. Nature Genetics. 2024
36. Min JL, Hemani G, Hannon E, Dekkers KF, Castillo-Fernandez J, Luijk R. et al. Genomic and phenotypic insights from an atlas of genetic effects on DNA methylation. Nature Genetics. 2021;53:1311-21
37. Shang L, Zhao W, Wang YZ, Li Z, Choi JJ, Kho M. et al. meQTL mapping in the GENOA study reveals genetic determinants of DNA methylation in African Americans. Nature Communications. 2023;14:2711
38. Rosenski J, Peretz A, Magenheim J, Loyfer N, Shemer R, Glaser B. et al. Atlas of imprinted and allele-specific DNA methylation in the human body. Nature Communications. 2025;16:2141
39. Ebler J, Ebert P, Clarke WE, Rausch T, Audano PA, Houwaart T. et al. Pangenome-based genome inference allows efficient and accurate genotyping across a wide spectrum of variant classes. Nature Genetics. 2022;54:518-25
40. Cristian G, Bing G, Warren C, Tomi P, Guillaume B. Expanded methylome and quantitative trait loci detection by long-read profiling of personal DNA. bioRxiv. 2024. 2024 03.17.585420
41. Technologies ON. Oxford Nanopore Announces Landmark UK Government Partnership to Advance Genomics-Driven Healthcare Innovation in the UK. 2024.
42. Stefansson OA, Sigurpalsdottir BD, Rognvaldsson S, Halldorsson GH, Juliusson K, Sveinbjornsson G. et al. The correlation between CpG methylation and gene expression is driven by sequence variants. Nature Genetics. 2024
43. Wahl S, Drong A, Lehne B, Loh M, Scott WR, Kunze S. et al. Epigenome-wide association study of body mass index, and the adverse outcomes of adiposity. Nature. 2017;541:81-6
44. Wagner J, Keskus AG, Oshima KK, Ranallo-Benavidez TR, McDaniel J, Sikic M. et al. A complete human pancreatic cancer genome. bioRxiv. 2026. 2026 05. 01.722316
45. Garg S. Towards routine chromosome-scale haplotype-resolved reconstruction in cancer genomics. Nature Communications. 2023;14:1358
46. Kong Y, Mead EA, Fang G. Navigating the pitfalls of mapping DNA and RNA modifications. Nature Reviews Genetics. 2023
47. Zhu S, Beaulaurier J, Deikus G, Wu TP, Strahl M, Hao Z. et al. Mapping and characterizing N6-methyladenine in eukaryotic genomes using single-molecule real-time sequencing. Genome Research. 2018;28:1067-78
48. Murray IA, Morgan RD, Luyten Y, Fomenkov A, Corrêa IR Jr, Dai N. et al. The non-specific adenine DNA methyltransferase M.EcoGII. Nucleic Acids Research. 2018;46:840-8
49. Robin X, Turck N, Hainard A, Tiberti N, Lisacek F, Sanchez J-C. et al. pROC: an open-source package for R and S+ to analyze and compare ROC curves. BMC Bioinformatics. 2011;12:77
50. Stevenson M, Stevenson MM, BiasedUrn I. Package 'epiR'. Tools for the analysis of epidemiological data R package version 09-62. 2015
51. Krueger F, Andrews SR. Bismark: a flexible aligner and methylation caller for Bisulfite-Seq applications. Bioinformatics. 2011;27:1571-2
52. Foox J, Nordlund J, Lalancette C, Gong T, Lacey M, Lent S. et al. The SEQC2 epigenomics quality control (EpiQC) study. Genome Biology. 2021;22:332
53. Gershman A, Sauria MEG, Guitart X, Vollger MR, Hook PW, Hoyt SJ. et al. Epigenetic patterns in a complete human genome. Science. 2022;376:eabj5089
Author contact
Corresponding author: Jian Yang <jian.yangedu.cn>.