Impact Factor ISSN: 1449-2288
- Issue 12; 2026
- Issue 11; 2026
- Issue 10; 2026
- Issue 9; 2026
- Issue 8; 2026
- Volume 22; 2026
- Past Issues
- Advance Articles
- Editorial Board
- Cover Images
- Index & Coverage
- Cover Suggestion
- Special Issues
Introduction
Materials and Methods
Results
Discussion
Supplementary Material
Acknowledgements
References

 Global reach, higher impact
Int J Biol Sci 2026; 22(7):3769-3787. doi:10.7150/ijbs.125552 This issue Cite
Research Paper
OSBPL10 Drives Lipophagy-Mediated Lipid Mobilization to Promote Pancreatic Ductal Adenocarcinoma Progression
Zonghao Duan1,2,3,4†, Xueshiyu Ma1,4†, Feng Yu1†, Junfeng Zhang1†, Rong Hua1, Wei Liu1, Dejun Liu1, Jianyu Yang1, Xueliang Fu1, Minwei Yang1, Hongfei Yao4,5, Shuheng Jiang4, Lipeng Hu4, Musitaba Mutailifu4, Xiaomei Yang4 ![]() , Yongwei Sun1
, Yongwei Sun1 ![]() , Linli Yao6,4
, Linli Yao6,4 ![]() , Yanmiao Huo1
, Yanmiao Huo1 ![]()
1. Department of Biliary-Pancreatic Surgery, Ren Ji Hospital, Shanghai Jiao Tong University School of Medicine, Shanghai, 200127, China.
2. Department of General Surgery, Pancreatic Disease Center, Research Institute of Pancreatic Diseases, Ruijin Hospital, Shanghai Jiao Tong University School of Medicine, Shanghai, 200025, China.
3. Shanghai Key Laboratory of Pancreatic Neoplasms Translational Research, Research Institute of Pancreatic Disease, Shanghai Jiao Tong University School of Medicine, Shanghai, China.
4. State Key Laboratory of Systems Medicine for Cancer, Shanghai Cancer Institute, Ren Ji Hospital, School of Medicine, Shanghai Jiao Tong University, Shanghai, 200240, China.
5. Department of Hepato-Biliary-Pancreatic Surgery, Huadong Hospital Affiliated to Fudan University, Shanghai, 200040, China.
6. Shanghai Key Laboratory of Cancer Systems Regulation and Clinical Translation, Jiading District Central Hospital Affiliated Shanghai University of Medicine & Health Science, Shanghai, 201800, China.
†These authors contributed equally to this work.
Received 2025-9-20; Accepted 2026-3-12; Published 2026-3-25
Abstract

Pancreatic ductal adenocarcinoma (PDAC) is an aggressive malignancy with a poor prognosis, in which the role of lipophagy, a selective autophagic process degrading lipid droplets (LDs), remains poorly characterized. This study investigated lipophagy and its key regulator, OSBPL10, in PDAC progression. Through immunofluorescence analysis of patient samples, transgenic mouse tissues, and cell lines, we find that lipophagy is elevated in PDAC and correlates with poor prognosis. Single-cell transcriptomic analysis identified OSBPL10 as a critical lipophagy regulator and an independent clinicopathological indicator. Functional assays, including orthotopic and subcutaneous xenografts, demonstrated that OSBPL10 promotes tumor growth. Mechanistically, OSBPL10 functionally cooperates with VAPA/VAPB to facilitate rapid lysosomal repair via ATG2A, thereby promoting lipophagy and lipid mobilization. Inhibition of lysosomal function abrogated the pro-lipophagic and pro-tumorigenic effects of OSBPL10. Collectively, our findings demonstrate that upregulated OSBPL10 drives PDAC progression by enhancing lipophagy through ATG2A-mediated rapid lysosomal repair, highlighting OSBPL10 as a potential therapeutic target in PDAC.
Keywords: PDAC, lipophagy, rapid lysosomal repair, lipid metabolism, autophagy
Introduction
Metabolic reprogramming is a hallmark of cancer, contributing significantly to tumorigenesis by providing essential nutrients for tumor cell proliferation [1, 2]. Tumor cells often possess altered metabolic pathways, which supports key aspects of malignancy, including proliferation, migration, and invasion [3]. LDs, cellular organelles that are central to lipid metabolism, are also involved in this metabolic shift [4]. Traditionally, LDs serve as intracellular depots for triacylglycerols (TGs) and sterol esters in most mammalian cells. However, in tumor cells, LDs undergo mobilization and utilization in a more dynamic and unorthodox manner to support aggressive tumor growth. Lipids are released and utilized to fuel critical biological processes, such as providing energy for cancer cells, contributing to chemoresistance, and supporting invasive and migratory behavior [5, 6]. Therefore, the mobilization and utilization of LDs are integral to the metabolic reprogramming that underpins cancer progression.
While lipolysis has long been recognized as a key process in lipid metabolism, in which free fatty acids are rapidly deployed for energy through β-oxidation, lipophagy is being gradually focused on [7]. Lipophagy is a form of selective autophagy that degrades intracellular LDs via lysosomal action, which has drawn increasing attention for its role in modulating lipid storage [8]. Recent studies have highlighted the complexity of lipophagy, with both chaperone-mediated lipophagy and macroautophagy observed in specific contexts. Unlike lipolysis, which typically breaks down LDs into free fatty acids, lipophagy appears to act as an upstream regulator, breaking down large LDs into smaller vesicles, thus facilitating more efficient lipid turnover and supporting rapid tumor cell metabolism [9, 10]. This suggests that lipophagy plays an essential role in maintaining lipid homeostasis in cancer cells by regulating the availability of lipid-derived nutrients required for tumor progression.
The oxysterol-binding protein-like 8 (OSBPL8), also known as ORP8, has been implicated as a receptor for lipophagy. It belongs to the oxysterol-binding protein (OSBP) family, which plays a pivotal role in intracellular lipid trafficking and signal transduction between organelles [8]. Another study by Chen et al. also unveiled the mechanism of lipophagy and fatty acid β-oxidation in acetaminophen-induced hepatotoxicity in mice [11]. Moreover, a recent study by Kang et al. displayed methods to evaluate lipophagy and integrated the autophagy-dependent and -independent lipophagy in yeast, providing further evidence for this intriguing phenomenon [12]. However, with such attention to lipophagy, its occurrence and effect in cancers, especially in PDAC, have yet to be explored.
Pancreatic cancer, a deadly malignant tumor, is universally acknowledged as a “silent killer” to suffering patients due to its insidious onset to early-stage detection and high mortality rate [13, 14]. As the incidence is gradually increasing by 1% per year, pancreatic cancer currently leads third place in the United States and the seventh in the world in terms of cancer death, drawing much more attention nowadays. PDAC accounts for about 90% of pancreatic cancer, and as the cancer type with the highest degree of malignancy, PDAC is also known for its poor sensitivity to multiple treatments [5, 15, 16]. Hence, the intense need to discover the reason of the high recurrence and mortality rates of PDAC is a necessity, which requires a deeper understanding of its malignant features [17]. Tumor cells need an enormous amount of metabolites to support the need for proliferation to meet the need for its fast progression, and it has already been reported that one of the key enzymes of fatty acid biosynthesis, FASN, is upregulated and plays a pivotal role in PDAC progression [18]. Moreover, synthesis-related enzymes such as ACLY also proved to be significant in PDAC cells [19].
Oxysterol binding protein like 10 (OSBPL10), as well as OSBPL8, is also part of the oxysterol-binding protein family, a group of pivotal transporters of signals between organelles and molecules [8]. The particular family also participates in the regulation of the actin cytoskeleton, cell polarity, and cell itself [20]. In a recent study, Tan et al. revealed a basilic role of OSBPL10 in anchoring damaged lysosomes onto the endoplasmic reticulum and therefore facilitating their quick repair [21]. Based on previous studies of reprogrammed lipid metabolism in PDAC, we speculated that there might be a potential mechanism for tumor cells to quickly mobilize intracellular lipids due to their urgent need for proliferation and migration and provide flexibility to tumor cells to adjust according to its nutrition level at their microenvironment no matter high or low [22, 23].
Here, we demonstrate that OSBPL10 regulates lipophagy in PDAC both in vitro and in vivo, and its expression is positively correlated with poor clinical outcomes in PDAC patients. Furthermore, we elucidate the mechanism by which OSBPL10 promotes PDAC progression by enhancing of rapid lysosomal repair and lipid mobilization, thereby supporting the tumor aggressive growth.
Materials and Methods
Cell culture and reagents
The human PDAC cell lines SW1990, PANC-1, Patu8988, Capan-1, and other cell lines were purchased from the Cell Bank of the Chinese Academy of Sciences (Shanghai, China), and the murine PDAC cell line KPC1199 was maintained at Shanghai Cancer Institute, Ren Ji Hospital, School of Medicine, Shanghai Jiao Tong University. All cells were cultured in Dulbecco's modified Eagle's medium (DMEM) or Roswell Park Memorial Institute 1640 medium with 10% FBS and 1% penicillin/streptomycin (P/S) at 37°C in a humidified incubator with 5% CO2, according to the suggestions of American Type Culture Collection (ATCC) protocols.
PDAC transgenic model, orthotopic xenograft model and subcutaneous xenograft model
All procedures were conducted in compliance with the approved protocol (A2020108) from the Research Ethics Committee of Shanghai Jiao Tong University. The mouse studies were conducted in compliance with the National Institutes of Health Guide for the Care and Use of Laboratory Animals. Experimental groups were assigned using stratified randomization based on the body weights of the animals.
The PDAC transgenic mouse model was established by crossing Pdx1-Cre mice with lox-stop-lox-KrasG12D/+ and lox-stop-lox-Trp53R172H/+ mice (KPC) to better elucidate the process of PDAC carcinogenesis. Pancreatic intraepithelial neoplasia (PanIN) lesions were generated in a cohort of lox-stop-lox-KrasG12D/+ and Pdx1-Cre (KC) mice [24]. Pancreatic tissues from KPC mice were collected once tumors became palpable. KC mice were sacrificed at 18 and 36 weeks of age for the collection of early and late PanIN lesions, respectively.
For the orthotopic xenograft model, 1.5 × 10⁶ Osbpl10KD KPC1199luc cells in 20 μL were transplanted into the pancreas of mice. The corresponding negative control cells were also transplanted in parallel to observe tumor growth. All mice were injected with D-luciferin and imaged for bioluminescence imaging under 2.5% isoflurane inhalation anesthesia. Mice were sacrificed 4 weeks post-implantation, and the tumor tissues were collected, fixed in 4% Paraformaldehyde Fix Solution (4% PFS), weighed, and photographed.
For the subcutaneous xenograft model, 2.0 × 10⁶ OSBPL10OE Patu8988 cells and the same number of cells of negative control were resuspended in 50μL PBS, and the suspension was injected subcutaneously into the backs of the mice, therefore to better demonstrate the discrepancy between the study groups and the control group. Chloroquine (CQ, HY-B1370, MedChemExpress, China) was administered intraperitoneally to the treatment group at a dose of 60mg/kg each day. Tumor volume was measured using calipers and calculated according to the following formula: (length × width2) /2. After the 3-week period, subcutaneous tumors were collected and weighed, and the sections were prepared for further use.
Tissue microarray (TMA) construction
Tissue microarrays were constructed from clinical samples obtained from 149 pairs of PDAC tumor and adjacent normal tissues collected from patients undergoing surgery at Ren Ji Hospital, School of Medicine, Shanghai Jiao Tong University. Written informed consent was obtained from all patients, and the study was approved by the Research Ethics Committee of Ren Ji Hospital (RA-2019-116). Follow-up data were recorded from the date of surgery until cancer-related death.
Bioinformatic analysis
The raw expression matrix for the single-cell transcriptomic analysis was obtained from the Genome Sequence Archive (GSA) database, accessible at https://bigd.big.ac.cn/gsa, using accession number CRA001160 and GSE212966 [25, 26]. For example, in CRA001160, a total of 22 PDAC tumor samples (T) and nine control pancreatic samples (N) were collected for further analysis. A list of LMGs was compiled from the "metabolism of lipids" pathway in Reactome. The data was imported into the R (v 4.4.1) package Seurat for further analysis, and each sample was individually filtered to remove cells and genes. Next, mitochondrial, ribosomal, and hemoglobin genes were excluded from the datasets. Ultimately, 33,162 cells and 33,408 genes were retained for further analysis. We applied Harmony to adjust for batch effects across the datasets. The top 2,000 most variable genes were selected using the FindVariableFeatures function in the Seurat package, utilizing the default parameters. Principal component analysis was conducted on the highly variable genes following Z-score normalization. Finally, uniform manifold approximation and projection (UMAP) dimensionality reduction was performed using the top 18 significant principal components (PCs) [27, 28]. Clusters were established using the FindClusters function, with a resolution parameter of 0.1. Marker genes for each cluster were identified using the Seurat FindMarkers function, selecting those with a fold change greater than 2. The clusters were annotated to known cell types based on the marker genes using CellMarker 2.0 and PanglaoDB. The expression levels of SLA4A4, ANXA4, and CFTR were utilized to identify ductal cells. Given that tumor cells in PDAC originate from ductal tissue, we initially explored the differences in tumor cells between tumor samples (T) tissues and control pancreatic samples (N) tissues by examining the gene expression profiles within the ductal cell population. To better characterize the malignant state of ductal cell subpopulations, we analyzed the single-cell copy number variation (CNV) profiles in ductal cells using inferCNV, with ductal cells in control pancreatic samples (N) serving as the reference.
Immunohistochemistry of paraffin-embedded tissues (IHC-P)
Immunohistochemistry for paraffin-embedded sections (IHC-P) was performed as previously described. For IHC-P analysis of xenograft tumors and pancreatic tissues from KPC and KC mice generated in our laboratory, specimens were fixed in 4% PFS, embedded in paraffin, and subjected to IHC staining. Tumor tissues were evaluated based on the intensity of cytoplasmic staining (0 = no staining, 1 = weak staining, 2 = moderate staining, and 3 = strong staining) of OSBPL10 and the percentage of stained area (0 = 0-5%, 1 = 6-35%, 2 = 36-70%, and 3 = 71-100%). Final scores were calculated by multiplying these two values, with the following classifications: “negative” for a score of 0-1, “weak” for a score of 2-4, “moderate” for a score of 4-6, and “positive” for a score of 7-9 [29]. The scores were collected for the analysis of univariate, multivariate and Kaplan-Meier analyses etc. to better evaluate the effect of OSBPL10 expression on clinical features and patient lesions.
Quantitative real-time polymerase chain reaction (qRT-PCR)
Total RNA was extracted from cells using Trizol reagent (Sharebio, Shanghai) according to the manufacturer's instructions. The cDNA synthesis was carried out with the PrimeScript RT Reagent Kit (Takara, Japan), following the provided protocol. qRT-PCR was performed using SYBR Premix Ex Taq (Sharebio, Shanghai) on a 7500 Real-Time PCR system (Applied Biosystems, USA) under the recommended thermal cycling conditions. The relative mRNA expression levels were determined using the 2-ΔΔCt method and normalized to 18S RNA levels. The primer sequences for the target genes are listed in Supplementary Table S1.
Immunoblotting
Total protein was extracted from cells using RIPA Lysis and Extraction Buffer (89901, Thermo Fisher Scientific, USA) and quantified with a bicinchoninic acid (BCA) Protein Assay Kit (SB-WB013, ShareBio, China). The extracted proteins were separated by sodium dodecyl sulfate-polyacrylamide gel electrophoresis (SDS-PAGE, 20315ES20, YEASEN, China) and transferred onto nitrocellulose membranes. The membranes were blocked with 2% FBS and then incubated overnight at 4 °C with primary antibodies (Supplementary Table S2). Afterward, the membranes were incubated with species-specific secondary antibodies (Supplementary Table S2) for 1 hour at room temperature. Immunoreactive bands were detected using chemiluminescence (BioRad Laboratories, CA, USA).
Small interfering RNA (siRNA) and cDNA transduction
For the transduction with small interfering RNA (siRNA), Lipofectamine RNAiMAX (#13778150, Thermo Scientific, USA) was used to transiently transfect PDAC cell lines with siRNA and cDNA achieve specific gene knockdown and expression rescue. After 48 hours of transfection, the PDAC cells were collected for qRT-PCR or immunoblotting to evaluate transduction efficiency or for additional assays using the jetPRIME transfection reagent (Polyplus, France). The sequences of cDNA of ATG2A are provided in Supplementary Information 2. The sequences of siRNAs utilized in this study are as follows: si-ATG2A-1, sense, 5'-GACACUGCGGUUGCACAAA(dT)(dT)-3', antisense, 5'-UUUGUGCAACCGCAGUGUC(dT)(dT)-3', and si-ATG2A-2, sense, 5'-CCUUCACUCUCUCCAGCAA(dT)(dT)-3', antisense, 5'-UUGCUGGAGAGAGUGAAGG(dT)(dT)-3', si-ATG2A-3, sense, 5'-GCGAGAUUAUGUCUGUGUU(dT)(dT)-3', antisense, 5'-AACACAGACAUAAUCUCGC(dT)(dT)-3'.
Gene knockdown and overexpression assays
Lentiviral vectors for the overexpression of OSBPL10 and the knockdown of Osbpl10 were acquired from OmicsLinkTM Expression Clone (EX-Y4308-Lv137; GeneCopoeia, Inc., Rockville, MD). The vector used for Osbpl10 knockdown assays was WPE-3'LTR-pUC-Amp-5'LTR-RRE-cPPT-U6-shRNA-SV40-Luc2-IRES-Puro. The vector used for OSBPL10 knockdown and overexpression assays was WPE-3'LTR-pUC-Amp-5'LTR-RRE-cPPT-CMV-ORF-3xflag-SV40-IRES-Puro. All the sequences mentioned above were described in the Supplementary Information 1 and 2. For the lentiviral transduction assay, cells were planted and cultured in a 6-well plate. After the plantation, lentiviral suspension was added with the presence of 25 × HiTransG P (Genechem, Shanghai, China) for 48 hours, after which the puromycin was added at a density of 2.5μg/ml for stable PDAC cell lines.
Cell proliferation assays
Cell viability was assessed to demonstrate the proliferation capability of tumor cells, using a Cell Counting Kit-8 (CCK-8, SB-CCK8, Sharebio, China) assay. Cells were seeded into 96-well plates at a density of 2000 cells per well. At days 0, 1, 2, 3, and 4, the cells were incubated with 10 μL of CCK-8 reagent per well for 1 hour, following the manufacturer's instructions. After incubation, absorbance was measured at 450 nm and 600nm using an automatic enzyme-linked immunoassay reader (BioRad Laboratories, CA, USA). Each experiment was conducted in triplicate.
For colony formation assays, cells were plated in six-well plates. After 14 days, the colonies were fixed with 4% PFS and stained with 0.1% crystal violet to demonstrate cell proliferation ability. Photographs were taken, and the colonies were quantified using FIJI [30].
Immunofluorescence assay
For cell immunofluorescence assays, cells were initially plated with a total number of 1 × 10⁶ each well and cultured in a μ-Slide 8-well (ibidi, Gräfelfing, Germany) for 12 hour. Cells were permeabilized with 0.1% saponin in PBS, blocked with 5% FBS in PBS for 1 hour, and incubated overnight at 4 °C with primary antibodies: OSBPL10 (1:100, Proteintech, China), LAMP1 (1:100, Santa Cruz Biotechnology, USA), and ATG2A (1:100, Santa Cruz Biotechnology, USA). After washing, cells were incubated with secondary antibodies for 1 hour at room temperature. Nuclei were stained with DAPI (1:100, Merck Millipore, USA). Lipid droplets (LDs) were stained with BODIPY (1:1000, Beyotime, Shanghai, China).
For tissue immunofluorescence, freshly collected PDAC samples from Ren Ji Hospital, Shanghai Jiao Tong University, were sectioned into 10 µm slices. Sections were fixed with 4% PFA, subjected to heat-mediated antigen retrieval in pH 6.0 sodium citrate buffer, and blocked with 10% BSA in PBS. Primary antibodies were incubated overnight at 4 °C, followed by incubation with fluorescence-conjugated secondary antibodies. Nuclei were stained with DAPI, and immunofluorescence signals were visualized using confocal microscopy (Leica, Germany).
Quantification of BODIPY (intracellularly) and PLIN2 (in tumor tissue sections) was quantified using FIJI, with colocalization levels scored from 0 to 100. High lipophagy was defined as the top 10% of scores, and low lipophagy as the bottom 10%.
Transmission electron microscope (TEM)
For TEM, cells (1 × 10⁶) and fresh tissues were collected and fixed in electron microscopy fixative at 4 °C for 2-4 hours. Samples were washed in 0.1M phosphate buffer, followed, then embedded 1% agarose. After fixation with osmium tetroxide, samples were sequentially dehydrated in ethanol, infiltrated with acetone and embedding medium, and polymerized at 60°C for 48 hours. Thin sections (60-80 nm) were cut using an ultramicrotome and mounted on copper grids. Grids were stained with 2% uranyl acetate and 2.6% lead citrate, and analyzed under a transmission electron microscope.
RNA-sequencing
RNA was extracted from SW1990 cells with OSBPL10 knockdown and the corresponding negative control using RNAiso Plus reagent (Takara Bio, Japan). RNA quality was assessed using a Bioanalyzer (Agilent) and quantified with a NanoDrop spectrophotometer (Thermo Scientific, USA). Only high-quality RNA samples (OD260/280 = 1.8-2.2, RIN ≥ 6.5) were selected for sequencing. RNA sequencing libraries were constructed using the Illumina® Stranded mRNA Prep, Ligation method (Illumina, USA) and sequenced on a NovaSeq 6000 sequencer.
Proteomic analysis
We utilized lysates from Patu8988 cell with exogenous OSBPL10 overexpression from immunoprecipitation for an isobaric tag for relative and absolute quantitation (iTRAQ) proteomic experiment. The samples underwent tissue lysis, protein extraction, BCA quantification, SDS-PAGE electrophoresis, Coomassie Brilliant Blue staining, and enzymatic digestion (300 μg per sample) for preparation. Peptides were labeled with TMT reagents according to the manufacturer's protocol (Thermo Scientific, USA). The fractions were dried and prepared for nano-LC-MS/MS analysis. Peptides from each group were mixed in equal amounts and separated using the Pierce™ High-pH Reversed-Phase Peptide Fractionation Kit (Thermo Scientific, USA). The samples were then combined into 10 fractions, which were dried and redissolved in 0.1% formic acid (FA) for mass spectrometry analysis. Peptides from each sample were subjected to chromatographic separation using the Easy nLC 1200 system (Thermo Scientific, USA) and analyzed by data-dependent acquisition (DDA) mass spectrometry on a Q-Exactive HF-X mass spectrometer (Thermo Scientific, USA). The resulting LC-MS/MS raw files were processed using the Sequest HT search engine in Proteome Discoverer software (Version 2.4, Thermo Scientific, USA) to perform a database search. The UniProt-Homo sapiens (Human) [9606]-202249-210712 database was used for the search, and a false discovery rate (FDR) of ≤ 0.01 was applied for filtering and exclusion.
Co-immunoprecipitation
Cells from two 10cm plates were cultured and harvested using IP lysis buffer containing protease/phosphatase inhibitors. The cell lysates were then sonicated and centrifuged at 4°C. Anti-Flag beads (Selleck, USA) were washed three times with PBST and subsequently incubated with pre-cleared cell lysates at room temperature for 2 hours. The mixture was then washed four times with PBST and eluted with 50 μL of freshly prepared 1× loading buffer, which was heated at 90 °C for 10 minutes before further use. The co-IP experiments were performed to demonstrate the interactions between OSBPL10 and VAPA as well as VAPB.
Untargeted lipidomic liquid-chromatograph mass spectrometry
Lipidomic analysis was conducted to assess metabolic alterations associated with OSBPL10 knockdown. Lipid extraction was performed using a MeOH/MTBE extraction protocol, followed by LC-MS analysis using an ACQUITY™ Premier CSH C18 column. Data were collected in both positive and negative ion modes on a Thermo QE HF-X mass spectrometer.
Statistical analysis
Quantitative data are presented as means ± SEM. Statistical analyses were conducted using SPSS 26.0. Cumulative survival times were calculated using the Kaplan-Meier method and analyzed with the log-rank test. The correlation between OSBPL10 expression and clinical baseline information of PDAC patients in the Ren Ji Cohort was assessed using the χ2 test or Fisher's exact test. Univariate and multivariate Cox regression analyses were performed using the Cox proportional hazards model to identify significant factors affecting patient survival. Continuous variables were compared using a two-tailed Student's t-test or one-way ANOVA. A p-value of < 0.05 was considered statistically significant.
Results
Identification of prognosis-related lipophagy in PDAC and the positive correlation between OSBPL10 and lipophagy
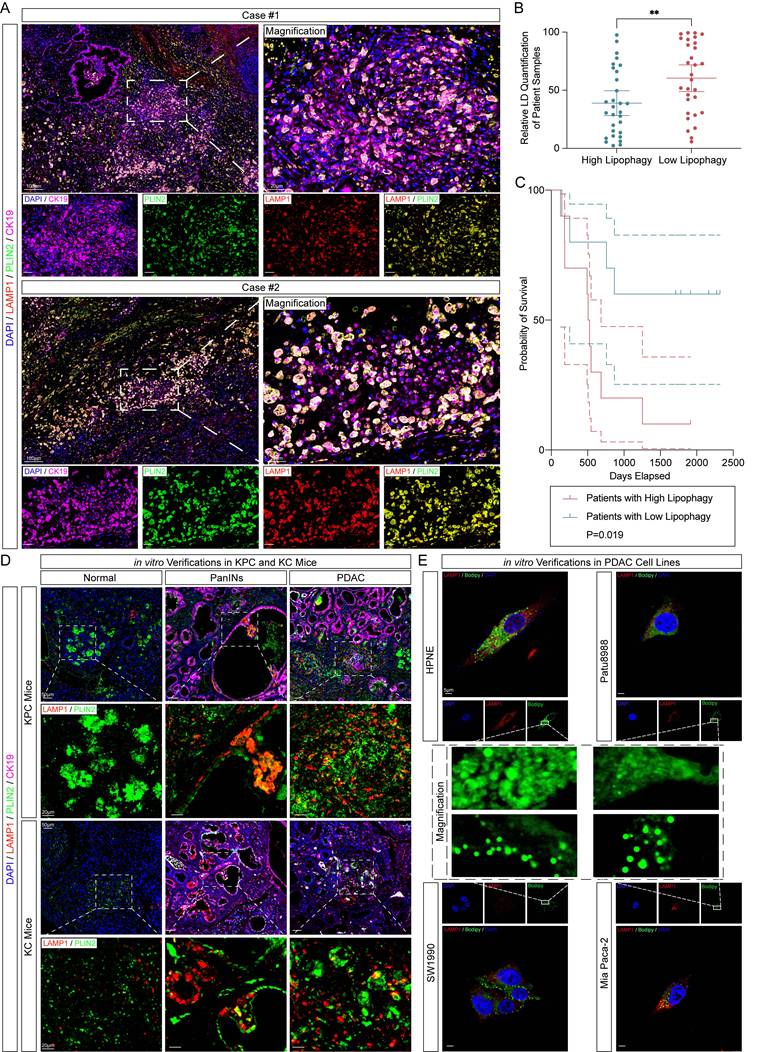
To identify lipophagy in PDAC, we first collected tumor tissues from 20 PDAC patients. Paraffin-embedded sections were subjected to immunofluorescence staining for LC3B (an autophagosome marker), LAMP1 (a lysosome marker), and Perilipin 2 (PLIN2, a lipid droplet marker known for its abundant localization on the lipid droplet membrane and high specificity to LDs). Additionally, TEM observation was performed in freshly collected PDAC samples (Supplementary Fig. 1A-B). Patients were categorized into High (n=10) and Low (n = 10) lipophagy groups based on the median value of the quantified lipophagic activity. The extent of lipophagy was assessed by evaluating the colocalization of LAMP1 and PLIN2 as previously reported [11] (Fig. 1A-B). Kaplan-Meier analysis was then performed using clinical follow-up data and overall survival rates. While The Cancer Genome Atlas (TCGA) data showed no significant correlation between PLIN2 and LAMP1 expression and overall survival in PDAC patients, our cohort revealed that patients with high lipophagy activity had significantly worse prognoses (Fig. 1C, Supplementary Fig. 1C-D). To investigate the relationship between lipophagy activity and PDAC progression, immunofluorescence staining was performed on tumor tissues from KPC and KC mice. These results showed that lipophagy was significantly upregulated in pancreatic intraepithelial neoplasia (PanIN) lesions, with the highest levels observed in PDAC regions (Fig. 1D, Supplementary Fig. 2A). Additionally, immunofluorescence staining and immunoblotting on human PDAC cell lines, compared to the normal pancreatic ductal cell line HPNE, confirmed that lipophagy was markedly elevated in PDAC cells (Fig. 1E, Supplementary Fig. 2B-D).
Identification and verification of lipophagy in vivo and in vitro. A, Representative immunofluorescence images of the tumor tissues of PDAC patients in Ren Ji Hospital (n=20, 3 random fields assessed per sample). Scale bar, 100μm and 20μm. Blue, DAPI; Pink, CK19; Green, PLIN2; Red, LAMP1. B, Relative immunofluorescence quantification of PLIN2 in (A) (n=3, 3 random fields assessed per sample, mean ± SEM.; two-tailed unpaired t test). C, Kaplan-Meier analysis of 20 patients analyzed in (A) and (B) between high and low lipophagy patients. D, Representative immunofluorescence images of KPC and KC mice about the verification of lipophagy (n=5, 3 random fields assessed per sample). Scale bar, 50μm and 20μm. Blue, DAPI; Green, Plin2; Red, Lamp1. E, Representative immunofluorescence images of HPNE and PDAC cell lines (n=3, 3 random fields assessed per sample). Scale bar, 5μm. Blue, DAPI; Green, PLIN2; Red, LAMP1. (**p<0.01).
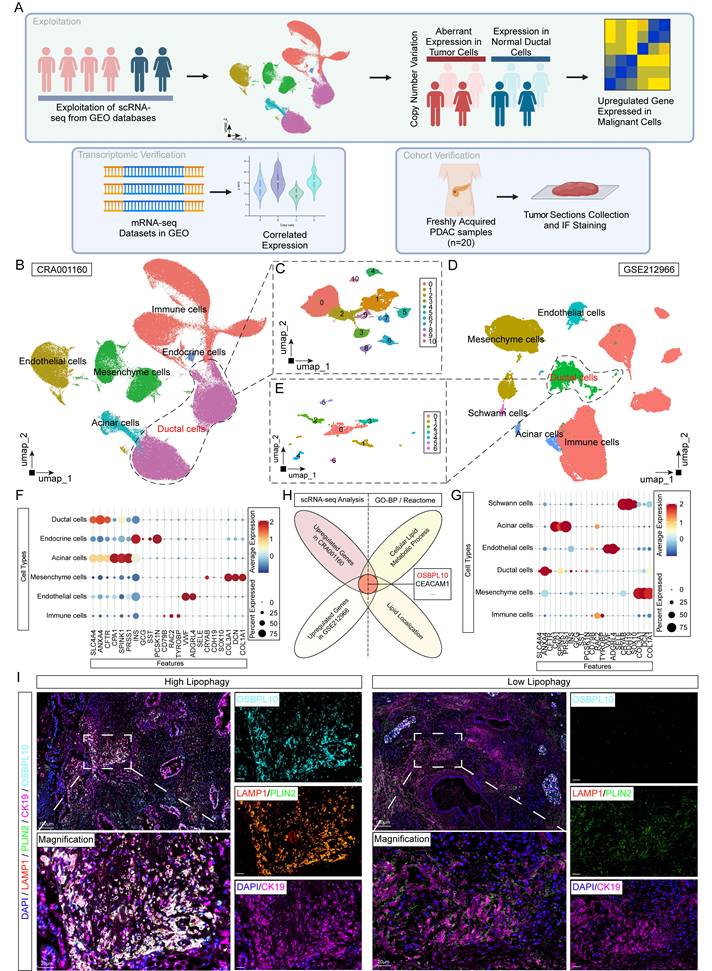
To further identify factors potentially correlated with lipid metabolism and lipophagy, we performed single-cell transcriptome analysis using publicly available databases (Fig. 2A). After quality filtering and batch effect correction using the Harmony algorithm, we identified six distinct clusters: ductal cells, endothelial cells, acinar cells, mesenchymal cells, immune cells, and endocrine cells. We further re-clustered ductal cells into smaller subsets in both datasets (Fig. 2B-E). In the CRA001160 dataset, cluster 1 was significantly enriched in tumor samples (T) compared to control pancreatic samples (N). To assess the functional roles of these clusters, we analyzed the single-cell copy number variation (CNV) profiles of ductal cells (Fig. 2F, G, Supplementary Fig. 3A-D). Focused analysis on the largest ductal clusters revealed OSBPL10 as a key gene associated with lipid metabolism, identified by comparing lipid-related gene sets and lipid localization in Reactome and Gene Ontology (Fig. 2H). To validate this finding, we performed immunofluorescence staining on PDAC tissues from patients with the highest and lowest lipophagy activity, showing that OSBPL10 expression was significantly elevated in regions with high lipophagy (Fig. 2I). Further analysis of OSBPL10 expression in our single-cell dataset and external datasets from TCGA and Gene Expression Omnibus (GEO) robustly confirmed that OSBPL10 was upregulated in PDAC tissues and strongly correlated with lipophagy (Supplementary Fig. 3F-G, Supplementary Fig. 4A-B).
Single cell RNA sequencing data identification of lipophagy crucial indicator OSBPL10. A, Flow chart demonstrating the sorting and verification process of the potential lipophagy factor. B, UMAP of single cells across PDAC tissues and normal pancreas in CRA001160. C, UMAP of single cells in the ductal cells of CRA001160. D, UMAP of single cells across PDAC tissues and normal pancreas in GSE212966. E, UMAP of single cells in the ductal cells of GSE212966. F, Cell clustering according to the corresponding markers of each cell types in CRA001160. G, Cell clustering according to the corresponding markers of each cell types in GSE212966. H, Venn diagram showing the intersections between the upregulated genes in malignant cells from CRA001160, GSE212966 and corresponding gene sets in Gene Ontology and Reactome. I, Representative immunofluorescence images of the tumor tissues of PDAC patients with high and low lipophagy in Ren Ji Hospital (n=3, 3 random fields assessed per sample). Scale bar, 100μm and 20μm. Blue, DAPI; Pink, CK19; Green, PLIN2; Red, LAMP1; Cyan, OSBPL10.
Taken together, these results suggest that high lipophagy activity in PDAC is associated with poor prognosis, and OSBPL10 expression is positively correlated with lipophagy in PDAC.
High OSBPL10 expression enhances lipophagy, thereby promoting PDAC cell proliferation in vitro
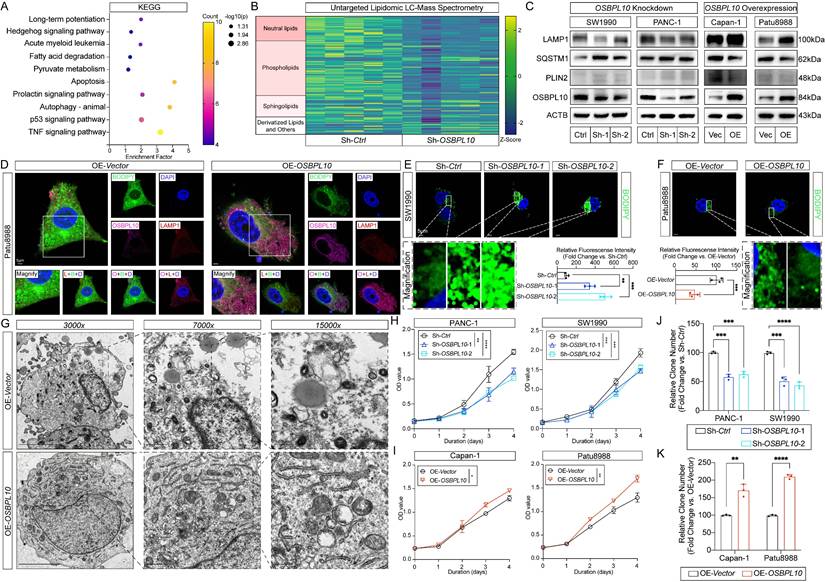
To investigate the role of OSBPL10 in lipophagy in PDAC cells, we first assessed its expression in HPNE and eight PDAC cell lines. Lentiviral-mediated knockdown and overexpression of OSBPL10 were performed in selected PDAC cell lines (Supplementary Fig. 6A-B). Based on endogenous expression levels, PANC-1 and SW1990 cells, with high endogenous OSBPL10 expression, were selected for knockdown, while Capan-1 and Patu8988 cells, with low OSBPL10 expression, were chosen for overexpression (Supplementary Fig. 6C-F). To validate the role of OSBPL10 in lipophagy, transcriptomic sequencing was performed on the OSBPL10 knockdown (OSBPL10KD) SW1990 cell line. KEGG analysis revealed significant downregulation of pathways related to fatty acid degradation and autophagy, while Gene Ontology (GO) analysis indicated that OSBPL10 was localized to the plasma membrane region (Fig. 3A, Supplementary Fig. 5A-B). Additionally, lipidomic analysis using liquid chromatography-mass spectrometry demonstrated that higher OSBPL10 expression was associated with an increase in intracellular neutral lipids, particularly triglycerides, indicating a significant increase in lipid metabolic activity (Fig. 3B, Sup. Fig. 5C-D). Elevated OSBPL10 expression also correlated with upregulation of phospholipids and sphingolipids, providing strong evidence for enhanced intracellular membrane activity (Fig. 3B, Sup. Fig. 5D-E). KEGG analysis further confirmed the enrichment of the autophagy pathway, suggesting that lipophagy was induced by elevated OSBPL10 expression (Supplementary Fig. 5C-E). To verify these findings, we performed qRT-PCR and immunoblotting on both OSBPL10KD and OSBPL10OE cell lines. Consistent with previous results, LAMP1 and SQSTM1 revealed that autophagic activity was upregulated in the OSBPL10OE cells, while PLIN2 expression demonstrated that lipid droplet level was significantly reduced, confirming the role of OSBPL10 in promoting lipophagy (Fig. 3C, Supplementary Fig. 6G-H).
OSBPL10 Expression positively correlates with lipophagy. A, KEGG enrichment analysis of the mRNA-seq results between the control group and OSBPL10KD group. B, Heat map of the lipid LC-MS results between the control group and OSBPL10KD group. C, Immunoblotting of the corresponding indicated markers of lipophagy in both OSBPL10KD and OSBPL10OE cells. D, Representative images of immunofluorescence staining of OSBPL10, LAMP1 and BODIPY in OSBPL10OE cell line (n=5, 3 random fields assessed per sample). Blue, DAPI; Green, BODIPY; Red, LAMP1. Pink, OSBPL10. Scale bar, 5μm. E-F. Representative images of immunofluorescence staining and quantification of BODIPY in OSBPL10KD (E) and OSBPL10OE (F) cell lines (n=3, 3 random fields assessed per sample, mean ± SEM.; two-tailed unpaired t test). Blue, DAPI; Green, BODIPY. Scale bar, 5μm. G, Representative transmission electron microscope images of OSBPL10OE cell line (n=3, 3 random fields assessed per sample), Scale bar, 5μm, 1μm and 0.5μm. H-I, Cell viability of the OSBPL10KD (H) and OSBPL10OE (I) cells. (n = 3, mean ± SEM.; one-way repeated-measures ANOVA). J-K, Quantification of colony formation assays of OSBPL10KD (J) and OSBPL10OE (K) cells (n=3, mean ± SEM.; two-tailed unpaired t test). (*p<0.05, **p<0.01, ***p<0.005, ****p<0.001).
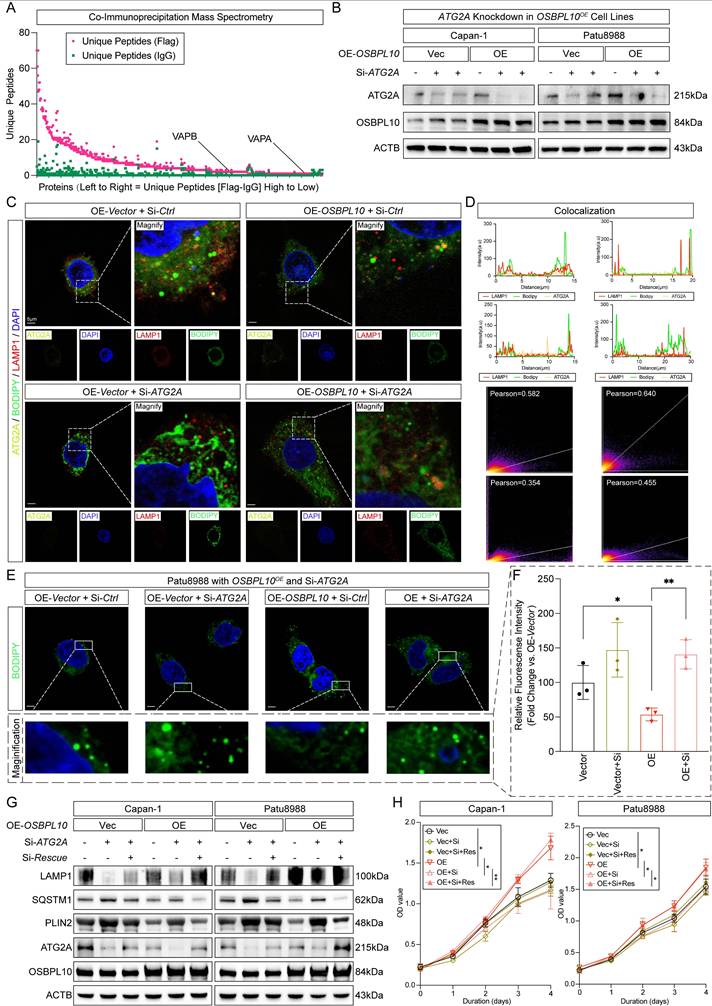
Promoted lipophagy by OSBPL10 expression is facilitated by ATG2A-mediated rapid lysosomal repair. A, The result of the mass spectrometry assay of OSBPL10OE cells from the samples of co-immunoprecipitation assay. B, Immunoblotting demonstrating the knockdown of si-RNA assays of ATG2A in OSBPL10OE cells. C, Representative images of immunofluorescence staining of ATG2A, LAMP1 and BODIPY in OSBPL10OE cell line with si-ATG2A (n=5, 3 random fields assessed per sample). Blue, DAPI; Green, BODIPY; Red, LAMP1. Yellow, ATG2A. Scale bar, 5μm. D, Quantification of the colocalization of LAMP1 and BODIPY, and the correlation analysis between LAMP1 and BODIPY in (C). E. Representative images of immunofluorescence staining of BODIPY in OSBPL10OE cell line with si-ATG2A (n=3, 3 random fields assessed per sample). Blue, DAPI; Green, BODIPY. Scale bar, 5μm. F, Relative quantification of BODIPY in OSBPL10OE cell line with si-ATG2A, n=3, 3 random fields assessed per sample, mean ± SEM.; two-tailed unpaired t test. G, Immunoblotting examining corresponding indicated marker of lipophagy in OSBPL10OE cells with si-ATG2A and ATG2A-cDNA (n = 3, mean ± SEM.; one-way repeated-measures ANOVA). H, Cell viability of the OSBPL10OE cells with si-ATG2A and ATG2A-cDNA (n = 3, mean ± SEM., one-way repeated-measures ANOVA). (*p<0.05, **p<0.01).
Further, we performed immunofluorescence assays on OSBPL10KD and OSBPL10OE cells to examine lipophagy activity. In SW1990 cells with OSBPL10 knockdown, we observed abnormal LD accumulation compared to the control group (Supplementary Fig. 7B-C). In contrast, OSBPL10 overexpression in Patu8988 cells enhanced lipophagy, as evidenced by significantly increased colocalization of LAMP1 with BODIPY (Fig. 3D-F, Supplementary Fig. 7C). Additionally, TEM images of OSBPL10OE Patu8988 cells revealed a significant increase in the number of autophagosomes, while lipid droplet accumulation decreased upon OSBPL10 upregulation (Fig. 3G, Supplementary Fig. 7D). Furthermore, cell proliferation assays demonstrated that high OSBPL10 expression significantly promoted the proliferation of PDAC cells (Fig. 3H-K, Supplementary Fig. 7E).
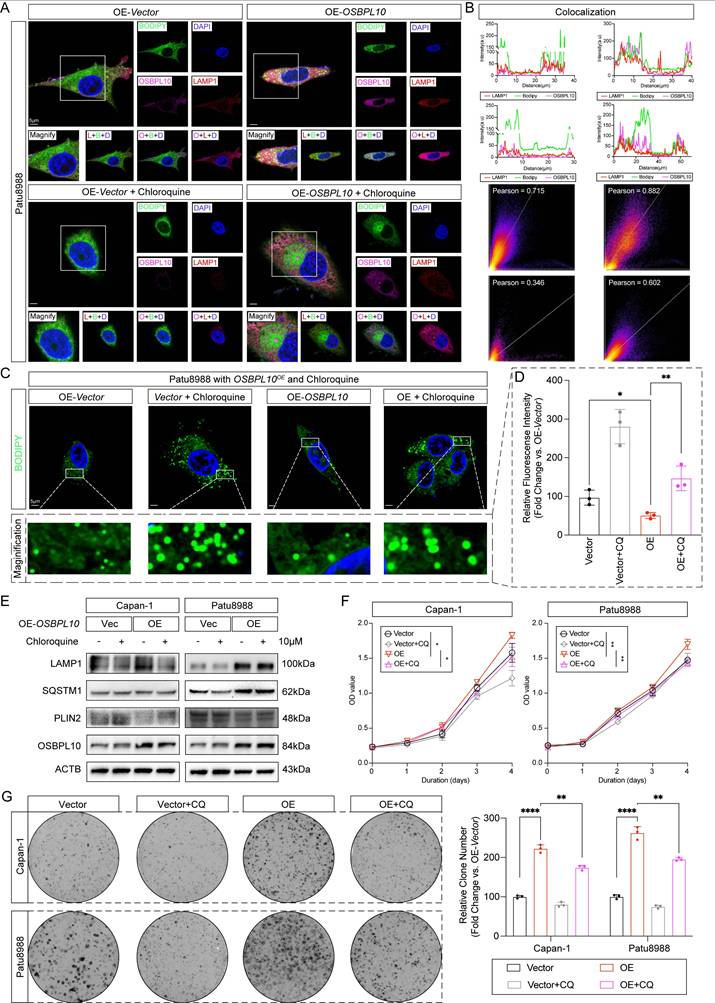
To examine whether autophagy is required for these effects, we inhibited lysosomal function with chloroquine (CQ), a well-established autophagy inhibitor. Immunofluorescence assays showed that CQ treatment caused substantial LD accumulation, reduced LAMP1-BODIPY colocalization, and diminished correlation between LAMP1 and OSBPL10 (Fig. 4A-B). Consistent with these findings, the LD content was significantly increased in the CQ-treated cells, confirming that autophagy inhibition impaired lipophagy (Fig. 4C-D). Immunoblotting further confirmed the decrease in lipophagy markers in CQ-treated cells (Fig. 4E). Additionally, cell proliferation assays demonstrated that CQ treatment significantly attenuated the proliferative effect of OSBPL10 overexpression in both cell lines (Fig. 4F-G).
Upregulated OSBPL10 expression induced lipophagy could be impeded by chloroquine. A, Representative images of immunofluorescence staining of OSBPL10, LAMP1 and BODIPY in OSBPL10OE cell line when treated with 10μM of chloroquine (n=5, 3 random fields assessed per sample). Blue, DAPI; Green, BODIPY; Red, LAMP1. Pink, OSBPL10. Scale bar, 5μm. B, Quantification of the colocalization of LAMP1 and BODIPY, and the correlation analysis between LAMP1 and OSBPL10 in (A). C, Representative images of immunofluorescence staining of BODIPY in OSBPL10OE cell line when treated with chloroquine (n=3, 3 random fields assessed per sample mean ± SEM.; two-tailed unpaired t test). Blue, DAPI; Green, BODIPY. Scale bar, 5μm. D, Relative quantification of BODIPY in OSBPL10OE cell line when treated with 10μM of chloroquine, n=3, 3 random fields assessed per sample, mean ± SEM.; two-tailed unpaired t test. E, Immunoblotting examining corresponding indicated marker of lipophagy in OSBPL10OE cells when treated with 10μM of chloroquine. F, Cell viability of the OSBPL10OE cells when treated with 10μM of chloroquine. (n = 3, mean ± SEM., one-way repeated-measures ANOVA). G, Colony formation assays and related quantification of OSBPL10OE cells when treated with 10μM of chloroquine. (n=3, mean ± SEM.; two-tailed unpaired t test). (*p<0.05, **p<0.01, ***p<0.005, ****p<0.001).
In summary, these findings suggest that OSBPL10 expression promotes lipophagy, which in turn enhances cell proliferation. This effect can be impeded by the disruption of autophagosome function, underscoring the importance of lipophagy in PDAC progression.
OSBPL10 regulates lipophagy in an ATG2A-dependant manner
To elucidate the molecular mechanism by which OSBPL10 promotes lipophagy, we performed mass spectrometry to identify its interacting proteins. This analysis revealed associations with VAPA and VAPB, two proteins previously reported to cooperate functionally with OSBPL10 (Fig. 5A). These interactions were further validated by immunoblotting and were consistent with predictions from the BioGRID and STRING databases (Supplementary Fig. 8A-B). As described in the work of Tan et al., VAPA and VAPB both interacts with members of the OSBP family, including OSBPL10, in order to have the damaged lysosome closer to the ER, therefore proceed the repairing system with the primary involvement of PI4K2A and ATG2A [21]. Given that several genes related to lysosomal functions showed altered expression on account of OSBPL10 knockdown, as well as previous studies by Tan et al. have reported the unique functions that OSBPL10 plays in rapid lysosomal repair, we speculated whether OSBPL10 was involved in the regulation of the lipophagy process, therefore affecting PDAC cell proliferation [21]. First, we verified the study of Tan et.al by using the wild type PDAC cells of Patu8988 and Mia Paca-2 to observe the correlation between OSBPL10 and ATG2A (Supplementary Fig. 8C). As previously reported to be related to intracellular LD morphology and distribution, ATG2A, the effective gene in ATG2 family which was pivotal to rapid lysosomal repair machinery, is known to be associated to the mediating effect of isolation membrane and the ER, moreover, ATG2A facilitates autophagosome assembly, while binding to the ER exit site, the membrane source for autophagosome [31-34]. Hence, according to the former study, we wished to further speculate whether OSBPL10 promote lipophagy by ATG2A and its participation in rapid lysosomal repair [21] (Fig. 5B). Later, we performed immunofluorescence assays on the OSBPL10OE cell lines as well as those with ATG2A knockdown, and we observed an accumulation of LDs, and with ATG2AKD, the colocalization between lysosomes and LDs also showed a reduction, while the lysosome function was barely affected, suggesting that low ATG2A expression significantly impeded elevated lipophagy by high OSBPL10 expression (Fig. 5C-F). For more evidence, immunoblotting and cell proliferation assays were performed and also displayed that lysosome damage and lipophagy were indeed deterred by ATG2A knockdown, while the restoration of ATG2A knockdown have considerably reversed the impairment of rapid lysosomal repair and cell growth, without affecting PI4K2A recruitment [21] (Fig. 5G-H, Supplementary Fig. 8D-E).
Together, these results indicates that the effect of OSBPL10 on lipophagy was modulated by ATG2A-mediated rapid lysosomal repair, which regulated the function of lysosomes, therefore posing an impact on lipophagy.
Tumor growth and intracellular lipophagy are facilitated by OSBPL10 and can be dampened by chloroquine
To further investigate the in vivo role of OSBPL10 in tumor growth and lipophagy, we utilized orthotopic and subcutaneous xenograft models. Osbpl10 expression was knocked down in the KPC1199luc cell line for the orthotopic xenograft model (Fig. 6A-B, Supplementary Fig. 9A). Upon resection, pancreatic tumors were weighed, and tumors from the knockdown group were significantly lighter compared to those from the control group. Mice injected with Osbpl10 knockdown (Osbpl10KD) cells also showed worse overall survival (Fig. 6C). In vivo imaging was used to track tumor growth over time, and the results showed slower tumor progression in the knockdown group compared to the control group (Supplementary Fig. 9B-C). Immunohistochemical analysis of excised tumors showed significantly lower Ki-67 staining and elevated caspase-3 expression in the knockdown group, indicating reduced proliferation and increased apoptosis (Fig. 6D-E, Supplementary Fig. 9D). Additionally, lipophagy markers, as Plin2 and Lamp1, were evaluated, and knockdown of Osbpl10 resulted in a marked reduction in lipophagy activity (Fig. 6F, Supplementary Fig. 9D).
Tumor growth and intracellular lipophagy are facilitated by OSBPL10 and can be dampened by CQ. A. Images taken when PDAC orthotopic xenografts were retrieved from mice. B. Tumor weight in the control group and Osbpl10KD groups. C. Kaplan-Meier analysis of overall survival in the control group and Osbpl10KD groups. D. Representative immunohistochemical staining, HE staining images of tumors from the control group and Osbpl10KD groups with Ki-67 and Plin2 (n=3, 3 fields assessed per sample). Scale bar, 50μm and 20μm. E. Corresponding H-scores of immunohistochemical stainings from (D) (n=3, 3 random fields assessed per sample, mean ± SEM.; two-tailed unpaired t test). F. Images taken when subcutaneous xenografts were retrieved from mice. G. Tumor weight in the control group, OSBPL10OE group and groups treated with CQ. H, Kaplan-Meier analysis of overall survival in the control group, OSBPL10OE group, and groups treated with CQ. I, Representative immunofluorescence assays from the control group, OSBPL10OE group, and groups treated with CQ. (n=3, 3 random fields assessed per sample, mean ± SEM.; two-tailed unpaired t test). Scale bar, 50μm and 20μm. (*p<0.05, **p<0.01, ***p<0.005).
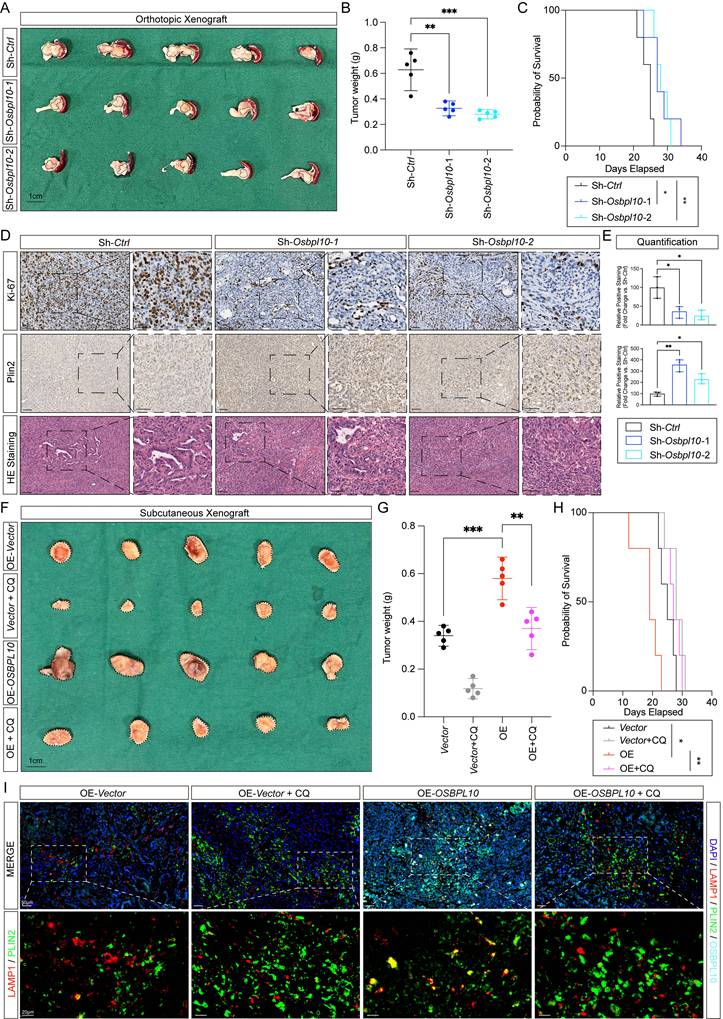
To further explore the effect of OSBPL10 and intracellular lipophagy on PDAC progression, we constructed subcutaneous xenograft models using the OSBPL10OE Patu8988 cell line, with mice receiving intraperitoneal CQ treatment each day at the dosage of 60mg/kg [35, 36]. As expected, overexpression of OSBPL10 led to increased tumor weights, consistent with previous results, and CQ treatment alleviated tumor growth in both control and OSBPL10OE groups. Mice implanted with OSBPL10OE cells showed significant reductions in tumor weights, volumes, and overall survival following CQ treatment (Fig. 6F-H, Supplementary Fig. 9E). To assess lipophagy levels, tumor samples were subjected to immunofluorescence assays. As expected, analysis of the colocalization of LAMP1 and PLIN2 revealed significantly elevated lipophagy in tumors with high OSBPL10 expression. In contrast, lipophagy was notably reduced in tumors treated with CQ (Fig. 6I).
In conclusion, these findings demonstrate a positive correlation between OSBPL10 expression and tumor growth in vivo. They also confirm the critical role of OSBPL10 in regulating lipophagy in PDAC tumor cells. Importantly, CQ treatment, particularly in tumors with high OSBPL10 expression, mitigates tumor growth through the inhibition of lipophagy.
High OSBPL10 expression indicates poor prognosis in PDAC patients
To comprehensively evaluate the expression pattern and clinical relevance of OSBPL10, we first analyzed TCGA data and found that OSBPL10 mRNA levels were upregulated in several malignancies, including ovarian cancer (OV) and acute myeloid leukemia (LAML) (Supplementary Fig. 10A). To further assess its clinical significance in PDAC, we constructed a tissue microarray (TMA) containing tumor and adjacent tissues from 149 patients who underwent surgery at Ren Ji Hospital, Shanghai Jiao Tong University School of Medicine. Intact clinicopathological features were collected were available for 130 patients, and clinical follow-up data for 112 patients. IHC staining of the TMA was evaluated by two independent pathologists, who scored both the distribution and intensity of OSBPL10 expression (Fig. 7A).
OSBPL10 expression is elevated in PDAC and high OSBPL10 expression indicates poor clinical outcome in PDAC patients. A, Representative immunohistochemical scoring images of OSBPL10 expression in 130 pancreatic ductal adenocarcinoma adjacent tissues and matching tumor tissues in the Renji TMA (n=130, 3 fields assessed per sample). Scale bar, 200 μm, and 20 μm. B, Representative immunohistochemical staining images of Osbpl10 expression in KPC mice at different stages of PDAC progression (n=5 samples, 3 fields assessed per sample). PanIN, pancreatic intraepithelial neoplasms. Scale bar, 50 μm and 20 μm. C, Multivariate Cox regression analysis of clinicopathological factors in the Ren Ji TMA. CI, confidence interval. D. Heatmap of OSBPL10 expression distribution in the 4 levels of TNM classification based on the immunohistochemical scoring of the Ren Ji TMA, two-way ANOVA. E, Kaplan-Meier analysis of the correlation between the overall survival rate and the expression of OSBPL10 according to the Ren Ji cohort. F, OSBPL10 staining H-score of adjacent and the matched tumor tissues, two-way ANOVA. Negative (-), weak (+), moderate (++) or positive (+++). (****p<0.001).
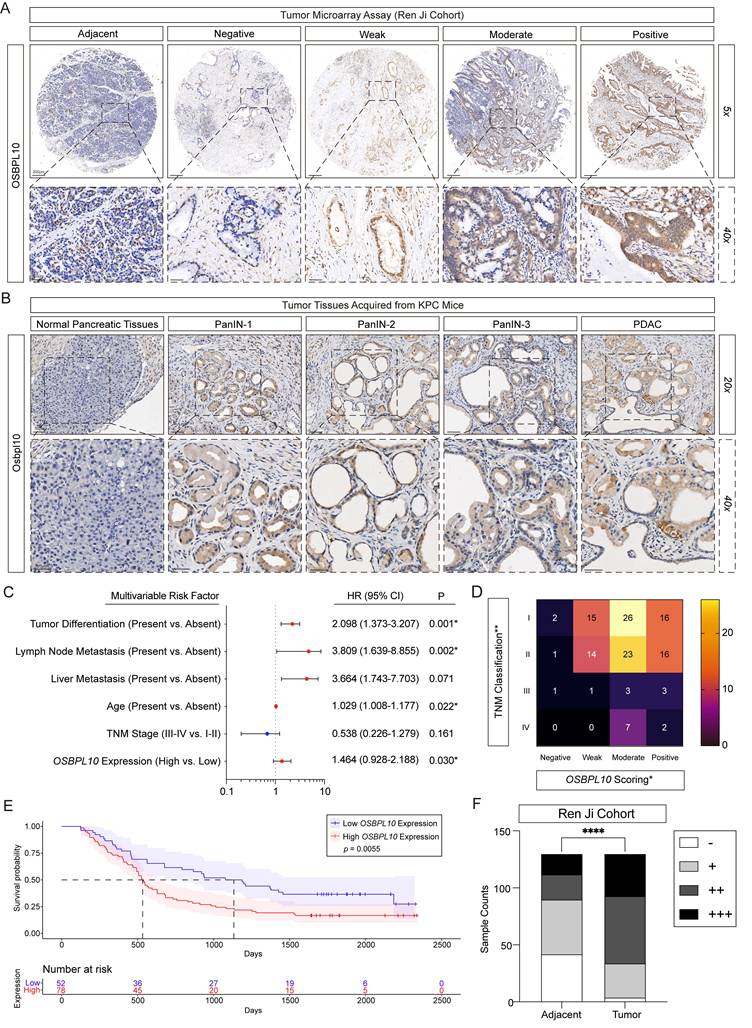
In parallel, IHC was performed on pancreatic tissues from KPC and KC mice to investigate OSBPL10 expression during PDAC development. The results showed progressively elevated OSBPL10 expression in PanIN and PDAC lesions (Fig. 7B, Supplementary Fig. 10B-C). Analysis of the TMA revealed that OSBPL10 served as an independent clinicopathological indicator in our cohort and was positively correlated with TNM stage, tumor size, and tumor differentiation (Fig. 7C-D, Supplementary Fig. 10D). Furthermore, survival analysis demonstrated that patients with high OSBPL10 expression had significantly poorer overall survival compared to those with low expression (Fig. 7E). Quantitative comparison confirmed that OSBPL10 expression levels were markedly higher in tumor tissues than in adjacent normal tissues (Fig. 7F). Consistently, analysis of the TCGA-PAAD dataset showed that patients with elevated OSBPL10 expression had reduced recurrence-free survival and overall survival, supporting its association with poor prognosis (Supplementary Fig. 11A-B).
In summary, these results indicate that OSBPL10, as a key lipophagy factor, is significantly upregulated in human PDAC tissues and serves as a predictor of poor clinical outcomes.
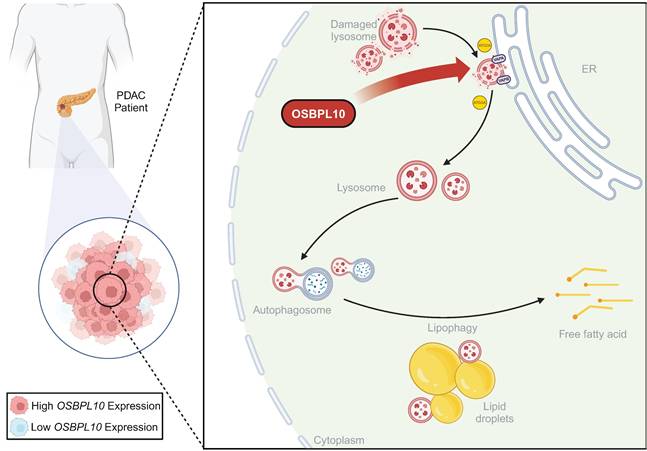
Graphical abstract of high OSBPL10 expression facilitates lipophagy via ATG2A-mediated rapid lysosomal repair to support PDAC proliferation.
Discussion
In this study, we demonstrated the presence and significance of lipophagy in PDAC, highlighting its role as an effective mechanism for tumor cells to mobilize lipid reserves stored in LDs. Reprogramming of lipid metabolism, particularly fatty acid utilization, is a well-established hallmark of PDAC. Our study extends this concept by uncovering the role of lipophagy in mobilizing lipid droplets [10, 37]. Epidemiological studies have consistently identified obesity as a major risk factor for cancer progression, and in PDAC, fatty acid utilization and consumption have emerged as a critical area of study [19, 38, 39]. Even under conditions of extracellular fatty acid abundance, cancer cells exploit all available fatty acids to sustain growth [40]. In early studies, researchers have demonstrated multiple genes with aberrant upregulation in solid tumors including hepatocellular carcinoma, prostate cancer, colorectal cancer, and PDAC [6, 38, 41]. LDs, commonly described as “lipid reservoirs,” play a silent yet essential role in cancer metabolism. Neutral lipids stored in LDs, primarily triacylglycerols, are tightly regulated to maintain cellular homeostasis [42]. LDs may also be synthesized de novo under stress conditions such as nutrient deprivation [43]. Within the complex tumor microenvironment of PDAC, nutrient availability is often limited, and LDs provide a critical energy source under these conditions. Despite the central importance of LDs, relatively few studies have focused on the mechanisms of LD breakdown, which is necessary for the release of free fatty acids for metabolic use.
Macroautophagy, generally referred to as autophagy, plays a central role in cellular recycling and degradation of intracellular components [44]. While autophagy has context-dependent pro- and anti-tumor functions, our data specifically highlight lipophagy as a critical adaptation supporting PDAC progression, filling a gap in current knowledge [22, 45-47]. Accumulating evidence supports a tumor-promoting role for autophagy, based on the upregulation of autophagy-related genes and proteins in various cancers [22, 48]. Lipophagy, a selective form of autophagy, was first identified in 2009 in hepatocytes and has since provided new insights into the relationship between intracellular lipid metabolism and cellular physiology [49]. PDAC cells, however, exhibit highly unorthodox lipid metabolism, raising the question of how they sustain rapid progression in nutrient-deprived tumor microenvironments [50, 51]. Our study positions enhanced lipophagy not merely as a correlative event but as a critical adaptive metabolic mechanism that actively fuels PDAC progression, offering a novel perspective on the metabolic adaptations of PDAC cells.
In our study, we identify OSBPL10 as a key factor of lipophagy in PDAC. This biological process ensures a continuous supply of free fatty acids regardless of external nutrient fluctuations. These fatty acids serve dual purposes: they fuel ATP production via β-oxidation and act as essential building blocks for the synthesis of proliferating cellular membranes and signaling lipid mediators [39]. OSBPL10-enhanced lipophagy directly supports tumor growth by sustaining pro-proliferative signaling and biosynthesis. The products of lipophagy, fatty acids and cholesterol, are not merely metabolic fuel. Free fatty acids can act as ligands for peroxisome proliferator-activated receptors, activating transcriptional programs linked to proliferation and metastasis [52]. Moreover, efficiently recycled cholesterol is vital for maintaining membrane integrity and cholesterol-rich lipid rafts, which are essential platforms for the signaling of key growth-promoting receptors, including those in the KRAS pathway, a nearly universal driver in PDAC [53]. While previous studies have established OSBPL10 as an oncogene promoting PDAC progression through the VEGF/AKT pathway, and bioinformatic analyses have corroborated its prognostic significance, its specific role in metabolic reprogramming remained unexplored [54, 55]. The OSBPL10-lipophagy axis is also distinct from several established mechanisms in the field. Unlike OSBPL8, which was identified as a direct lipophagy receptor that bridges lipid droplets to autophagosomes to mediate their degradation in hepatocytes, OSBPL10 operates upstream as a guardian of lysosomal integrity via ATG2A-mediated repair. While recent work highlights that glycolysis-suppressed PDAC cells become dependent on lipophagy for survival, our discovery of the OSBPL10-lipophagy axis provides the mechanistic explanation for how this critical process is specifically upregulated in tumors [8, 37]. Our work bridges this gap by discovering an unprecedented mechanism: OSBPL10 drives PDAC progression by specifically enhancing lipophagy through ATG2A-mediated rapid lysosomal repair. This positions OSBPL10 not merely as a general oncogene but as a critical metabolic sensor and facilitator. It directly regulates the integrity of the degradative compartment, lysosomes, thereby ensuring efficient lipid droplet turnover to fuel tumor growth. This ATG2A-dependent lysosomal repair mechanism represents a previously unrecognized layer of lipophagy regulation in cancers.
To date, autophagy and its related pathways have been closely linked to cancer cell progression and survival, highlighting autophagy as a potential therapeutic target [9, 47, 56, 57]. However, few therapeutic targets and inhibitors have been identified, and the direct crosstalk between selective autophagy and intracellular metabolism remains underexplored. Our findings nominate OSBPL10 as a candidate therapeutic target in PDAC. Direct inhibition of OSBPL10 faces challenges including the lack of existing inhibitors and potential on-target toxicities in normal tissues with high lipid turnover [54]. In contrast, repurposing lysosomotropic agents like CQ or Bafilomycin A1 offers a more immediate translational avenue, as evidenced by our study and ongoing oncology trials evaluating its combination with gemcitabine and other agents in PDAC [58]. Although broad autophagy blockade may limit its therapeutic effects, its rational combination with standard therapies currently presents the most viable strategy to exploit the OSBPL10-mediated lipophagy dependency in PDAC [58]. Meanwhile, we observed heterogeneity in lipophagic activity among not only among cancer cells, but also among other components in the tumor microenvironment, and we wish to conduct further investigation in future studies on carcinogenesis in PDAC and other malignant tumors. Moreover, further proof of direct interaction between OSBPL10 and VAPA/VAPB awaits further assays to ensure the mechanism of rapid lysosomal repair. Moreover, by comparing other in-depth published works about lipophagy, including its perturbation towards intracellular lipid metabolism via SREBF1, or its specific receptor, ATG14, that has been recently discovered, more work needs to be done in order to depict an elaborate atlas of lipophagy not only in PDAC, but also in more diseases [59, 60].
By uncovering the mechanism of lipophagy regulation in PDAC, our study provides new insights into the role of intracellular fatty acid metabolism and energy utilization, and lays a foundation for future investigations into therapeutic strategies targeting lipophagy.
Supplementary Material
Supplementary figures and tables.
Acknowledgements
We thank Dr. Ao Junping for technical support. And we thank Bio-render, K-M plot and SangerBox for the graphic assistances.
Funding
This study was supported by the National Natural Science Foundation of China (No. 82472917 to Y.-W.S., No. 82473029 to J.-Y.Y., 82372622 to R.H.), Bethune Charitable Foundation (No. YXZL-2023-B-002 to Y. -M.H.) and the Foundation of Ren Ji Hospital (No. RJTS26-MS-032 to Y. -M.H.).
Ethical approval
The clinical sample studies were all approved under number RA-2019-116 assigned by the Research Ethics Committee of Ren Ji Hospital, School of Medicine, Shanghai Jiao Tong University, China. The animal studies were performed strictly in accordance with the National Institutes of Health Guide for the Care and Use of Laboratory Animals, and all procedures were conducted under the approved protocol number A2020108, assigned by the Research Ethics Committee of Shanghai Jiao Tong University, China.
Consent for publication
All authors had agreed to publish this manuscript.
Authors contributions
Y.-W.S., L.-L.Y., Z.-H.D., and Y.-M.H. were responsible for experimental design and concept establishment; Y.-M.H., D.-J.L., and M.-W.Y. were responsible for the collection of clinical samples; Z.W., Z.-H.D., and H.-F.Y. were responsible for animal experiments; Z.-H.D., J.-Y.Y., X.-S.-Y.M., and X.-L.F. performed cell molecular biology experiments; L.-P.H., S.-H.J., W.L, and L.-L.Y were responsible for article writing and data measurement; Y.-W.S., J.-F.Z, Y.-M.H., and D.M. were responsible for paper revision.
Availability of data and materials
The data are available within the Article, Supplementary Information, or available from the authors upon request. Source data are provided with this paper.
Competing Interests
The authors have declared that no competing interest exists.
References
1. Duan X, Zhang T, Feng L, de Silva N, Greenspun B, Wang X. et al. A pancreatic cancer organoid platform identifies an inhibitor specific to mutant KRAS. Cell Stem Cell. 2024;31:71-88.e8
2. Niu N, Shen X, Wang Z, Chen Y, Weng Y, Yu F. et al. Tumor cell-intrinsic epigenetic dysregulation shapes cancer-associated fibroblasts heterogeneity to metabolically support pancreatic cancer. Cancer Cell. 2024;42:869-84.e9
3. Li Y, Huang M, Wang M, Wang Y, Deng P, Li C. et al. Tumor cells impair immunological synapse formation via central nervous system-enriched metabolite. Cancer Cell. 2024
4. Qin J, Ye L, Wen X, Zhang X, Di Y, Chen Z. et al. Fatty acids in cancer chemoresistance. Cancer Lett. 2023;572:216352
5. Kim H, Oh S, Lee S, Lee KS, Park Y. Recent advances in label-free imaging and quantification techniques for the study of lipid droplets in cells. Curr Opin Cell Biol. 2024;87:102342
6. Chen J, Ding C, Chen Y, Hu W, Yu C, Peng C. et al. ACSL4 reprograms fatty acid metabolism in hepatocellular carcinoma via c-Myc/SREBP1 pathway. Cancer Lett. 2021;502:154-65
7. Zheng Y, Chen J, Macwan V, Dixon CL, Li X, Liu S. et al. S-acylation of ATGL is required for lipid droplet homoeostasis in hepatocytes. Nat Metab. 2024;6:1549-65
8. Pu M, Zheng W, Zhang H, Wan W, Peng C, Chen X. et al. ORP8 acts as a lipophagy receptor to mediate lipid droplet turnover. Protein Cell. 2023;14:653-67
9. Haidar M, Loix M, Vanherle S, Dierckx T, Vangansewinkel T, Gervois P. et al. Targeting lipophagy in macrophages improves repair in multiple sclerosis. Autophagy. 2022;18:2697-710
10. Geng F, Zhong Y, Su H, Lefai E, Magaki S, Cloughesy TF. et al. SREBP-1 upregulates lipophagy to maintain cholesterol homeostasis in brain tumor cells. Cell Rep. 2023;42:112790
11. Chen S, Lu Z, Jia H, Yang B, Liu C, Yang Y. et al. Hepatocyte-specific Mas activation enhances lipophagy and fatty acid oxidation to protect against acetaminophen-induced hepatotoxicity in mice. J Hepatol. 2023;78:543-57
12. Kang N, Tan J, Yan S, Lin L, Gao Q. General autophagy-dependent and -independent lipophagic processes collaborate to regulate the overall level of lipophagy in yeast. Autophagy. 2024;20:1523-36
13. Siegel RL, Giaquinto AN, Jemal A. Cancer statistics, 2024. CA Cancer J Clin. 2024;74:12-49
14. Bray F, Laversanne M, Sung H, Ferlay J, Siegel RL, Soerjomataram I. et al. Global cancer statistics 2022: GLOBOCAN estimates of incidence and mortality worldwide for 36 cancers in 185 countries. CA Cancer J Clin. 2024;74:229-63
15. Tojjari A, Idrissi YA, Saeed A. Emerging targets in gastric and pancreatic cancer: Focus on Claudin 18.2. Cancer Lett. 2024: 217362
16. Yu B, Shao S, Ma W. Frontiers in pancreatic cancer on biomarkers, microenvironment, and immunotherapy. Cancer Lett. 2024;610:217350
17. Musiu C, Adamo A, Caligola S, Agostini A, Frusteri C, Lupo F. et al. Local ablation disrupts immune evasion in pancreatic cancer. Cancer Lett. 2024;609:217327
18. Xue T, Zhang Y, Zhang L, Yao L, Hu X, Xu LX. Proteomic analysis of two metabolic proteins with potential to translocate to plasma membrane associated with tumor metastasis development and drug targets. J Proteome Res. 2013;12:1754-63
19. Li B, Mi J, Yuan Q. Fatty acid metabolism-related enzymes in colorectal cancer metastasis: from biological function to molecular mechanism. Cell Death Discov. 2024;10:350
20. Perttilä J, Merikanto K, Naukkarinen J, Surakka I, Martin NW, Tanhuanpää K. et al. OSBPL10, a novel candidate gene for high triglyceride trait in dyslipidemic Finnish subjects, regulates cellular lipid metabolism. J Mol Med (Berl). 2009;87:825-35
21. Tan JX, Finkel T. A phosphoinositide signalling pathway mediates rapid lysosomal repair. Nature. 2022;609:815-21
22. Liu J, Wu Y, Meng S, Xu P, Li S, Li Y. et al. Selective autophagy in cancer: mechanisms, therapeutic implications, and future perspectives. Mol Cancer. 2024;23:22
23. Duan Y, Gong K, Xu S, Zhang F, Meng X, Han J. Regulation of cholesterol homeostasis in health and diseases: from mechanisms to targeted therapeutics. Signal Transduct Target Ther. 2022;7:265
24. Niu N, Lu P, Yang Y, He R, Zhang L, Shi J. et al. Loss of Setd2 promotes Kras-induced acinar-to-ductal metaplasia and epithelia-mesenchymal transition during pancreatic carcinogenesis. Gut. 2020;69:715-26
25. Wang Y, Song F, Zhu J, Zhang S, Yang Y, Chen T. et al. GSA: Genome Sequence Archive<sup/>. Genomics Proteomics Bioinformatics. 2017;15:14-8
26. Chen K, Wang Q, Liu X, Tian X, Dong A, Yang Y. Immune profiling and prognostic model of pancreatic cancer using quantitative pathology and single-cell RNA sequencing. J Transl Med. 2023;21:210
27. Hao Y, Hao S, Andersen-Nissen E, Mauck WM 3rd, Zheng S, Butler A. et al. Integrated analysis of multimodal single-cell data. Cell. 2021;184:3573-87.e29
28. Petegrosso R, Li Z, Kuang R. Machine learning and statistical methods for clustering single-cell RNA-sequencing data. Brief Bioinform. 2020;21:1209-23
29. Hu LP, Zhang XX, Jiang SH, Tao LY, Li Q, Zhu LL. et al. Targeting Purinergic Receptor P2Y2 Prevents the Growth of Pancreatic Ductal Adenocarcinoma by Inhibiting Cancer Cell Glycolysis. Clin Cancer Res. 2019;25:1318-30
30. Schindelin J, Arganda-Carreras I, Frise E, Kaynig V, Longair M, Pietzsch T. et al. Fiji: an open-source platform for biological-image analysis. Nat Methods. 2012;9:676-82
31. Bakula D, Müller AJ, Zuleger T, Takacs Z, Franz-Wachtel M, Thost AK. et al. WIPI3 and WIPI4 β-propellers are scaffolds for LKB1-AMPK-TSC signalling circuits in the control of autophagy. Nat Commun. 2017;8:15637
32. Maeda S, Otomo C, Otomo T. The autophagic membrane tether ATG2A transfers lipids between membranes. Elife. 2019 8
33. Osawa T, Kotani T, Kawaoka T, Hirata E, Suzuki K, Nakatogawa H. et al. Atg2 mediates direct lipid transfer between membranes for autophagosome formation. Nat Struct Mol Biol. 2019;26:281-8
34. Valverde DP, Yu S, Boggavarapu V, Kumar N, Lees JA, Walz T. et al. ATG2 transports lipids to promote autophagosome biogenesis. J Cell Biol. 2019;218:1787-98
35. Li S, Lv J, Li Z, Zhang Q, Lu J, Huo X. et al. Overcoming multi-drug resistance in SCLC: a synergistic approach with venetoclax and hydroxychloroquine targeting the lncRNA LYPLAL1-DT/BCL2/BECN1 pathway. Mol Cancer. 2024;23:243
36. Thakur PC, Miller-Ocuin JL, Nguyen K, Matsuda R, Singhi AD, Zeh HJ. et al. Inhibition of endoplasmic-reticulum-stress-mediated autophagy enhances the effectiveness of chemotherapeutics on pancreatic cancer. J Transl Med. 2018;16:190
37. Meng Y, Guo D, Lin L, Zhao H, Xu W, Luo S. et al. Glycolytic enzyme PFKL governs lipolysis by promoting lipid droplet-mitochondria tethering to enhance β-oxidation and tumor cell proliferation. Nat Metab. 2024;6:1092-107
38. Xu C, Gu L, Hu L, Jiang C, Li Q, Sun L. et al. FADS1-arachidonic acid axis enhances arachidonic acid metabolism by altering intestinal microecology in colorectal cancer. Nat Commun. 2023;14:2042
39. Koundouros N, Poulogiannis G. Reprogramming of fatty acid metabolism in cancer. Br J Cancer. 2020;122:4-22
40. Long T, Sun Y, Hassan A, Qi X, Li X. Structure of nevanimibe-bound tetrameric human ACAT1. Nature. 2020;581:339-43
41. Lee HJ, Li J, Vickman RE, Li J, Liu R, Durkes AC. et al. Cholesterol Esterification Inhibition Suppresses Prostate Cancer Metastasis by Impairing the Wnt/β-catenin Pathway. Mol Cancer Res. 2018;16:974-85
42. Matsuo M. ABCA1 and ABCG1 as potential therapeutic targets for the prevention of atherosclerosis. J Pharmacol Sci. 2022;148:197-203
43. Kuan YC, Hashidume T, Shibata T, Uchida K, Shimizu M, Inoue J. et al. Heat Shock Protein 90 Modulates Lipid Homeostasis by Regulating the Stability and Function of Sterol Regulatory Element-binding Protein (SREBP) and SREBP Cleavage-activating Protein. J Biol Chem. 2017;292:3016-28
44. Han L, Meng L, Liu J, Xie Y, Kang R, Klionsky DJ. et al. Macroautophagy/autophagy promotes resistance to KRAS(G12D)-targeted therapy through glutathione synthesis. Cancer Lett. 2024;604:217258
45. Esmaeilian Y, Hela F, Bildik G, İltumur E, Yusufoglu S, Yildiz CS. et al. Autophagy regulates sex steroid hormone synthesis through lysosomal degradation of lipid droplets in human ovary and testis. Cell Death Dis. 2023;14:342
46. Fu Y, Chen N, Wang Z, Luo S, Ding Y, Lu B. Degradation of lipid droplets by chimeric autophagy-tethering compounds. Cell Res. 2021;31:965-79
47. Zhang S, Peng X, Yang S, Li X, Huang M, Wei S. et al. The regulation, function, and role of lipophagy, a form of selective autophagy, in metabolic disorders. Cell Death Dis. 2022;13:132
48. Niu X, You Q, Hou K, Tian Y, Wei P, Zhu Y. et al. Autophagy in cancer development, immune evasion, and drug resistance. Drug Resist Updat. 2024;78:101170
49. Zhou S, Qiao B, Chu X, Kong Q. Oxymatrine attenuates cognitive deficits through SIRT1-mediated autophagy in ischemic stroke. J Neuroimmunol. 2018;323:136-42
50. Deng B, Kong W, Shen X, Han C, Zhao Z, Chen S. et al. The role of DGAT1 and DGAT2 in regulating tumor cell growth and their potential clinical implications. J Transl Med. 2024;22:290
51. Ebner M, Puchkov D, López-Ortega O, Muthukottiappan P, Su Y, Schmied C. et al. Nutrient-regulated control of lysosome function by signaling lipid conversion. Cell. 2023;186:5328-46.e26
52. Berger J, Moller DE. The mechanisms of action of PPARs. Annu Rev Med. 2002;53:409-35
53. Huang B, Song BL, Xu C. Cholesterol metabolism in cancer: mechanisms and therapeutic opportunities. Nat Metab. 2020;2:132-41
54. Qi J, Yu K, Liu B, Wang Y, Wang W, An R. et al. Potential prognostic biomarker of OSBPL10 in pan-cancer associated with immune infiltration. Naunyn Schmiedebergs Arch Pharmacol. 2025;398:11883-907
55. Chou CW, Hsieh YH, Ku SC, Shen WJ, Anuraga G, Khoa Ta HD. et al. Potential Prognostic Biomarkers of OSBPL Family Genes in Patients with Pancreatic Ductal Adenocarcinoma. Biomedicines. 2021 9
56. Cui W, Sathyanarayan A, Lopresti M, Aghajan M, Chen C, Mashek DG. Lipophagy-derived fatty acids undergo extracellular efflux via lysosomal exocytosis. Autophagy. 2021;17:690-705
57. Li Q, Zhao Y, Guo H, Li Q, Yan C, Li Y. et al. Impaired lipophagy induced-microglial lipid droplets accumulation contributes to the buildup of TREM1 in diabetes-associated cognitive impairment. Autophagy. 2023;19:2639-56
58. Nagaraju GP, Saddala MS, Foote JB, Khaliq AM, Masood A, Golivi Y. et al. Mechanism of enhancing chemotherapy efficacy in pancreatic ductal adenocarcinoma with paricalcitol and hydroxychloroquine. Cell Rep Med. 2025;6:101881
59. Geng F, Guo D. SREBF1/SREBP-1 concurrently regulates lipid synthesis and lipophagy to maintain lipid homeostasis and tumor growth. Autophagy. 2024;20:1183-5
60. Yuan Z, Cai K, Li J, Chen R, Zhang F, Tan X. et al. ATG14 targets lipid droplets and acts as an autophagic receptor for syntaxin18-regulated lipid droplet turnover. Nat Commun. 2024;15:631
Author contact
![]() Corresponding authors: Yanmiao Huo (huoyanmiaocom), Department of Biliary-Pancreatic Surgery, Ren Ji Hospital, Shanghai Jiao Tong University School of Medicine, 160 Pujian Road, Shanghai 200127, P.R. China. Linli Yao (llyaoorg), Shanghai Key Laboratory of Cancer Systems Regulation and Clinical Translation, Jiading District Central Hospital, 1 Chengbai Road, Jiading District, Shanghai, 201800, P.R. China. Yongwei Sun (syw0616com), Department of Biliary-Pancreatic Surgery, Ren Ji Hospital, School of Medicine, Shanghai Jiao Tong University, 160 Pujian Road, Shanghai 200127, P.R. China. Xiaomei Yang (xmyangorg), State Key Laboratory of Systems Medicine for Cancer, Shanghai Cancer Institute, Shanghai Jiao Tong University, 800 Dongchuan Road, Shanghai 200240, China.
Corresponding authors: Yanmiao Huo (huoyanmiaocom), Department of Biliary-Pancreatic Surgery, Ren Ji Hospital, Shanghai Jiao Tong University School of Medicine, 160 Pujian Road, Shanghai 200127, P.R. China. Linli Yao (llyaoorg), Shanghai Key Laboratory of Cancer Systems Regulation and Clinical Translation, Jiading District Central Hospital, 1 Chengbai Road, Jiading District, Shanghai, 201800, P.R. China. Yongwei Sun (syw0616com), Department of Biliary-Pancreatic Surgery, Ren Ji Hospital, School of Medicine, Shanghai Jiao Tong University, 160 Pujian Road, Shanghai 200127, P.R. China. Xiaomei Yang (xmyangorg), State Key Laboratory of Systems Medicine for Cancer, Shanghai Cancer Institute, Shanghai Jiao Tong University, 800 Dongchuan Road, Shanghai 200240, China.