Impact Factor ISSN: 1449-2288
- Issue 12; 2026
- Issue 11; 2026
- Issue 10; 2026
- Issue 9; 2026
- Issue 8; 2026
- Volume 22; 2026
- Past Issues
- Advance Articles
- Editorial Board
- Cover Images
- Index & Coverage
- Cover Suggestion
- Special Issues
1. Introduction
2. Methods
3. Results
4. Discussion
Abbreviations
Supplementary Material
Acknowledgements
References

 Global reach, higher impact
Int J Biol Sci 2026; 22(3):1070-1081. doi:10.7150/ijbs.122643 This issue Cite
Research Paper
β3-adrenergic receptor agonist causes acute thermogenic metabolic crisis in ACSS1-K635Q knock-in mice
E. Sandra Chocron1,2, David Zhang4, Bushra Sumawi1,2, Joseph Schell1,2, Diego Cruz1,2, Guannan Li2,3, Prethish Sreenivas1,2, Haiyan Jiang1,2, Felix F. Dong1,2, Erin Munkácsy1,2, Shangang Zhao2,3, Maria A. Gonzalez Porras4, David Gius1,2, ![]()
1. Department of Radiation Oncology, Mays Cancer Center at UT Health San Antonio MD Anderson, Joe R. and Teresa Lozano Long School of Medicine, San Antonio, Texas, United States.
2. Barshop Institute for Longevity and Aging Studies at UT Health San Antonio, San Antonio, Texas, United States.
3. Department of Medicine, UT Health San Antonio, San Antonio, Texas, United States.
4. Department of Biomedical Engineering and Chemical Engineering, The University of Texas at San Antonio, San Antonio, TX.
Received 2025-7-29; Accepted 2025-11-7; Published 2026-1-1
Abstract

Mitochondrial Acyl-Coenzyme Synthetase Short Chain Family Member-1 (ACSS1) converts free acetate into acetyl-coenzyme A (acetyl-CoA), regulated, in part, by acetylation at lysine 635 (ACSS1-K635). We challenged our ACSS1 constitutive acetylation mimic knock-in (K635Q) mice by injecting a β3-adrenergic receptor agonist, CL-316243 (CL), to induce a thermogenic response. Strikingly, we show that Acss1K635Q/K635Q mice exhibit hypothermia and acute metabolic crisis following CL stimulus, as shown by significantly reduced oxygen consumption, carbon dioxide production, respiratory exchange ratio, and heat production. We also observed histological differences in both brown adipose tissue (BAT) and subcutaneous white adipose tissue (WAT), accompanied by altered expression and regulation of lipogenic enzymes and Uncoupling Protein 1 (UCP1) in Acss1K635Q/K635Q. In contrast to wild-type adipose tissues, Acss1K635Q/K635Q did not show changes in acetyl-CoA and acetate levels in response to CL, and mitochondria isolated from BAT displayed impaired respiration on palmitate. Lastly, beige adipocytes differentiated ex vivo from Acss1K635Q/K635Q mice showed altered response to the adenylate cyclase stimulator, forskolin, with unresponsive mitochondria and lipogenic lipid droplets, and lower fatty acid oxidation activity. These results suggest that non-acetylated ACSS1 plays an essential role in thermoregulation and the ability to metabolize free fatty acids.
Keywords: ACSS1, acetylation, beige, brown adipose tissue, brown fat, mitochondria, thermogenesis, UCP1
1. Introduction
Acetyl-Coenzyme A (acetyl-CoA) is essential to energy metabolism and lipid synthesis, as well as epigenetic and protein regulation [1, 2]. In mammalian cells, the majority of acetyl-CoA is generated through glycolysis and fatty acid oxidation (FAO). As such, acetyl-CoA functions as a small molecule metabolic sensor and regulates protein function through non-enzymatic acetylation of lysine residues [3, 4]. Thus, increased FAO, as under both fasting and high-fat diet conditions, increases acetylation of ACSS1 and other mitochondrial proteins [10, 11]. Acetyl-CoA Synthetase Short Chain Family Member-1 (ACSS1, previously known as AceCS2) catalyzes the ligation of acetate and coenzyme A to generate acetyl-CoA in the mitochondria, and plays a role in lipid metabolism, at least under certain nutrient conditions [5]. ACSS1 enzymatic activity is regulated, in part, through acetylation at lysine 635 in mice (K642 in humans), which reduces ACSS1 activity, and by deacetylation by Sirtuin 3 (SIRT3) [6-9].
As the primary mitochondrial deacetylase, SIRT3, plays an important role in regulating metabolism, including FAO [12] and brown fat thermogenesis [13]. Brown adipose tissue (BAT) dissipates energy as heat during non-shivering thermogenesis. Studies in both humans and murine models have demonstrated that higher levels of brown fat are protective against developing type 2 diabetes and cardiovascular diseases [14-16]. When stimulated by cold or thyroid hormone, BAT uses glucose and free fatty acids (FFAs) released from triglycerides by lipases for thermogenesis. Fully active thermogenic adipose tissue can increase whole-body energy expenditure by more than 100% in mice [17] and 40-80% in humans [18].
Importantly, white adipose tissue (WAT) can go through a browning process, with “beige” adipocytes appearing in WAT in response to increased thermogenic demand from cold stimulus or pharmaceuticals. Both beige and brown adipocytes contain multilocular lipid droplets and a high density of mitochondria that express Uncoupling Protein 1 (UCP1). When activated, UCP1 creates an alternate portal for protons back across the inner mitochondrial membrane, thereby uncoupling oxidative phosphorylation and generation of the proton gradient from ATP synthesis and dissipating the energy potential as heat instead [19]. Adipocyte thermogenic capacity thus depends primarily on catabolism of FFAs through oxidative metabolism [20]. Classically, adipose-tissue thermogenesis is driven by sympathetic nerve-mediated adrenergic signaling, which stimulates lipolysis. FFAs serve both as fuel for thermogenesis and as allosteric activators of UCP1 function. Indeed, long-chain fatty acids are uniquely required for UCP1-induced uncoupling [21]. WAT is key in this process by releasing FFAs into circulation through lipogenesis to support BAT thermogenesis [22].
While acetylation has been shown to decrease ACSS1 ligase activity [7], the physiological role of ACSS1 acetylation status in thermogenesis has not been characterized. In this regard, we generated an ACSS1-acetylation (Ac) mimic knock-in mouse, where lysine 635 was mutated to glutamine (K635Q), which structurally and biochemically mimics acetylated lysine [5, 9]. In metabolic conditions requiring increased reliance on FAO, including fasting [5] or on a ketogenic diet [23], these mice exhibited hepatic steatosis and altered lipid profile compared to control mice under the same conditions. These data suggested that Acss1K635Q/K635Q mice have difficulty with increases in metabolic demand that depend on FAO. For this reason, we investigated the role of ACSS1 acetylation in the thermogenic response, which is highly dependent on fatty acid metabolism, by injecting Acss1K635Q/K635Q mice with the specific β3-adrenergic receptor agonist, CL-316243 (CL). Strikingly, we found Acss1K635Q/K635Q mice to be intolerant of CL injection, exhibiting acute metabolic decompensation, hypothermia, and in some cases, death 24 hours after injection.
2. Methods
2.1. Animal model
All animal experiments were conducted in compliance with the National Institutes of Health (NIH) Guidelines for Humane Care and the Use of Laboratory Animals, and all murine studies were approved by the University of Texas Health San Antonio (UTHSA) Institutional Animal Care and Use Committee. Our Acss1K635Q mouse was generated in a C57BL/6 background and has been described in detail previously [5]. Mice were maintained in specific pathogen-free conditions at 21 ± 2 °C with 12h:12h light:dark cycle in the Animal Facility at UTHSA. Mice had free access to food and water, and were given pelleted Inotiv Teklad Rodent Diet traditional formula LM-485. For all studies, we used four-month-old male and female mice, as indicated for each experiment. Confounders such as order of measurements and cage location were not controlled.
Thermogenic stimulation: CL-316243 (CL) was prepared in saline at a solution of 0.2 mg/mL and then injected in mice intraperitoneally at 1 mg/kg. Then mice were monitored every hour for measurements and health status hourly. Temperature was measured using a mouse rectal thermometer. A Countour Next EZ glucometer and glucose strips were used to measure blood glucose from a small tail snip. Rectal temperature was monitored at the time points indicated with a rodent rectal temperature probe Ret 3 (Kent scientific).
Evaluation of circulating lipids: Whole blood was collected from the mice and serum was obtained by letting the blood to clot for one hour and then spun 10 minutes at 2000xg. Supernatants were then stored minus 80. Serum was sent to IDEXX to analyze free fatty acids, triglycerides and cholesterol based on a rodent panel.
Respirometry measurements: Mice were individually housed in metabolic cages, with free access to food and water. Mice were acclimated for two days before recording baseline parameters with PhenoMaster (Sable Systems) and following injection with CL (1 mg/kg) the mice are used for measurements of respiration for the following 24 hours.
2.2. Histology
Tissue blocks of formalin-fixed, paraffin-embedded mouse tissues were processed by the Laboratory Medicine core, UT Health San Antonio using standard methods. When adequate color development was seen, slides were washed in water to stop the reaction, counterstained with Meyer's hematoxylin (Dako), and covered with a Permount mounting medium (Richard-Allan Scientific). The micrographs were taken under a light microscope (Leica). Representative images are shown.
2.3. Mitochondria isolation and oxygen consumption assays
Approximately 10 mg BAT was collected on ice for Seahorse analysis. Mitochondria were isolated from tissue as previously described. In brief, the tissue was placed in a mitochondrial isolation buffer [70 mM sucrose, 210 mM mannitol, 1 mM ethylene glycol tetraacetic acid (EGTA), 5 mM 4-(2-hydroxyethyl)-1-piperazineethanesulfonic acid (HEPES), pH 7.2] and homogenized using a glass Teflon Dounce homogenizer. This solution was then centrifuged twice at 1000 g for 5 min at 4 °C to remove cell debris. The mitochondrial pellet was resuspended in a mitochondria assay solution (MAS) (70 mM sucrose, 220 mM mannitol, 5 mM phosphate, 5 mM magnesium chloride, 1 mM EGTA, 2 mM HEPES, pH 7.4). Protein was quantified by bicinchoninic acid (BCA) assay (Pierce) and concentrations adjusted with MAS to 3 μg of protein. The Seahorse plate containing 100 μL/well of the mitochondrial suspensions was centrifuged at 2000 g for 5 min at 4 °C with free deceleration. Finally, the well volume was brought up to 180 μL by addition of MAS supplemented with malate. The oxygen consumption rate (OCR) was measured in the presence of 10 mM BSA-conjugated palmitate, using a Seahorse XFe96 analyzer at 37 °C, and 5 mM glycerol-3-phosphate (G3P) and 3 mM guanosine diphosphate (GDP) were added sequentially at controlled time points during the OCR measurements. Data were collected and processed using Agilent Seahorse Wave software.
2.4. Western Blotting and Imaging
Total protein lysate preparation from tissues for immunoblot have been described [24-27]. Protein concentrations were determined by Pierce BCA Protein Assay, and 20 µg from each sample was separated by NuPAGETM Bis-Tris 4-12% gradient sodium dodecyl sulfate polyacrylamide gel electrophoresis (SDS-PAGE) (Invitrogen), transferred onto polyvinylidene difluoride (PVDF) membrane (Bio-Rad), probed with primary antibody (Table 1) and then with horseradish peroxidase (HRP) conjugated to either a mouse or rabbit secondary antibody (Cell Signaling), and visualized with enhanced chemiluminescence (Fisher Scientific; SuperSignalTM West Femto Maximum Sensitivity Substrate).
Primary antibodies.
| Antibody | Source | Identifier |
|---|---|---|
| ACSS1 rabbit polyclonal | Proteintech | #17138-1AP |
| ATGL rabbit polyclonal | Proteintech | #55190-1-AP |
| HADHA / Kv4.2 (aa 501-630 of hKv4.2) rabbit polyclonal | NOVUS | #NBP3-03743 |
| HSL rabbit | Cell Signaling | #4107T |
| Phospho-HSL (Ser563) rabbit | Cell Signaling | #4139T |
| PGC1α (3G6) rabbit | Cell Signaling | #2178T |
| PLIN5 mouse monoclonal | Progen | #651176 |
| UCP1 (aa 100-200 of hUCP1) synthetic polyclonal | Abcam | #ab10983 |
| Beta Actin mouse monoclonal HRP-conjugated | Proteintech | #HRP-66009 |
Immunoblots were imaged were obtained using ProteinSimple FluorChem M, using the Auto Exposure feature to takes successively longer exposures of the membrane until an optimum exposure time is achieved. The subsequent images are then acquired in standard resolution, using 4x4 pixel binning (832x626-pixel images).
2.5. Quantitative real-time polymerase chain reaction analysis
Total RNA was extracted and purified from iWAT tissue and cells using the RNeasy Mini Kit (Qiagen), following the manufacturer's instructions. mRNA concentrations were determined with a Take3 Micro-Volume Plate (BioTek) and normalized to 150 ng prior to cDNA synthesis. Complementary DNA was generated using random hexamer primers and the iScript cDNA synthesis kit (Bio-Rad). Quantitative RT-PCR was carried out using the SsoAdvanced™ Universal SYBR Green Supermix (Bio-Rad) on a CFX96 Touch Real-Time PCR Detection System (Bio-Rad). Relative gene expression was quantified using the 2-∆∆Ct method, with transcript levels normalized to 18S rRNA. Primer specificity was confirmed via melting curve analysis (see Table 2 for sequences).
Quantitative real-time polymerase chain reaction primer sequences.
| Gene (Mouse) | Forward Sequence (5' to 3') | Reverse Sequence (5' to 3') |
|---|---|---|
| 18s | GTAACCCGTTGAACCCCATT | CCATCCAATCGGTAGTAGCG |
| Acss1 | ACCCTGATGCTGGTCGTTAC | CGTGGTTGATAGGCTCTCCC |
| Ucp1 | ACTGCCACACCTCCAGTCATT | CTTTGCCTCACTCAGGATTGG |
2.6. Acetyl-Coenzyme A and Acetate Quantification
We used frozen BAT and iWAT to quantify acetyl-CoA and acetate using the Abcam fluorometric PicoProbeTM acetyl-CoA (ab87546) and colorimetric acetate (ab204719) assay kits, respectively. Results were normalized to protein, as measured by Pierce BCA assay.
2.7. Cell Culture
Isolation: Subcutaneous adipose depots were harvested from euthanized WT and Acss1K635Q/K635Q mice and digested in collagenase type I. The adipose-derived stem cells were enzymatically isolated following a previously published protocol [28]. Briefly, digestion was performed in an orbital shaker at 37 °C for 60 min. The digest was then centrifuged and the floating adipocyte layer discarded. The pelleted stromal vascular fraction was washed two times with complete media [Dulbecco's Modified Eagle Medium (DMEM) with Ham's F12 nutrient mixture, supplemented with 10% fetal bovine serum and 1% antibiotic-antimycotic] and plated on tissue culture plastic. Cells at passages 2 to 5 were used for experiments.
Adipose derived stem cells beige differentiation: Cells (passage 2-4) were cultured in 24-well tissue culture plates and incubated in complete media. When cells reached 95% confluence, differentiation was initiated. For beige differentiation, cells were incubated for 4 days in induction media (complete media with 5 μg/mL insulin, 10 μM forskolin, 2 μg/ml dexamethasone, 125 μM indomethacin, 0.5 μM rosiglitazone and 1 nM triiodothyronine) and then maintained in complete media with 5 μg/ml insulin, 10 μM forskolin, 1 μM rosiglitazone and 1 nM triiodothyronine. Differentiation media was changed every other day until harvest.
Evaluation of fatty acid oxidation, lipid droplets, and mitochondrial membrane potential in mature adipocytes in vitro: FAO Blue was used at 1 μM concentration in DMEM without serum or phenol red. Beige differentiated stromal vascular cells were incubated in this media for 15 minutes in a humidified incubator and then directly imaged with a Leica Stellaris Sp5 confocal with the 405 laser line. Images were acquired at 63x and then fluorescence intensities were analyzed with the LAX software. To assay lipid droplets and mitochondrial membrane potential, we used bodipy at 1 μM and tetramethylrhodamine methyl ester (TMRM) ratiometric dye at 10 nM, and incubated cells for 10 minutes in a humidified incubator before imaging at 488 and 563 excitation. The lipid droplets and mitochondria were analyzed with LAX software by binning for size, count, and fluorescence intensity.
2.8. Statistical Analysis
Densitometric analysis of protein quantitation was determined by ImageJ software v0.5.5. (National Institutes of Health; http://imagej.nih.gov/ij Java 1.8.0- internal). Statistical differences were calculated as indicated in the figure legends by one- or two-way ANOVA, multivariate analysis, or unpaired Student's t-test in Microsoft Excel v2501 or GraphPad Prism 10.4.1. P-values were two-sided, and tests were considered significant at P < 0.05. All measurements were taken from distinct samples and replicates are biological. No data points were excluded. The number of replicates (mice) for each experimental group is given in the figure legends in the main text and supplement.
3. Results
3.1. Acss1K635Q/K635Q mice are intolerant to β3-adrenergic receptor agonist
As we have previously demonstrated, Acss1K635Q/K635Q mice are phenotypically normal, except for a notably smaller body mass in males [5]. Here, we show this size difference continues to be significant at three months on standard chow fed ad libitum (Figure 1A). We found no difference in body temperature or blood glucose levels in either sex (Figure 1B,C). Our previous studies showed that Acss1K635Q/K635Q mice seem to have impaired lipid metabolism and develop fatty liver under nutrient conditions demanding greater reliance on FAO, such as fasting [5] and a ketogenic diet [24]. Here, we turn our focus from the liver to adipose tissue, and test the thermogenic response in Acss1K635Q/K635Q mice.
Acss1K635Q/K635Q mice show impaired response to β3 adrenergic agonist, CL-316243. (A-C) Body mass (A), rectal temperature (B), and blood glucose (C) were measured in female and male 4-month-old WT and Acss1K635Q/K635Q mice. Exact data points (each representing an individual mouse) are shown, as well as the mean ± SEM. Statistical comparisons of WT vs. Acss1K635Q/K635Q were calculated for each sex and parameter by unpaired t-test (#p < 0.1, **p < 0.01). (D-G) At the indicated time points post-injection of CL-316243 (CL), rectal temperature (D, F) and blood glucose (E, G) were measured in female (D, E) and male (F, G) WT and Acss1K635Q/K635Q mice. Exact data points (each representing an individual mouse) are shown, as well as the mean ± SEM. Statistical comparisons of WT vs. Acss1K635Q/K635Q were calculated at each timepoint by two-way Analysis of Variance (ANOVA) with Tukey's Multiple Comparisons test (*p < 0.05, **p < 0.01, ****p < 0.0001). (H-J) Serum triglycerides (H), non-esterified free fatty acids (I), and cholesterol (J) were measured in female WT and Acss1K635Q/K635Q mice given vehicle vs. 4- or 24-hours post CL injection. Exact data points (each representing an individual mouse) are shown, as well as the mean ± SEM. Statistical comparisons of WT vs. Acss1K635Q/K635Q were calculated at each timepoint by two-way ANOVA with Tukey's Multiple Comparisons test (*p < 0.05, ***p < 0.001).
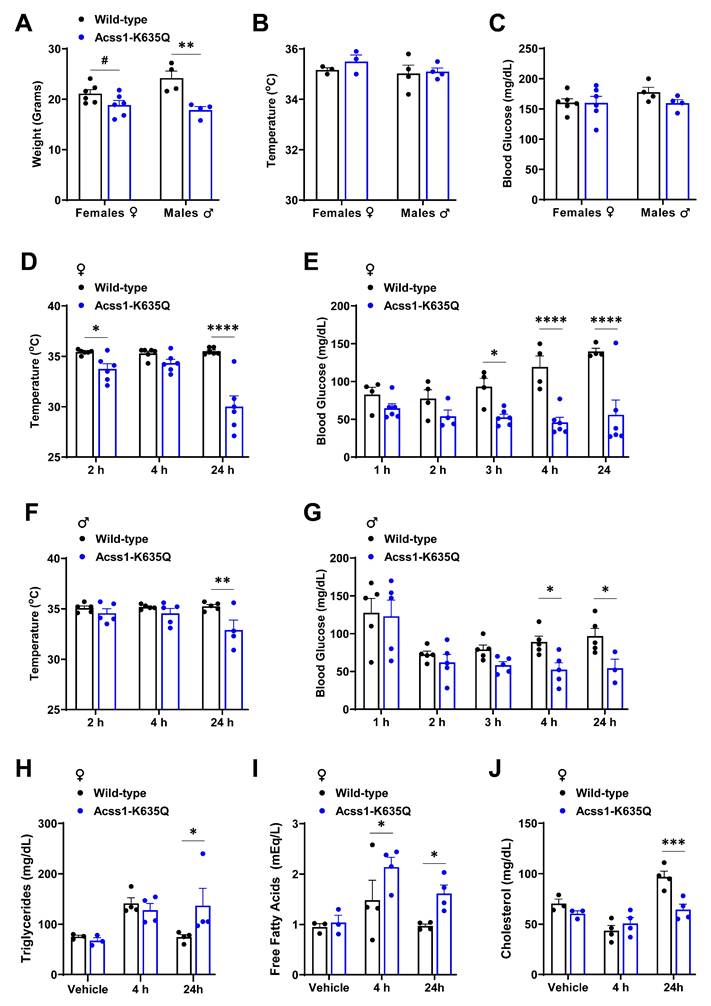
To induce a thermogenic response, three-month-old mice were administered the potent selective β3-adrenergic receptor agonist, CL-316243 (CL), by intraperitoneal (IP) injection at 1 mg/kg. Rectal temperature was monitored every 2 hours and blood glucose hourly. Both male and female Acss1K635Q/K635Q mice exhibited a drop in body temperature and blood glucose levels that was greatest after 24 hours, and more significant in female mice (Figure 1D-G), compared to no change in WT mice. In addition, roughly 25% of Acss1K635Q/K635Q mice died 24 hours after injection. These results demonstrate Acss1K635Q/K635Q mice are acutely intolerant to β3-adrenergic stimulation by CL and unable to maintain blood glucose and proper thermogenic function. In addition, these data further suggest that these mice are vulnerable to conditions that require increased fatty acid metabolism.
We further characterized the response to CL in female mice since they displayed more severe effects. In this regard, serum lipids were measured in mice given saline versus 4- and 24-hours post CL injection. We saw an increase in serum triglycerides 4 hours post-injection in both wild-type (WT) and Acss1K635Q/K635Q mice, with minimal difference between genotypes (Figure 1H). In contrast, Acss1K635Q/K635Q mice showed a significant increase in circulating FFA post-injection (Figure 1I), suggesting that CL stimulates lipolysis but that Acss1K635Q/K635Q mice are unable to effectively utilize circulating FFA. While cholesterol levels followed a similar trend in both genotypes, the dip and subsequent increase in WT post-injection appeared to be of somewhat greater magnitude (Figure 1J).
3.2. Acss1K635Q/K635Q mice are unable to adapt to the metabolic demand of CL stimulation
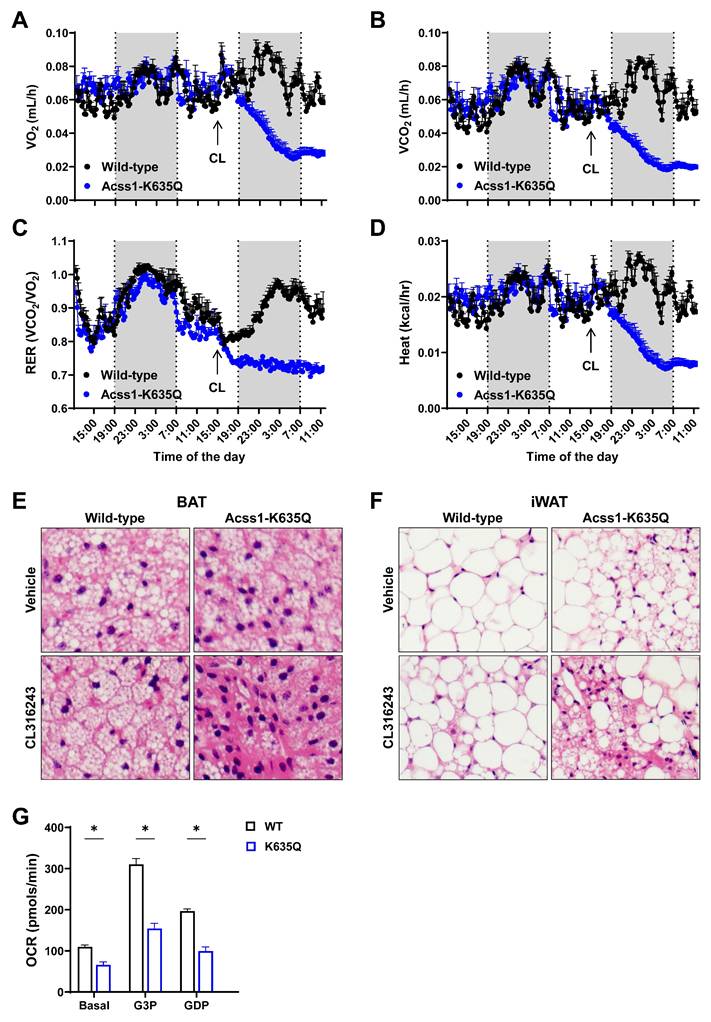
To further characterize the metabolic response of three-month-old females to CL stimulation, we performed respirometry measurements in individualized cages. While acclimating the mice for two days, we did not see major metabolic differences as we had previously in male mice [5]. However, following CL injection, we saw dramatic effects in the metabolic parameters of Acss1K635Q/K635Q mice. While WT mice responded to CL with increased O2 consumption (Figure 2A), Acss1K635Q/K635Q mice showed a dramatic decrease in O2 consumption, CO2 production, respiratory exchange ratio, and heat (Figure 2A-D), which may play a mechanistic role in the 25% lethality observed 24 hours post-injection. These data clearly demonstrate that Acss1K635Q/K635Q mice are intolerant to the thermogenic stimulus elicited by CL, suggesting a potential acute disruption of metabolism.
Acss1K635Q/K635Q mice are unable to adapt to the metabolic demand of CL stimulation. (A-D) Individual metabolic cages were used to measure oxygen consumption rate (A), carbon dioxide production (B), respiratory exchange ratio (C), and heat production (D), normalized to body mass, in 3-month-old female WT and Acss1K635Q/K635Q mice (n = 4 mice per group). Data represented as mean ± SEM at each timepoint. (E) H&E staining of brown adipose tissue (BAT) collected from WT (left column) and Acss1K635Q/K635Q (right column) mice 24 hours after injection of vehicle (top row) or CL (bottom row), shown at 40x magnification (n = 3 mice per group). 10x magnification is shown in Supplemental Figure S1B. (F) H&E staining of inguinal white adipose tissue (iWAT) collected from WT (left column) and Acss1K635Q/K635Q (right column) mice 24 hours after injection of vehicle (top row) or CL (bottom row), shown at 40x magnification (n = 3 mice per group). 10x magnification is shown in Supplemental Figure S1C. (G) Oxygen consumption rate of mitochondria isolated from BAT of 3-month-old female WT and Acss1K635Q/K635Q mice sequentially treated with 5 mM G3P and 3 mM GDP (n = 2 mice per group with 6 technical replicates each). Data shown as mean ± SEM. Comparisons were made by unpaired t-test (*p < 0.05).
We collected subcutaneous inguinal WAT (iWAT) and BAT at 0, 4, and 24 hours after CL injection to evaluate tissue histology and protein expression levels. We observed that, following injection, the suprascapular subcutaneous WAT depot became less apparent in WT mice but remained unchanged in Acss1K635Q/K635Q (Suppl. Figure 1A), suggesting that Acss1K635Q/K635Q mice were unable to utilize lipids from WAT depots during thermogenic stimulation.
Hematoxolin and eosin (H&E) staining showed a homogenous distribution of smaller lipid droplets in BAT from WT mice 24 hours after CL injection (Figure 2E, bottom left panel, and Suppl. Figure 1B). In contrast, BAT from Acss1K635Q/K635Q mice exhibited disorganized lipid droplet distribution with some cells containing large lipid droplets while others appeared completely exhausted with areas of dark staining (Figure 2E, bottom right panel, and Suppl. Figure 1B). H&E staining revealed a similar trend in iWAT, with Acss1K635Q/K635Q showing a heterogenous distribution of lipid droplets (more cells with smaller lipid droplets) as well as multilocular cells, which are not normally found in this tissue under basal conditions (Figure 2F, upper panels). After CL injection, iWAT from WT mice displayed smaller adipocytes and some multilocular cells (Figure 2F, lower left), while Acss1K635Q/K635Q showed numerous multilocular cells and areas of lipid exhaustion (Figure 2F, lower right panel, and Suppl. Figure 1C). These results imply a disruption of the FFA mobilization required for the thermogenic response and suggests that Acss1K635Q/K635Q mice are unable to metabolically adapt to the acute thermogenic response elicited by CL.
We also performed seahorse oxygen consumption assays with mitochondria isolated from WT and Acss1K635Q/K635Q BAT. In the presence of 10 mM BSA-conjugated palmitate, Acss1K635Q/K635Q BAT mitochondria showed lower basal respiration and reduced response to glycerol-3-phosphate (G3P), while inhibiting UCP1 with guanidine diphosphate (GDP) reduced oxygen consumption rate (OCR) by approximately 64% in both genotypes (Figure 2G). These results further suggest that mitochondria from Acss1K635Q/K635Q BAT show deficient respiration in the presence of palmitate, pointing out to deficient FAO metabolism which may impair thermogenesis.
3.3. Acss1K635Q adipose tissue displays dysregulated lipogenic signaling
Immunoblots were done to assess relative levels of major lipogenic, lipolytic, mitochondrial biogenesis, and thermogenic response proteins in BAT and iWAT at baseline and following CL injection (Figure 3A,B, quantified in Suppl. Figures 2 and 3). These experiments showed that the mitochondrial biogenesis marker, Peroxisome Proliferator-activated Receptor Gamma Coactivator 1-alpha (PGC1α), was significantly increased in both BAT and iWAT from Acss1K635Q/K635Q mice following CL treatment as compared to WT. Lipolytic activity in Acss1K635Q/K635Q, as assessed by Hormone Sensitive Lipase (HSL) phosphorylated at serine 563 versus total HSL, was decreased in BAT following CL treatment, while in iWAT it was significantly increased. The lipolytic proteins, Adipose Triglyceride Lipase (ATGL) and Perilipin 5 (PLIN5) did not show major changes.
Acss1-K635Q alters fatty acid utilization upon β3 adrenergic stimulation. (A) Immunoblots show protein levels in WT and Acss1K635Q/K635Q BAT following vehicle and 4 and 24 h CL treatment. VDAC serves as loading control for mitochondrial proteins UCP1, ACSS1, and HADHA (n = 3 mice for vehicle and 4 per treatment group). Quantification is shown in Supplemental Figure S2. (B) Immunoblots show protein levels in WT and Acss1K635Q/K635Q iWAT following vehicle and 4 and 24 h CL treatment. ATP5β serves as loading control for mitochondrial proteins UCP1, ACSS1, and HADHA (n = 3 mice for vehicle and 4 per treatment group). Quantification is shown in Supplemental Figure S3. (C-D) Acetyl-CoA levels were measured in WT and Acss1K635Q/K635Q BAT (C) and iWAT (D), and normalized to protein levels. Exact data points (each representing an individual mouse) are shown, as well as the mean ± SEM. Statistical comparisons of WT vs. Acss1K635Q/K635Q were calculated at each timepoint by two-way ANOVA with Tukey's Multiple Comparisons test (**p < 0.01). (E-F) Acetate levels were measured in WT and Acss1K635Q/K635Q BAT (E) and iWAT (F), and normalized to protein levels. Exact data points (each representing an individual mouse) are shown, as well as the mean ± SEM. Statistical comparisons of WT vs. Acss1K635Q/K635Q were calculated at each timepoint by two-way ANOVA with Tukey's Multiple Comparisons test (*p < 0.05).
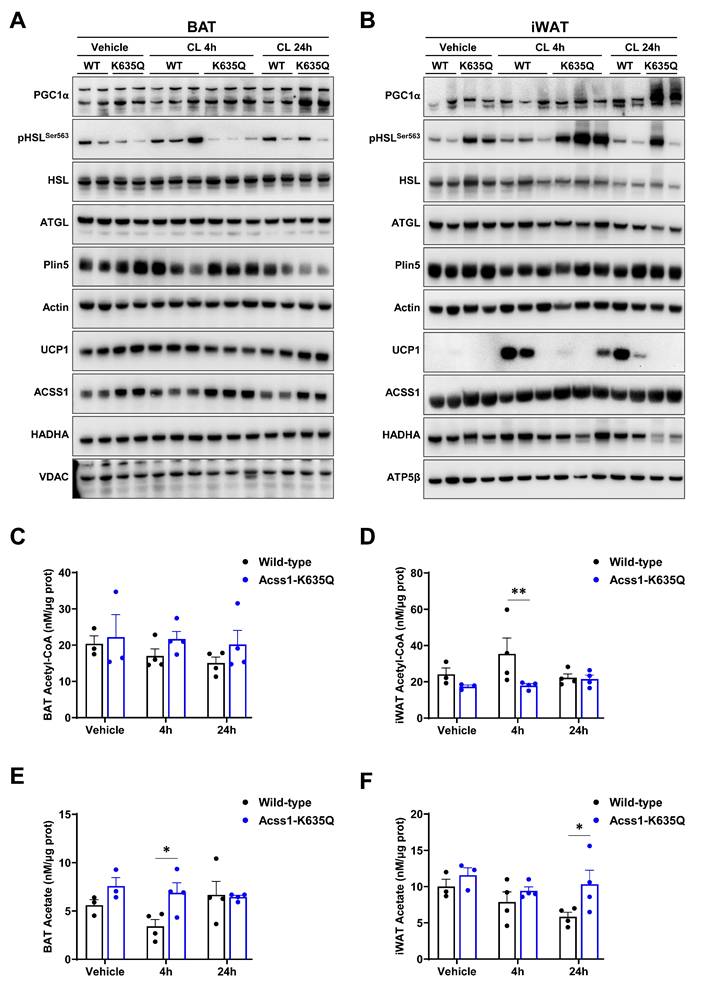
While baseline levels of UCP1 were higher in Acss1K635Q/K635Q BAT, no increase was observed following CL treatment. As expected, UCP1 was barely detectable in iWAT at baseline. However, UCP1 levels were significantly increased only in WT and not in Acss1K635Q/K635Q iWAT after CL treatment. Gene expression analysis by qPCR confirmed that, in contrast to WT, Acss1K635Q/K635Q iWAT did not significantly increase Ucp1 expression following CL treatment (Suppl. Figure 4A). The fact that iWAT was unable to upregulate UCP1 is striking and suggests an aberrant beiging response, which may contribute to the failure of Acss1K635Q/K635Q mice to maintain body temperature.
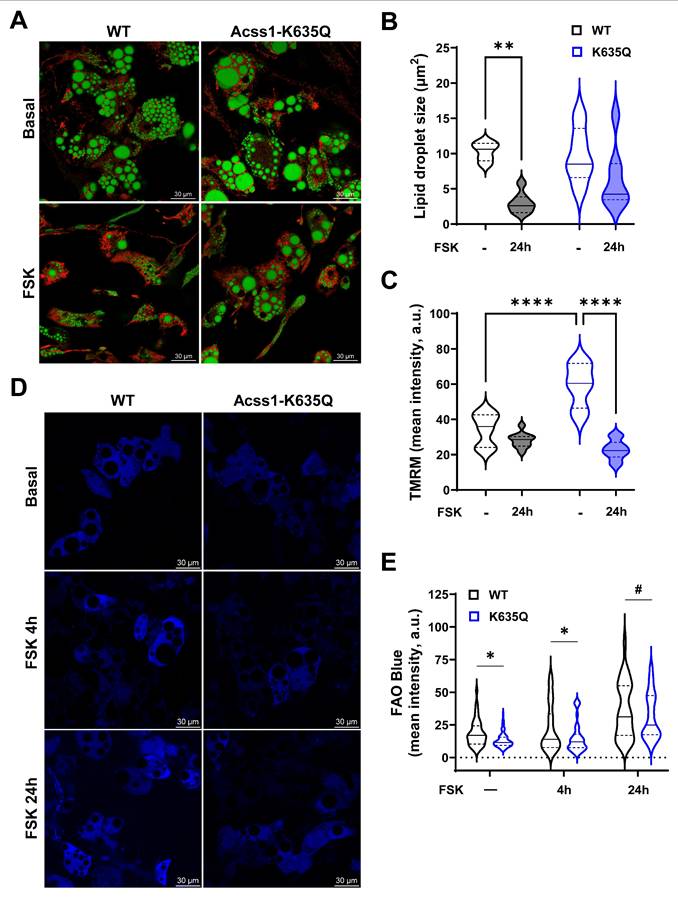
Acss1-K635Q alters fatty acid utilization in adipocytes differentiated ex vivo. (A) Adipocytes differentiated ex vivo from stromal cells isolated from WT and Acss1K635Q/K635Q mice were stained with bodipy for lipid droplets (green) and TMRM for mitochondrial membrane potential (red) staining ± 1 mM forskolin (FSK) for 24 h (n = 3 replicates). Scale bar = 30 μm. (B-C) Quantification of lipid droplet sizes (B) and TMRM fluorescence (C) in WT and Acss1-K635Q adipocytes ± 24 h FSK. Data distributions represented as violin plots with median and quartiles indicated. Statistical comparisons were calculated by unpaired t-test (**p < 0.01, ****p < 0.0001). (D) Adipocytes differentiated from WT and Acss1K635Q/K635Q mice stained with FAO Blue to visualize fatty acid oxidation in basal conditions and with 1 mM FSK at 4 h and 24 h (n = 4 replicates). Scale bar = 30 μm. (E) Quantification of FAO Blue fluorescence intensity at baseline and with FSK at 4 h and 24 h. Data distributions represented as violin plots with median and quartiles indicated. Statistical comparisons of WT vs. Acss1K635Q/K635Q were calculated at each timepoint by two-way ANOVA with Tukey's Multiple Comparisons test (#p < 0.1, *p < 0.05).
Interestingly, ACSS1 levels tended to be higher in Acss1K635Q/K635Q adipose tissues than in WT, which was not previously observed in other tissues [5], but may be an attempt to compensate for reduced ACSS1 activity, although Acss1 levels were not significantly different by qPCR analysis, except in Acss1K635Q/K635Q BAT 24 hours post CL injection (Suppl. Figure 4B). Finally, levels of the Hydroxyacyl-CoA Dehydrogenase Alpha subunit (HADHA), part of the trifunctional multienzyme protein for FAO, was slightly higher at basal levels in BAT, with a small decrease in Acss1K635Q/K635Q iWAT 24 hours post CL injection.
We also measured acetyl-CoA and acetate in BAT and iWAT from WT and Acss1K635Q/K635Q mice to assess the substrate and product levels that result from altered ACSS1 enzymatic activity. While we found no significant differences in BAT acetyl-CoA levels with CL treatment (Figure 3C), we observed consistently lower acetyl-CoA levels in iWAT from the Acss1K635Q/K635Q mice (Figure 3D). Acetate levels were increased in both tissues in Acss1K635Q/K635Q mice, as expected (Figure 3E and 3F). These data suggest that Acss1K635Q/K635Q iWAT specifically is not able to meet the metabolic demand elicited by CL and fails to produce adequate acetyl-CoA.
3.4. Acss1K635Q/K635Q ex vivo beige adipocytes display aberrant response to forskolin
Stromal vascular cells were isolated from Acss1K635Q/K635Q and WT mouse iWAT and differentiated into beige adipocytes to study lipid droplet utilization and mitochondrial function. Cells were exposed to 10 μM forskolin for 24 hours in order to stimulate lipolysis and thermogenesis [27]. Live cell imaging with bodipy was used to stain lipid droplets and tetramethylrhodamine methyl ester (TMRM) to assess mitochondrial membrane potential. WT beige adipocytes showed a significant reduction in lipid droplet size following forskolin treatment (Figure 4A, left panels, quantified in 4B). In contrast, Acss1K635Q/K635Q beige adipocytes showed a large range in the size of lipid droplets at baseline, which did not change with forskolin (Figure 4A, right panels, quantified in 4B). Mitochondrial membrane potential was decreased after forskolin treatment in WT cells as expected, due to UCP1 respiration uncoupling. However, Acss1K635Q/K635Q cells displayed a much higher membrane potential at baseline that was decreased following exposure to forskolin as they appeared to excessively depolarize suggesting a decrease in electron transport chain activity and the proton motive gradient (Figure 4A,C), pointing to a defect in mitochondrial function.
We used FAO Blue to measured FAO at baseline and after 4- and 24-hours forskolin treatment and found that FAO in Acss1K635Q/K635Q beige adipocytes tended to be lower than in WT at all timepoints (Figure 4D,E). All these data suggest that Acss1K635Q/K635Q beige adipocytes exhibit dysregulated lipolytic activity, FAO, and mitochondrial function.
4. Discussion
In this study, we demonstrate that Acss1K635Q/K635Q mice are intolerant to the thermogenic response elicited by CL being unable to maintain their body temperature with a dysregulated metabolic response. While these mice respond by increasing serum FFA, possibly increasing lipolysis to compensate for decreased FAO [21], fatty acids do not seem to be effectively oxidized. Although PGC1α is elevated in Acss1K635Q/K635Q adipose tissues and BAT showed high UCP1 levels, Acss1K635Q/K635Q iWAT failed to increase UCP1 in response to CL, suggesting impaired beiging. Mitochondria isolated from Acss1K635Q/K635Q BAT also showed impaired respiration. Although some compensatory responses appear to be present, such as higher FAO enzymatic expression and increased ACSS1, they are insufficient to compensate for ACSS1 functional deficiency in response to the metabolic demands induced by CL.
Following CL injection, we observed an immediate drop in glucose, which was recovered over the following 24 hours in wild-type mice but continued to fall in the Acss1K635Q/K635Q mice. It is interesting that some of the other metabolic changes were apparent at 4 hours while others are seen at 24 hours. While we don't have a definitive answer for this, one possible explanation is that the changes in metabolism following CL injection may be in a pathway and that the effects at 4 hours are early events and those later are downstream.
Others have demonstrated the essential role of mitochondrial fatty acid import and oxidation for BAT thermogenesis. For instance, carnitine palmitoyltransferase II (CPT2) is an integral protein of the inner mitochondrial membrane, required for the import of long-chain fatty acids and essential for thermogenesis and maintenance of BAT. Mice with adipose-specific knockout of Cpt2 fail to induce Ucp1 in BAT upon acute cold exposure or administration of CL, forskolin, or the general adrenergic agonist, isoproterenol [29], and showed structural deterioration of BAT in response to agonist treatment [20].
Loss of Sirt3 has been previously shown to impair lipid utilization, thermoregulation, and respiration in BAT mitochondria, without affecting UCP1 expression suggesting that UCP1-mediated thermogenesis is indirectly regulated by deacetylation [13], although this study did not identify a specific SIRT3 deacetylation target for thermogenesis. This data also suggests that SIRT3, and its deacetylation targets, may be part of an axis that regulates how cells utilize fatty acids under differing metabolic states [12, 30, 31]. In this regard, we clearly show that a constitutive ACSS1 acetylation mimic disrupts BAT lipid utilization and impairs the thermogenic response, as demonstrated by the increase in serum FFA and metabolic crisis in Acss1K635Q/K635Q mice after CL injection. Further studies are needed to delineate the molecular mechanisms underlying the role of ACSS1 in lipid metabolism and the thermogenic response.
De novo lipogenesis, the process of converting glucose into fatty acids, plays a crucial role in thermogenesis within brown adipocytes [32]. This is unusual, as fatty acid synthesis and oxidation typically counteract each other in other tissues [33]. To maintain homeostasis and thermogenesis in BAT, a tightly regulated balance exists between lipolysis and lipogenesis. De novo lipogenesis relies on acetyl-CoA as a substrate. Unlike other members of the acyl-CoA synthetase family, ACSS1-3 enzymes specifically catalyze the conversion of acetate and CoA into acetyl-CoA, playing a unique role in lipid metabolism. Furthermore, ACSS1 is more highly abundant in BAT as compared to WAT, suggesting a possible involvement in thermogenesis [34]. In this regard, the reduced enzymatic activity of acetylated ACSS1 may lead to lower levels of acetyl-CoA and intermediates feeding the TCA cycle and ultimately to lower FAO [35]. This may underlie the apparent metabolic crisis in Acss1K635Q/K635Q mice, which are unable to meet the acute energy demand elicited by CL.
Lower acetyl-CoA levels should signal for increased FAO activity and lipolysis [36], which fits our observations of increased levels of HADHA and lipolytic activity in Acss1K635Q/K635Q. Another plausible mechanism for the lower FAO activity observed in these mice might be that lower acetyl-CoA levels leads to lower fatty acid esterification with acetyl-CoA which is needed in order to activate them into acyl-CoA molecules and enter FAO cycles [37]. Additionally, it has been described before that excess FFA in BAT upregulate both expression of UCP1 [38]. We conclude that full ACSS1 functionality is needed during the thermogenic response elicited by CL, which it is unable to meet in an acetylated state. Acss1K635Q/K635Q mice represent a constitutively acetylated enzyme that cannot be further regulated by this post-translational modification. This might lead to lower acetyl-CoA intermediates that feed the TCA cycle, causing an acute energetic deficit and failure to maintain body temperature. However, further mechanistic studies are needed to dissect the exact molecular mechanism.
Abbreviations
ACSS1: Acyl-CoA synthetase short chain family member 1; BAT: brown adipose tissue; BCA: bicinchoninic acid; CL: CL-316243; CoA: coenzyme A; DMEM: Dulbecco's modified Eagle medium; EGTA: ethylene glycol tetraacetic acid; FAO: fatty acid oxidation; FFA: free fatty acid; FSK: forskalin; G3P: glycerol-3-phosphate; GDP: guanosine diphosphate; H&E: haematoxylin and eosin; HADHA: Hydroxyacyl-CoA Dehydrogenase Alpha subunit; HEPES: 4-(2-hydroxyethyl)-1-piperazineethanesulfonic acid; HRP: horseradish peroxidase; HSL: hormone sensitive lipase; IP: intra-peritoneal; iWAT: inguinal white adipose tissue; MAS: mitochondria assay solution; OCR: oxygen consumption rate; PBS: phosphate buffered saline; PGC1α: peroxisome proliferator-activated receptor gamma coactivator 1-alpha; PVDF: polyvinylidene difluoride; SDS-PAGE: sodium dodecyl sulfate polyacrylamide gel electrophoresis; SIRT3: sirtuin 3; TMRM: tetramethylrhodamine methyl ester; UCP1: uncoupling protein 1; WAT: white adipose tissue; WT: wild-type.
Supplementary Material
Supplementary figures.
Acknowledgements
We would like to thank the Histology and Immunohistochemistry Laboratory core at the University of Texas San Antonio Health Science Center for preparing the paraffin-embedded tissue slides and for performing the hematoxylin and eosin staining.
Funding
DG is funded by National Cancer Institute (NCI) grants R01CA257148, R01CA214025, and the Cancer Prevention and Research Institute of Texas (CPRIT) grant, RR20012. ESC is funded by R01CA152601 Supplement from the NCI. JS is funded by the National Institute on Aging (NIA) Training Program for Research Scientists in the Biology of Aging T32AG021890-20. MAGP is funded by the National Institutes of Health (NIH) grant R56DK144158. Additional support was provided by the Sam and Ann Barshop Institute for Longevity and Aging Studies and the San Antonio Nathan Shock Center.
Author contributions
ESC, DZ, BS, JS, DC, GL, and PS designed and performed experiments. HJ and FFD provided support for murine studies. ESC, SZ, MAGP, and DG supervised all experiments. ESC, DZ, BS, JS, DC, EM, SZ, and MAGP analyzed data and assembled figures. ESC, EM, MAGP, and DG wrote and edited the manuscript. All authors read and approved the manuscript.
Competing Interests
The authors have declared that no competing interest exists.
References
1. Schug ZT, Peck B, Jones DT, Zhang Q, Grosskurth S, Alam IS. et al. Acetyl-CoA synthetase 2 promotes acetate utilization and maintains cancer cell growth under metabolic stress. Cancer Cell. 2015;27:57-71
2. Castro LF, Lopes-Marques M, Wilson JM, Rocha E, Reis-Henriques MA, Santos MM. et al. A novel Acetyl-CoA synthetase short-chain subfamily member 1 (Acss1) gene indicates a dynamic history of paralogue retention and loss in vertebrates. Gene. 2012;497:249-55
3. Choudhary C, Weinert BT, Nishida Y, Verdin E, Mann M. The growing landscape of lysine acetylation links metabolism and cell signalling. Nat Rev Mol Cell Biol. 2014;15:536-50
4. Baeza J, Smallegan MJ, Denu JM. Mechanisms and Dynamics of Protein Acetylation in Mitochondria. Trends Biochem Sci. 2016;41:231-44
5. Hirschey MD, Shimazu T, Huang JY, Schwer B, Verdin E. SIRT3 Regulates Mitochondrial Protein Acetylation and Intermediary Metabolism. Cold Spring Harb Symp Quant Biol. 2011
6. Pougovkina O, te Brinke H, Ofman R, van Cruchten AG, Kulik W, Wanders RJ. et al. Mitochondrial protein acetylation is driven by acetyl-CoA from fatty acid oxidation. Hum Mol Genet. 2014;23:3513-22
7. Xu G, Quan S, Schell J, Gao Y, Varmazyad M, Sreenivas P. et al. Mitochondrial ACSS1-K635 acetylation knock-in mice exhibit altered metabolism, cell senescence, and nonalcoholic fatty liver disease. Sci Adv. 2024;10:eadj5942
8. Hallows WC, Lee S, Denu JM. Sirtuins deacetylate and activate mammalian acetyl-CoA synthetases. Proc Natl Acad Sci U S A. 2006;103:10230-5
9. Schwer B, Bunkenborg J, Verdin RO, Andersen JS, Verdin E. Reversible lysine acetylation controls the activity of the mitochondrial enzyme acetyl-CoA synthetase 2. Proc Natl Acad Sci U S A. 2006;103:10224-9
10. Hirschey MD, Shimazu T, Capra JA, Pollard KS, Verdin E. SIRT1 and SIRT3 deacetylate homologous substrates: AceCS1,2 and HMGCS1,2. Aging (Albany NY). 2011;3:635-42
11. Yoshimura Y, Araki A, Maruta H, Takahashi Y, Yamashita H. Molecular cloning of rat acss3 and characterization of mammalian propionyl-CoA synthetase in the liver mitochondrial matrix. J Biochem. 2017;161:279-89
12. Hirschey MD, Shimazu T, Goetzman E, Jing E, Schwer B, Lombard DB. et al. SIRT3 regulates mitochondrial fatty-acid oxidation by reversible enzyme deacetylation. Nature. 2010;464:121-5
13. Sebaa R, Johnson J, Pileggi C, Norgren M, Xuan J, Sai Y. et al. SIRT3 controls brown fat thermogenesis by deacetylation regulation of pathways upstream of UCP1. Mol Metab. 2019;25:35-49
14. Becher T, Palanisamy S, Kramer DJ, Eljalby M, Marx SJ, Wibmer AG. et al. Brown adipose tissue is associated with cardiometabolic health. Nat Med. 2021;27:58-65
15. Chondronikola M, Volpi E, Borsheim E, Porter C, Annamalai P, Enerback S. et al. Brown adipose tissue improves whole-body glucose homeostasis and insulin sensitivity in humans. Diabetes. 2014;63:4089-99
16. Harms M, Seale P. Brown and beige fat: development, function and therapeutic potential. Nat Med. 2013;19:1252-63
17. Angueira AR, Shapira SN, Ishibashi J, Sampat S, Sostre-Colon J, Emmett MJ. et al. Early B Cell Factor Activity Controls Developmental and Adaptive Thermogenic Gene Programming in Adipocytes. Cell Rep. 2020;30:2869-78 e4
18. Ouellet V, Labbe SM, Blondin DP, Phoenix S, Guerin B, Haman F. et al. Brown adipose tissue oxidative metabolism contributes to energy expenditure during acute cold exposure in humans. J Clin Invest. 2012;122:545-52
19. Cannon B, Nedergaard J. Brown adipose tissue: function and physiological significance. Physiol Rev. 2004;84:277-359
20. Gonzalez-Hurtado E, Lee J, Choi J, Wolfgang MJ. Fatty acid oxidation is required for active and quiescent brown adipose tissue maintenance and thermogenic programing. Mol Metab. 2018;7:45-56
21. Fedorenko A, Lishko PV, Kirichok Y. Mechanism of fatty-acid-dependent UCP1 uncoupling in brown fat mitochondria. Cell. 2012;151:400-13
22. Shin H, Ma Y, Chanturiya T, Cao Q, Wang Y, Kadegowda AKG. et al. Lipolysis in Brown Adipocytes Is Not Essential for Cold-Induced Thermogenesis in Mice. Cell Metab. 2017;26:764-77 e5
23. Xu G, Schell J, Quan S, Gao Y, Wei SJ, Pan M. et al. Mitochondrial ACSS1-K635 acetylation knock-in mice exhibit altered liver lipid metabolism on a ketogenic diet. Free Radic Biol Med. 2025;232:260-8
24. Goswami PC, Sheren J, Albee LD, Parsian A, Sim JE, Ridnour LA. et al. Cell cycle-coupled variation in topoisomerase IIalpha mRNA is regulated by the 3'-untranslated region. Possible role of redox-sensitive protein binding in mRNA accumulation. J Biol Chem. 2000;275:38384-92
25. Wang T, Hu YC, Dong S, Fan M, Tamae D, Ozeki M. et al. Co-activation of ERK, NF-kappaB, and GADD45beta in response to ionizing radiation. J Biol Chem. 2005;280:12593-601
26. Kim HS, Patel K, Muldoon-Jacobs K, Bisht KS, Aykin-Burns N, Pennington JD. et al. SIRT3 is a mitochondria-localized tumor suppressor required for maintenance of mitochondrial integrity and metabolism during stress. Cancer Cell. 2010;17:41-52
27. Tao R, Coleman MC, Pennington JD, Ozden O, Park SH, Jiang H. et al. Sirt3-mediated deacetylation of evolutionarily conserved lysine 122 regulates MnSOD activity in response to stress. Mol Cell. 2010;40:893-904
28. Yu G, Wu X, Kilroy G, Halvorsen YD, Gimble JM, Floyd ZE. Isolation of murine adipose-derived stem cells. Methods Mol Biol. 2011;702:29-36
29. Lee J, Ellis JM, Wolfgang MJ. Adipose fatty acid oxidation is required for thermogenesis and potentiates oxidative stress-induced inflammation. Cell Rep. 2015;10:266-79
30. Yang S, Wang X, Zhang Y, Ke Q, Su W, Zhou Y. et al. SIRT3 regulates CPT1a acetylation and fatty acid oxidation in renal tubular epithelial cells under diabetic condition. Mol Biol Rep. 2025;52:603
31. Li M, Li CM, Ye ZC, Huang J, Li Y, Lai W. et al. Sirt3 modulates fatty acid oxidation and attenuates cisplatin-induced AKI in mice. J Cell Mol Med. 2020;24:5109-21
32. Lee HJ, Lee J, Yang MJ, Kim YC, Hong SP, Kim JM. et al. Endothelial cell-derived stem cell factor promotes lipid accumulation through c-Kit-mediated increase of lipogenic enzymes in brown adipocytes. Nat Commun. 2023;14:2754
33. Sanchez-Gurmaches J, Tang Y, Jespersen NZ, Wallace M, Martinez Calejman C, Gujja S. et al. Brown Fat AKT2 Is a Cold-Induced Kinase that Stimulates ChREBP-Mediated De Novo Lipogenesis to Optimize Fuel Storage and Thermogenesis. Cell Metab. 2018;27:195-209 e6
34. Forner F, Kumar C, Luber CA, Fromme T, Klingenspor M, Mann M. Proteome differences between brown and white fat mitochondria reveal specialized metabolic functions. Cell Metab. 2009;10:324-35
35. Jaswal JS, Keung W, Wang W, Ussher JR, Lopaschuk GD. Targeting fatty acid and carbohydrate oxidation-a novel therapeutic intervention in the ischemic and failing heart. Biochim Biophys Acta. 2011;1813:1333-50
36. Abo Alrob O, Lopaschuk GD. Role of CoA and acetyl-CoA in regulating cardiac fatty acid and glucose oxidation. Biochem Soc Trans. 2014;42:1043-51
37. Merritt JL 2nd, Norris M, Kanungo S. Fatty acid oxidation disorders. Ann Transl Med. 2018;6:473
38. Divakaruni AS, Humphrey DM, Brand MD. Fatty acids change the conformation of uncoupling protein 1 (UCP1). J Biol Chem. 2012;287:36845-53
Author contact
![]() Corresponding author: David Gius, MD, PhD., Professor of Radiation Oncology, Assistant Dean for Research, Joe R. & Teresa Lozano Long School of Medicine, Associate Cancer Center Director, Mays Cancer Center at UT Health San Antonio MD Anderson, 7979 Wurzbach Road, San Antonio, TX 78229, United States, (210) 450-0781, giusedu.
Corresponding author: David Gius, MD, PhD., Professor of Radiation Oncology, Assistant Dean for Research, Joe R. & Teresa Lozano Long School of Medicine, Associate Cancer Center Director, Mays Cancer Center at UT Health San Antonio MD Anderson, 7979 Wurzbach Road, San Antonio, TX 78229, United States, (210) 450-0781, giusedu.